Content delivery network reports
A content delivery network (CDN) is a set of servers located in multiple geographical locations to help ensure faster web content delivery. Using Site24x7's CDN Report, you can obtain granular data that helps you analyze the performance of your websites. Site24x7 uses headers to identify resources shared from a CDN server, and details related to such resources are included in the CDN Report. The CDN Report is available for Webpage Speed (Browser) monitors.
Use cases
How can the top missed resources list help you optimize your website's performance?
- A missed request indicates that the CDN's cache could not serve a resource requested by a user. This can lead to slow-loading pages and poor page performance.
- A missed resource request can indicate an incorrect CDN configuration or a distant CDN server. Website owners can optimize their servers using this data.
- Identifying the top missed resources can help the owner optimize their content delivery strategies to improve their website's performance.
- Identifying the top searched resources or content can help you create better content delivery strategies, like using a different CDN server or caching popular content.
- Repeated missed requests can also be due to any issues with a resource, and debugging might help fix it.
Generating the report
- Log in to Site24x7.
- Navigate to Reports > CDN Report.
- On the new page that opens, click your preferred section to view all the related details.
- Click the Share This button to export the report as a PDF or share it via email.
CDN Report
A CDN Report is generated by taking the headers into consideration. The supported header types are as follows:
- x-cache
- cf-cache-status
- server-timing
- x-proxy-cache
- x-origin-cache
- akamai-cache-status
- x-sucuri-cache
- x-cf
The following information is available in the CDN Report:
Summary Report
The Summary Report is a consolidated report for all your domains, pooling together the data related to all your Webpage Speed (Browser) monitors.
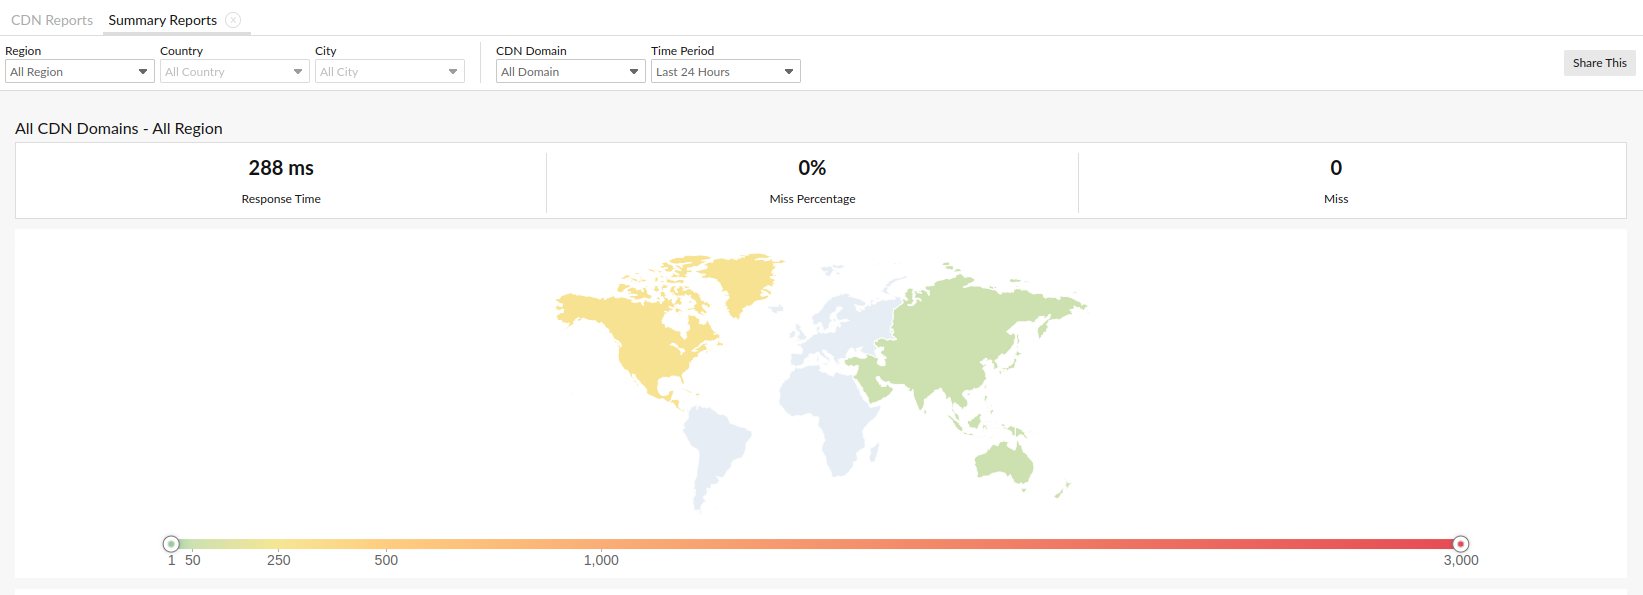
Location-based data
A graphical representation of data from all your chosen locations is available in the first section of the report. By hovering over each region, you are able to view further details related to that region. Moreover, you can use the drop-down menus provided at the top of the page to specify your Region, Country, City, CDN Domain, and Time Period preferences.
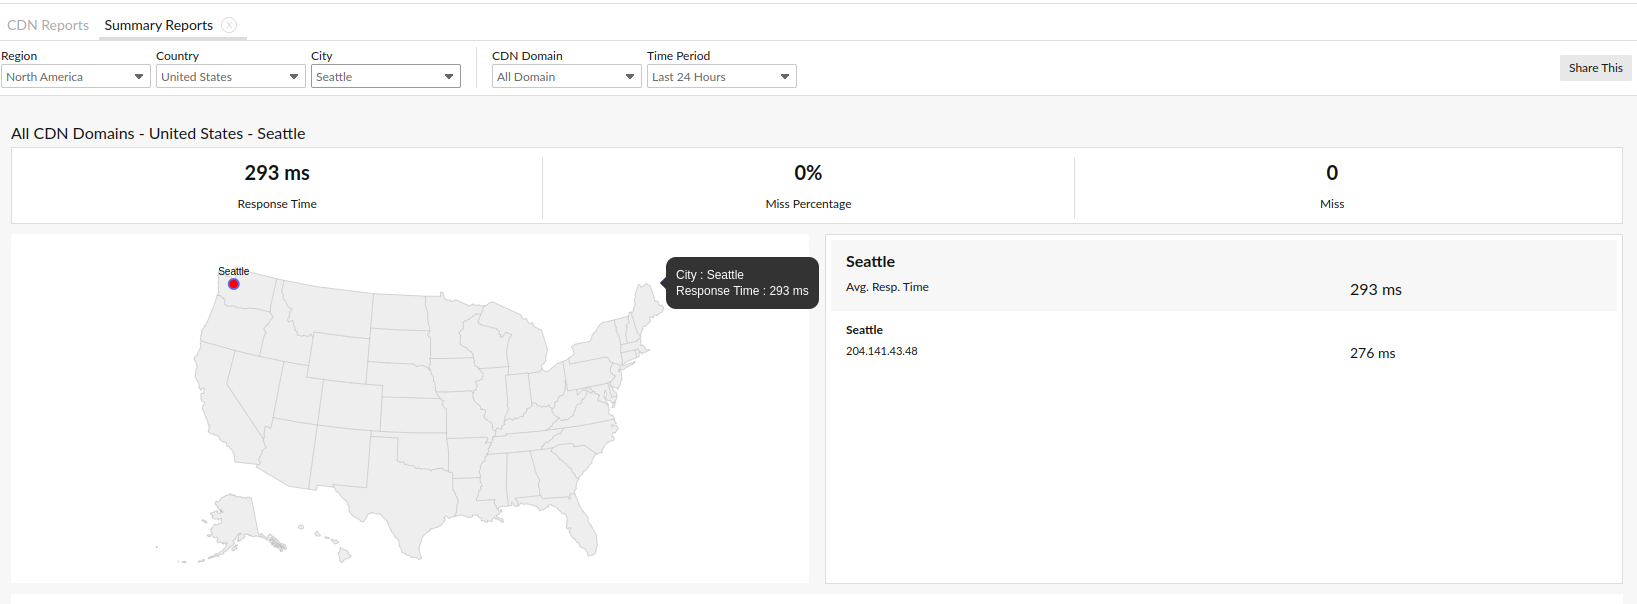
You can also obtain the average response time for all these locations and the Miss %, which is calculated by using this formula:
[Misses/(Misses+Hits)]*100
Here, "Misses" refers to the number of requests that were fetched from the origin server. "Hits" refers to the number of successful responses from the server.
The Response Time graph provides detailed information on the timestamp-based response time values.

The Miss % graph also provides a pictorial representation of the percentage of misses at a specific time.

Domain Summary
The Domain Summary section includes the following details:
- The name of the CDN domain
- The time taken, in milliseconds, for the response to be received from the server
- The number of missed requests from the domain
- The response time taken for the missed responses
- The percentage of requests that were misses
- The number of hits or the number of requests that were fetched from the edge server
- The response time taken, in milliseconds, for the hit requests
- The percentage of requests that were hits
- The total number of failed requests from the domain (if the status code of a resource in the domain is 400 or above, then it is considered a failed request)
- The DNS time or the average time taken for domain name resolution
- The average throughput or the number of kilobytes downloaded per second

Average Response Time-CDN Edge Server
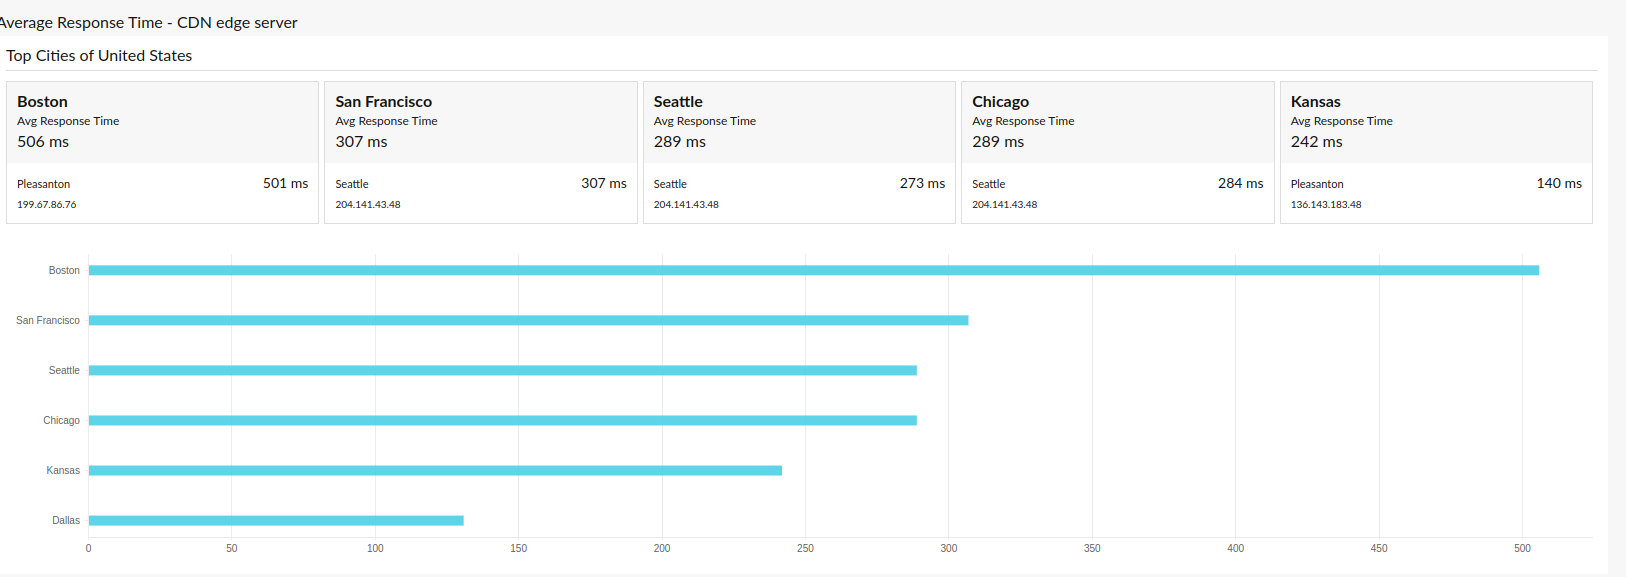
This section includes the average response time for the CDN edge servers for all the locations or for the specific locations you have chosen. The top countries in that region and their data are also displayed. The location with the highest response time is listed with the respective response time.
Location Summary
This section provides all the details related to a particular location. In the case of countries like India, China, or the United States, you can choose the cities for which you wish to view the granular data.

CDN vs. Origin Server
This section shows a graphical comparison of data obtained about the CDN servers as well as about the origin servers. A split-up of important metrics, like the DNS Time, Connection Time, SSL Handshake Time, First Byte Time, Document Complete Time, and Response Time, is displayed on the graph. This data can be obtained for the entire domain from all or specific locations.

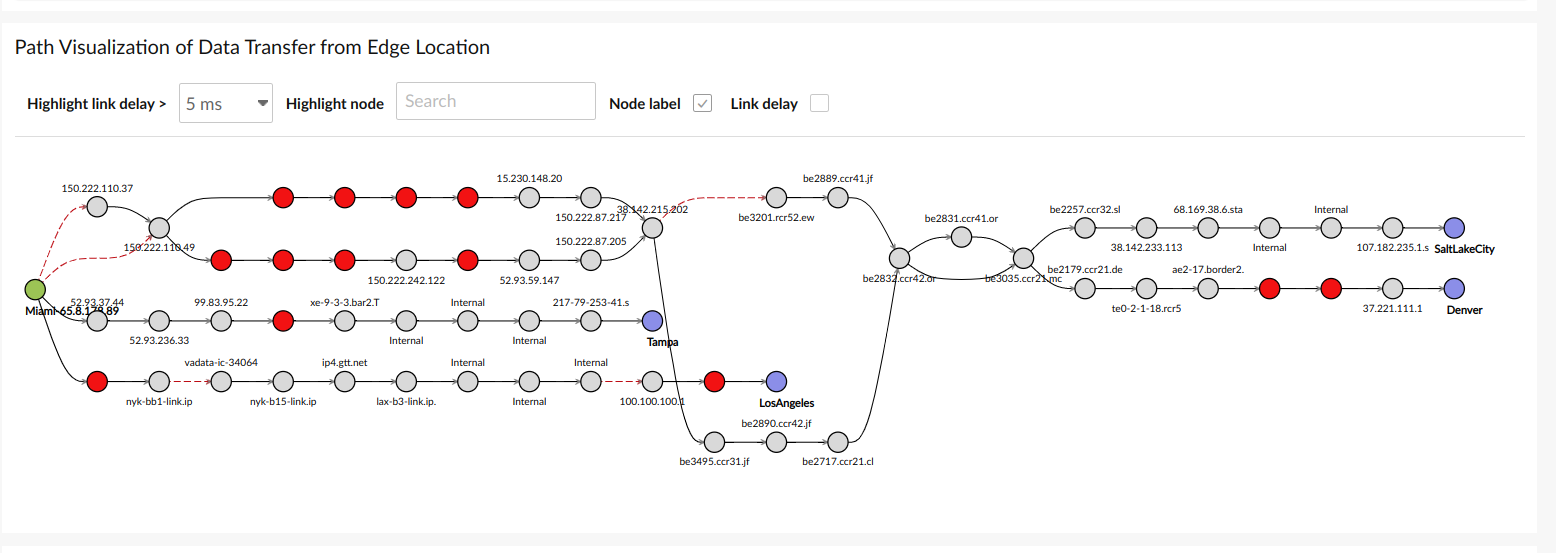
You can view the path visualization of data transfer from the edge server to location servers by choosing a specific country and domain.
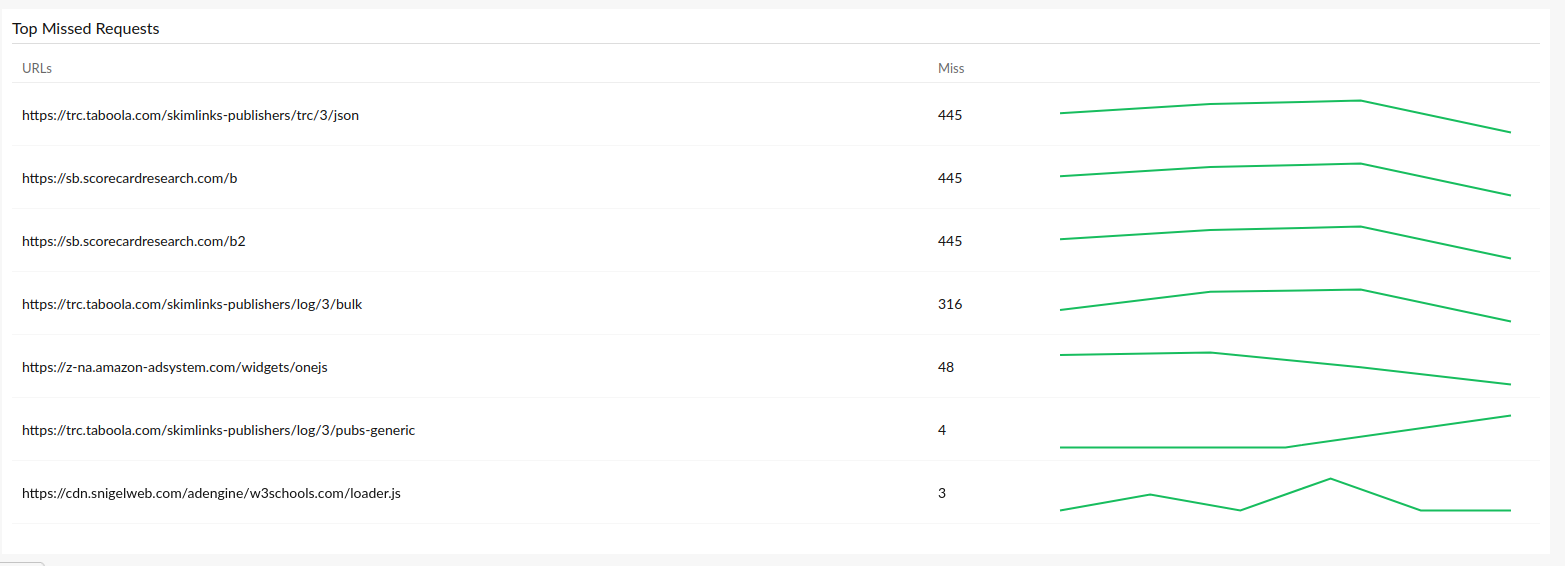
Top Missed Requests
This section displays the URLs, the number of missed requests, and a sparkling chart representing the misses based on timestamps.
Top N Reports
The Top N Reports option includes a list of reports such as:
Frequently Missed Resources
This section lists the top frequently missed resources with the number of misses, Miss %, average response time, and resource size. You can choose to view the Top 5 or up to the Top 100 resources for time periods spanning from the Last Hour to the Last 24 Hours.

Large Resources
All the resources with large sizes are displayed in this section in descending order of their size, along with the average response time and Miss %.

Slow Loading Resources
The top slow-loading resources in a domain are listed in descending order of their response time, along with the size and Miss %.

Slow Loading CDN Domains
The domains that have the highest response times are listed in descending order of their response time, along with the number of misses, Miss %, and size.

Resources with Low TTL
The time to live (TTL) denotes the amount of time a piece of data will be stored in the cache. Once that time is over, the data should be fetched from the origin server. In this section, the resources, their TTL, and their average response times are listed.

