
iOS App: Alarms
Alarms in the Site24x7 iOS app let you keep tabs on all the monitor issues in your configured account by grouping all alerts by the monitor name and severity. Here's how you can navigate the Alarms tab and leverage its features:
- Access detailed information: View root cause analysis for Trouble and Down alarms.
- Assign technicians and manage comments: Assign technicians and manage comments for efficient task handling.
- Create shortcuts: Set up shortcuts for quick access to frequently monitored alarms, streamlining your task management.
- Filter anomalies: Filter anomalies by the time period and severity, helping you focus on the most critical issues.
- Maximize monitoring effectiveness: Use these features to enhance the efficiency and effectiveness of your monitoring efforts.
Steps
Select Alarms from the bottom navigation bar to navigate to the Alarms page.

Tap the Menu icon  at the top-left of the screen to choose from the following options:
- Alarms
- Problems
- Anomalies
-
Alarms
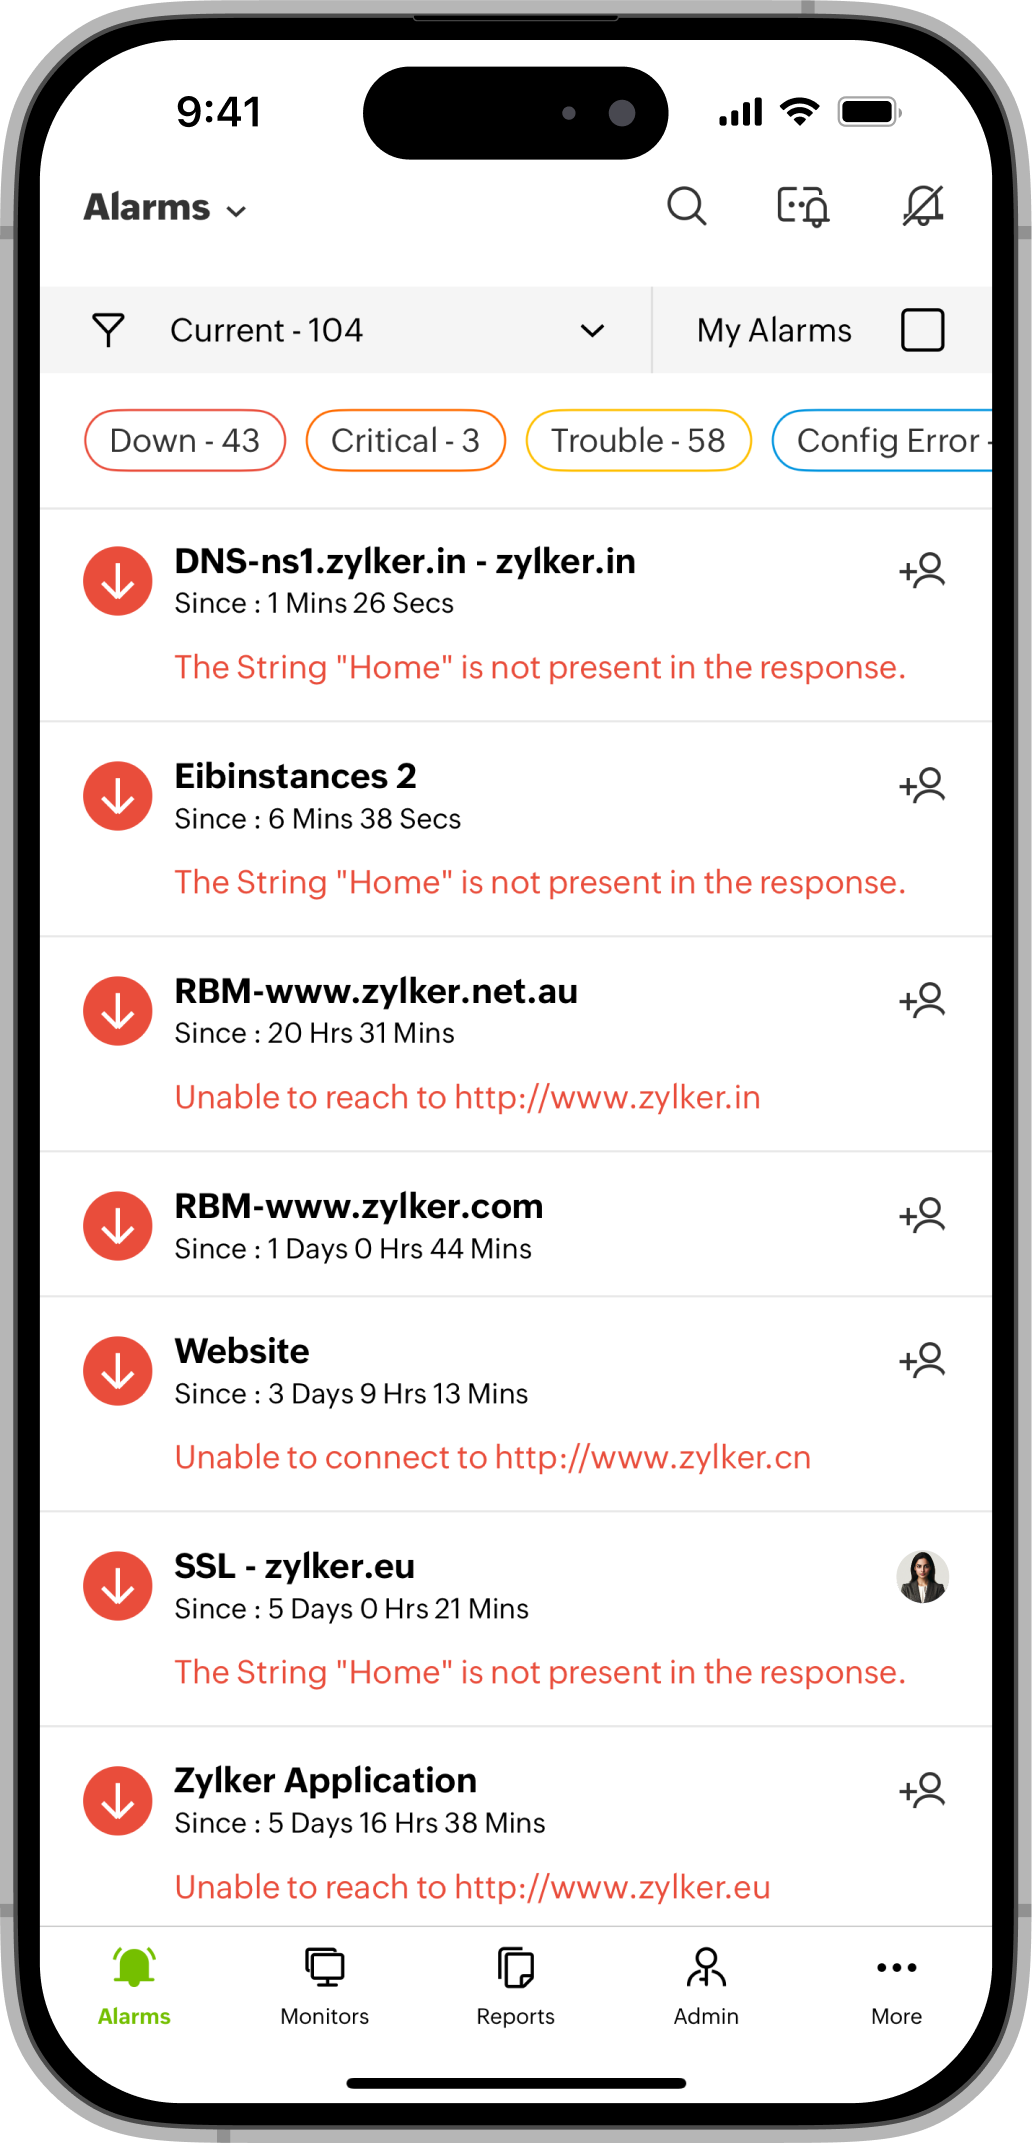
Get a detailed list of alarms, including their status (Critical, Trouble, Down, and Config Error), the date on which the alarm was triggered, and an overall count of alarms of each status.
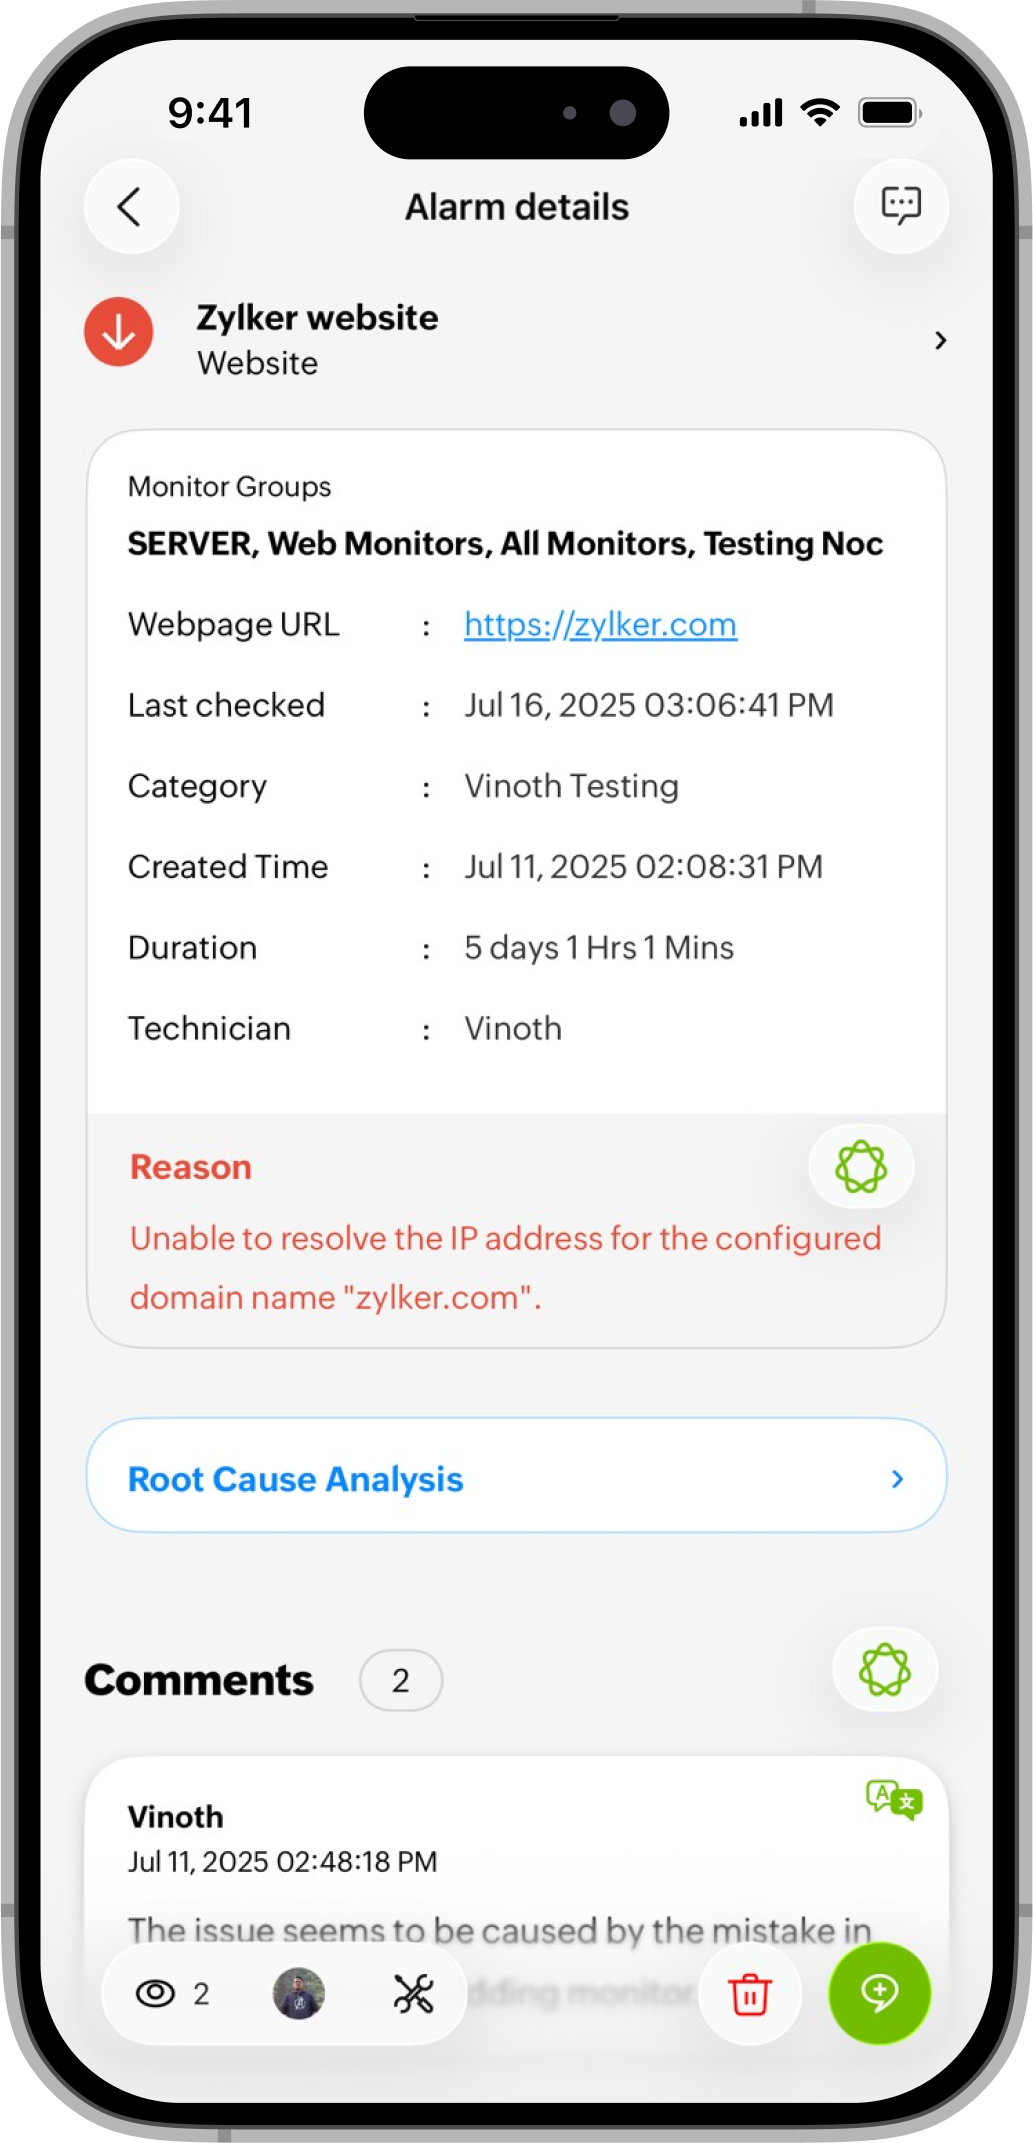
- On the Alarm Details page:
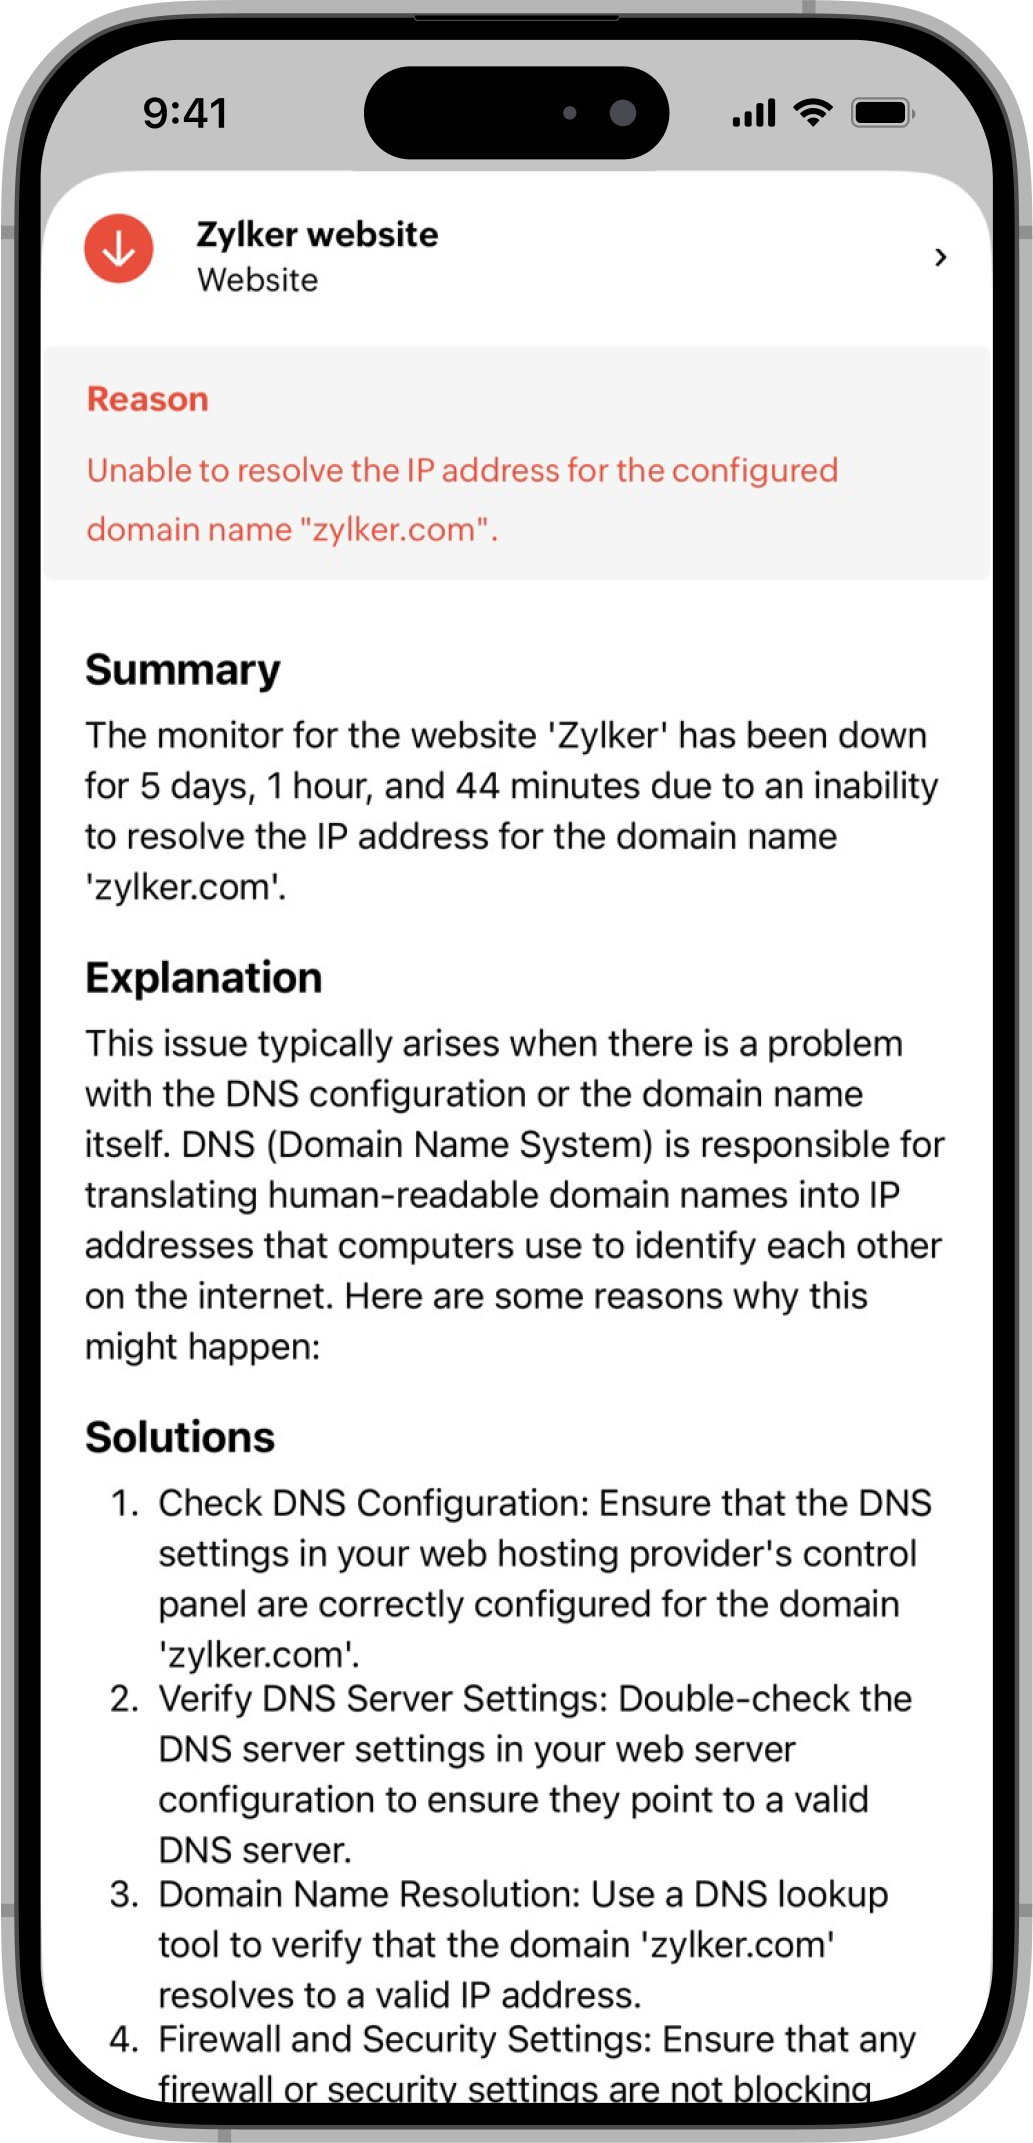
- The Reasons section displays why the monitor is down. Tapping the Apple Intelligence icon
 provides a detailed explanation of the downtime, enabling you to take the necessary action based on the summary provided. (Available in iOS 26.)
- Click Root Cause Analysis to view the monitor’s RCA report.
- The Comments section displays all comments along with the total count. Long press on any comment to Copy, Edit, or Delete it.
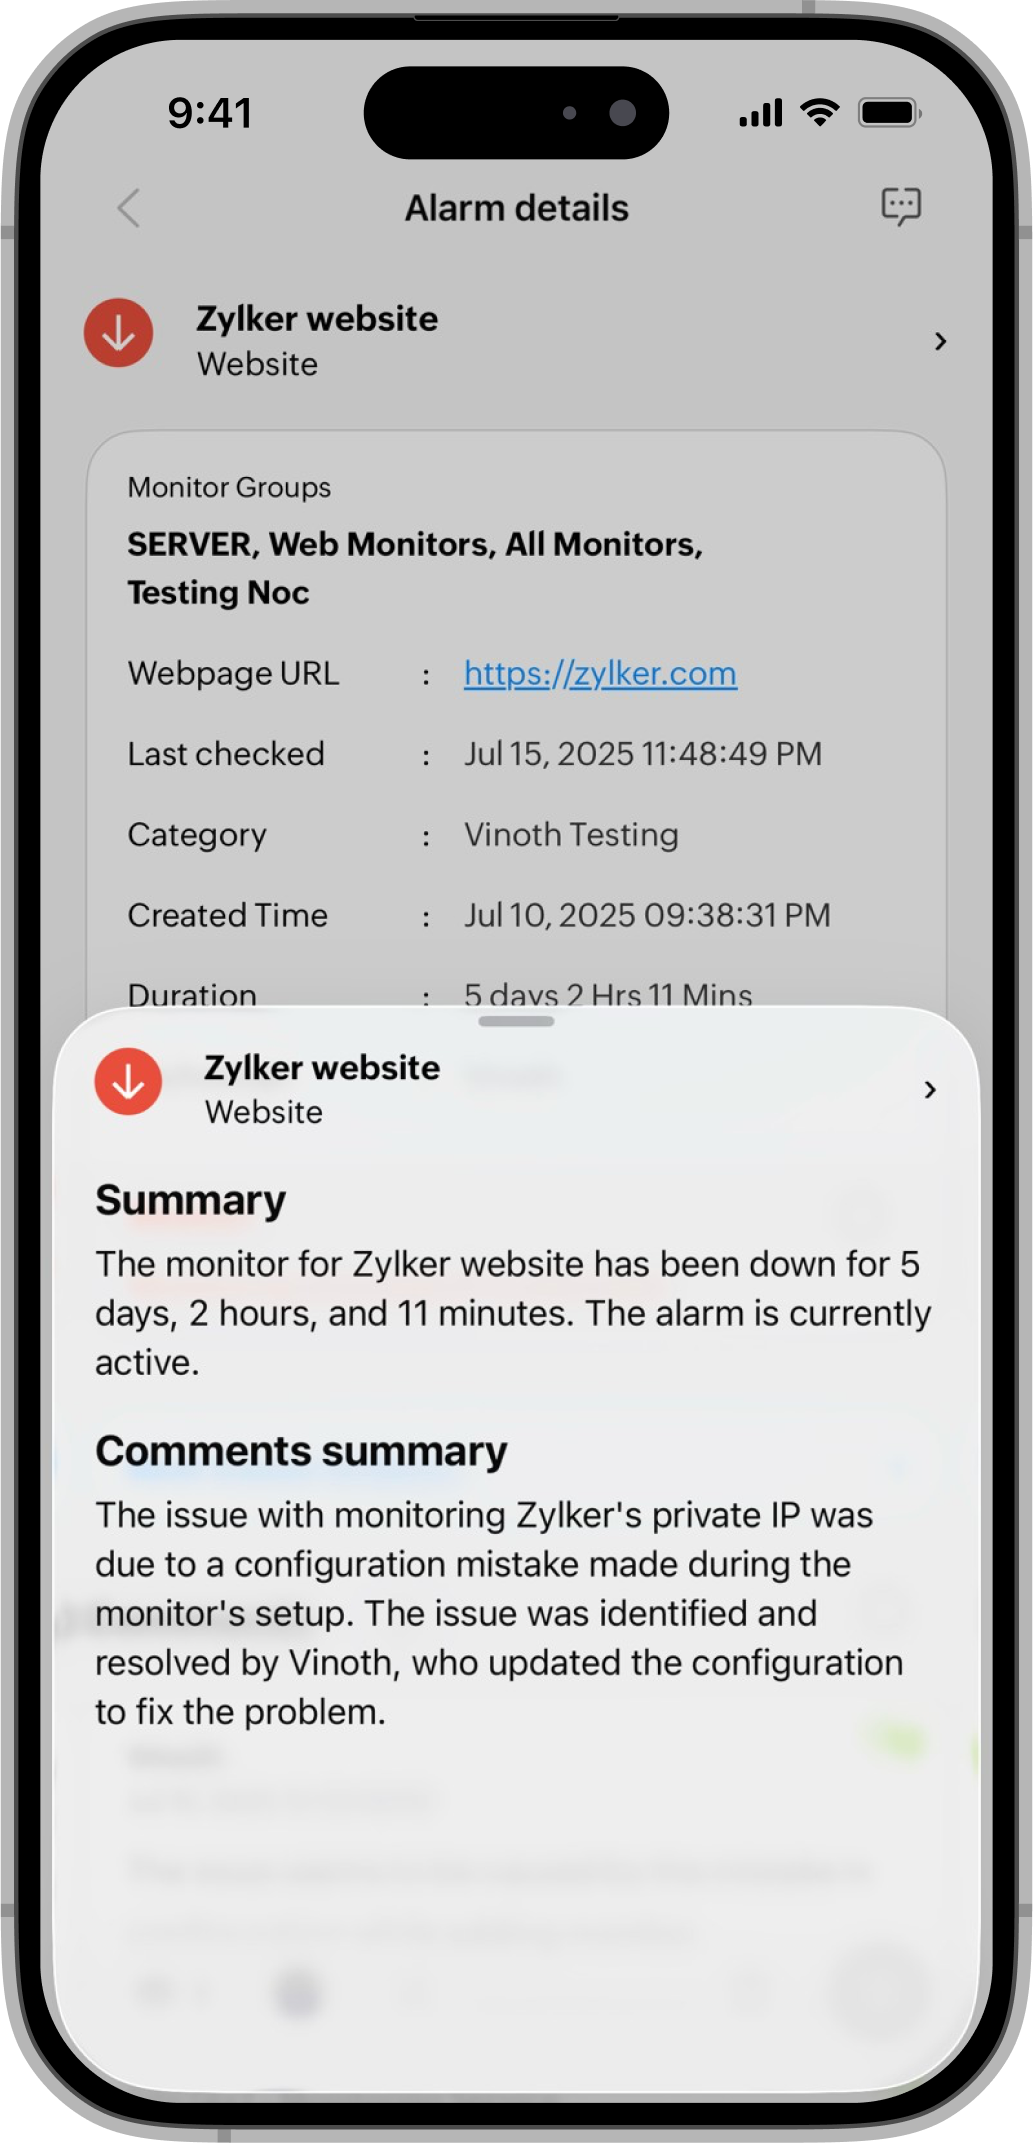
- Tap the Apple Intelligence icon to view a condensed summary of all comments so you don’t have to read through lengthy threads.
- The Reasons section displays why the monitor is down. Tapping the Apple Intelligence icon
- Assign a technician: Click on the to assign a technician to an alarm.
- On the Alarm Details page:
-
Bottom navigation bar
The table below lists the icons and their purposes.
Icon Description 
(Eye icon)
To view the number of alarm views. 
(Assign Technician)
To assign a technician to the alarm. 
(Maintenance)
To mark an alarm as maintenance. 
(Delete)
To delete an alarm. 
(Add comment)
Add a comment to the alarm. Long press an alarm, and you will have the below options:- Technician: Assign a technician to an alarm by selecting them from the list and clicking the Done button.
- Assign: This assigns the selected technician to the alarm, helping to resolve and troubleshoot issues more quickly.
- Maintenance: Mark an alarm as maintenance and select the period for maintenance.
- Delete: Select this option to delete an alarm.
- Create Shortcut: Create shortcuts for your alarms and add them to your home screen for regular monitoring. Long press the Site24x7 app to see a list of all alarms. By selecting an alarm, you'll be taken directly to the Alarm Details page.
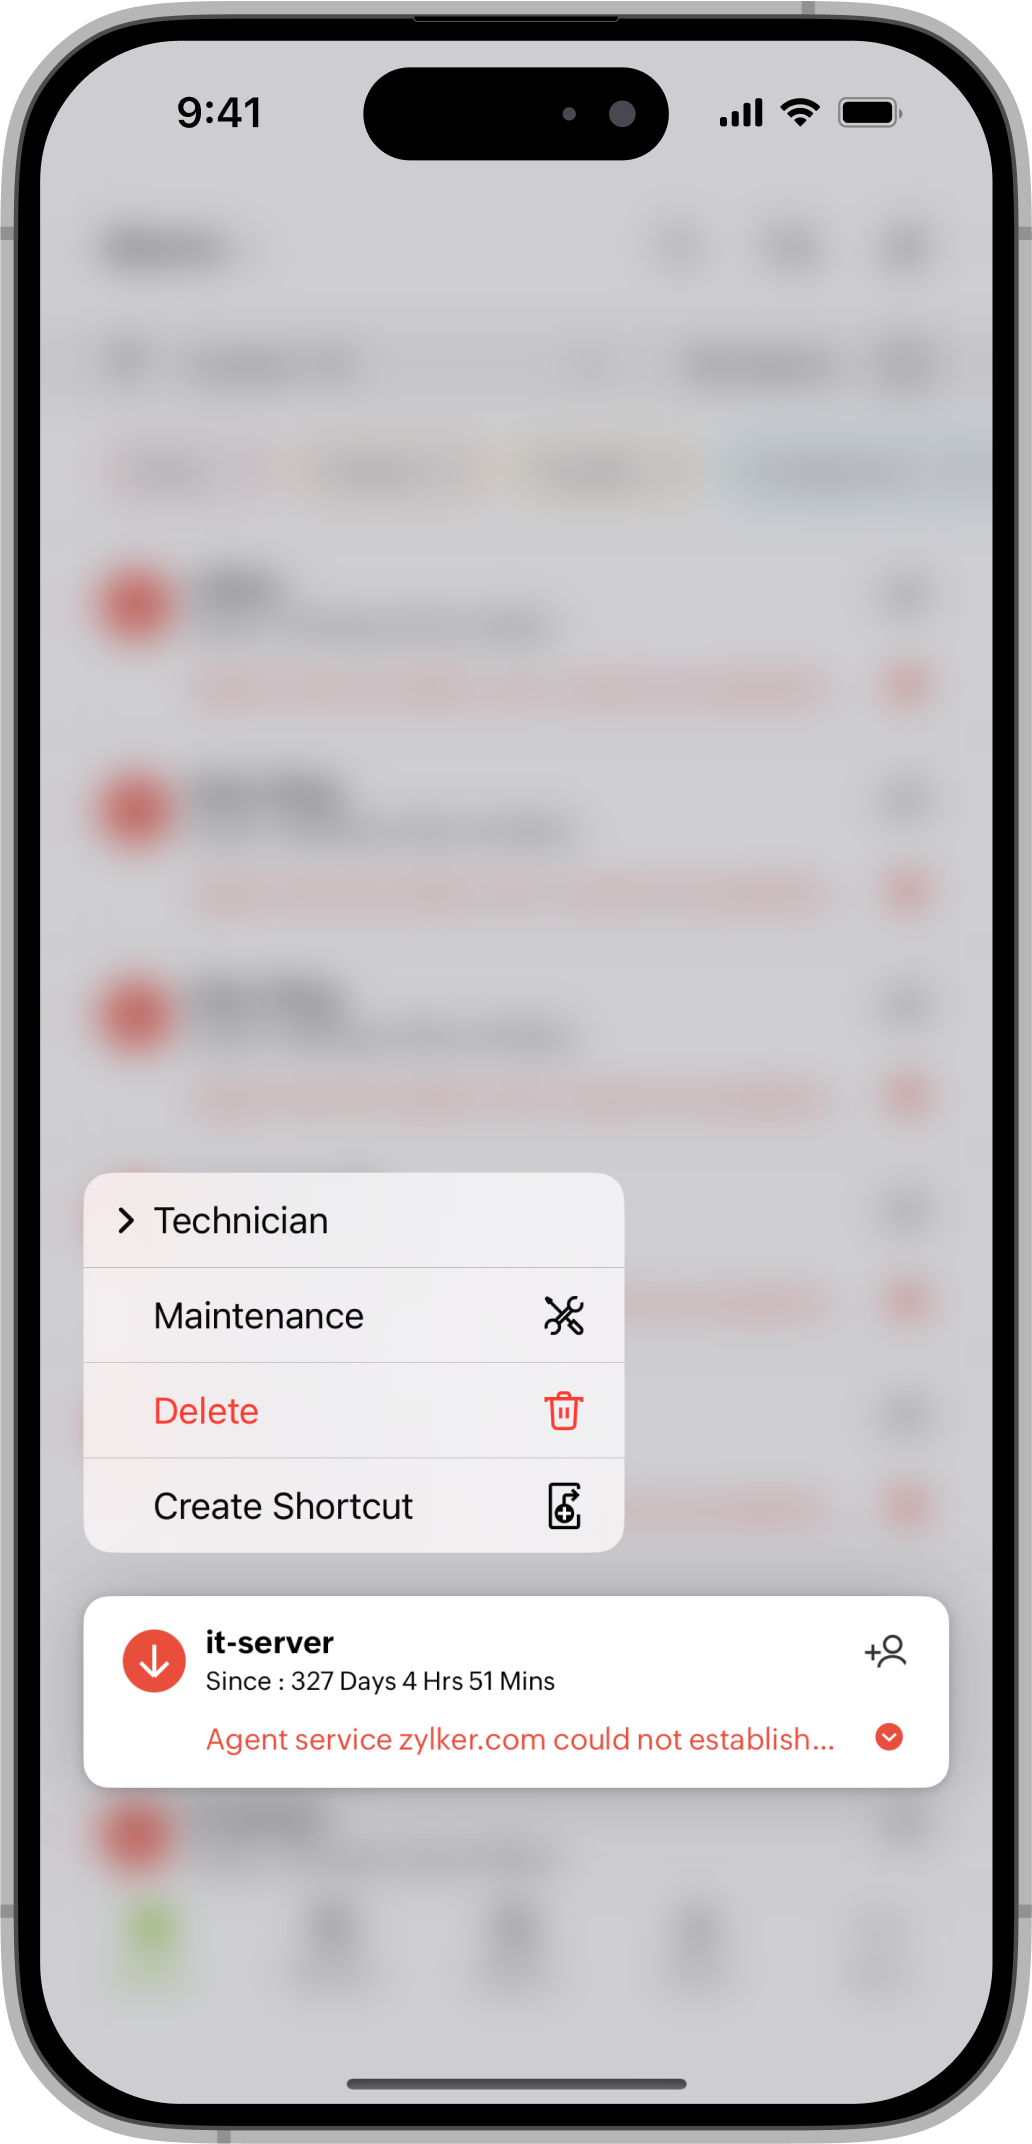
- Technician: Assign a technician to an alarm by selecting them from the list and clicking the Done button.
-
Anomalies
Filter anomalies in your monitor by time-period and severity to generate a list of relevant anomalies. -
Problems
The Problems feature groups related events into a single problem when they share an underlying cause. This helps you review related alerts together, understand their impact, and identify probable root causes. For more information, learn about Event correlation with Problems.
To open Problems, tap the Menu icon
at the top-left of the screen, then select Problems.The Problems list shows the Problem Name, Status, Environment, and Creation Time. To assign a technician to a problem, tap the Assign Technician icon
.Use the search bar at the top to find a specific problem. You can also apply filters to narrow the list.
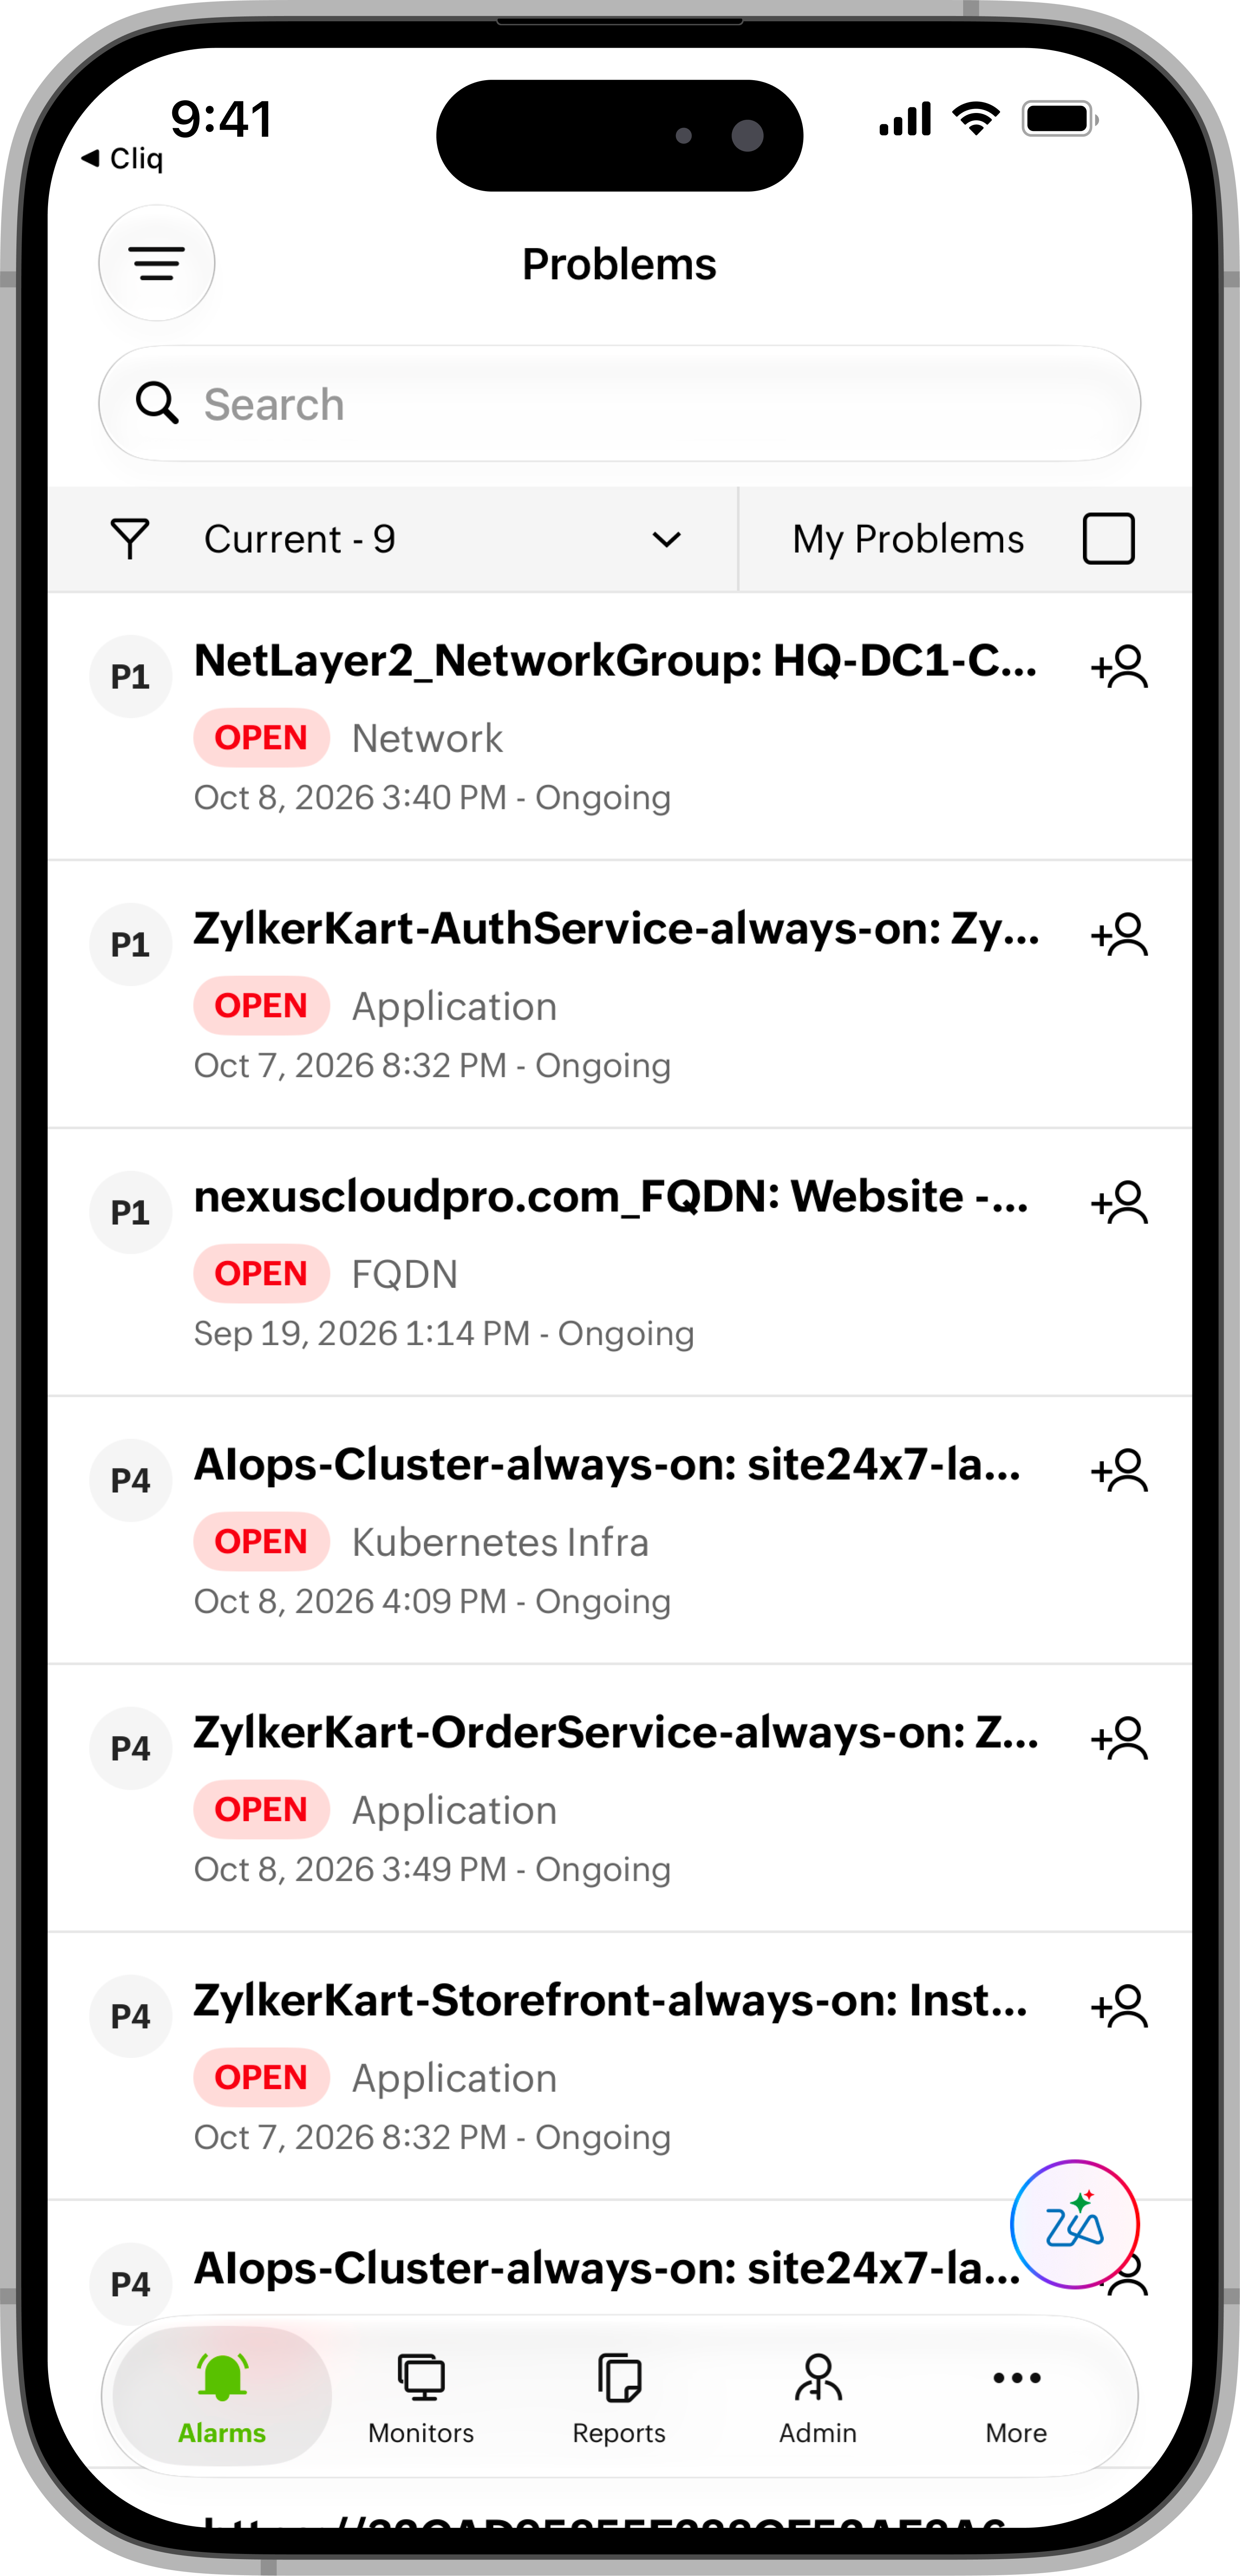
Filter
Tap the Filter icon
 at the top of the Problems list to refine the results:
- Current: View active problems. You can filter them by priority, environment, and smart group.
- Last 24 Hrs: View problems created in the last 24 hours. You can filter them by priority, status, environment, and smart group.
Tap Done to apply the filters and view the matching results.
Select My Problems to view problems assigned to you.
Problem details
Select a Problem in the list to open its details. The Problem details page includes the following tabs:
-
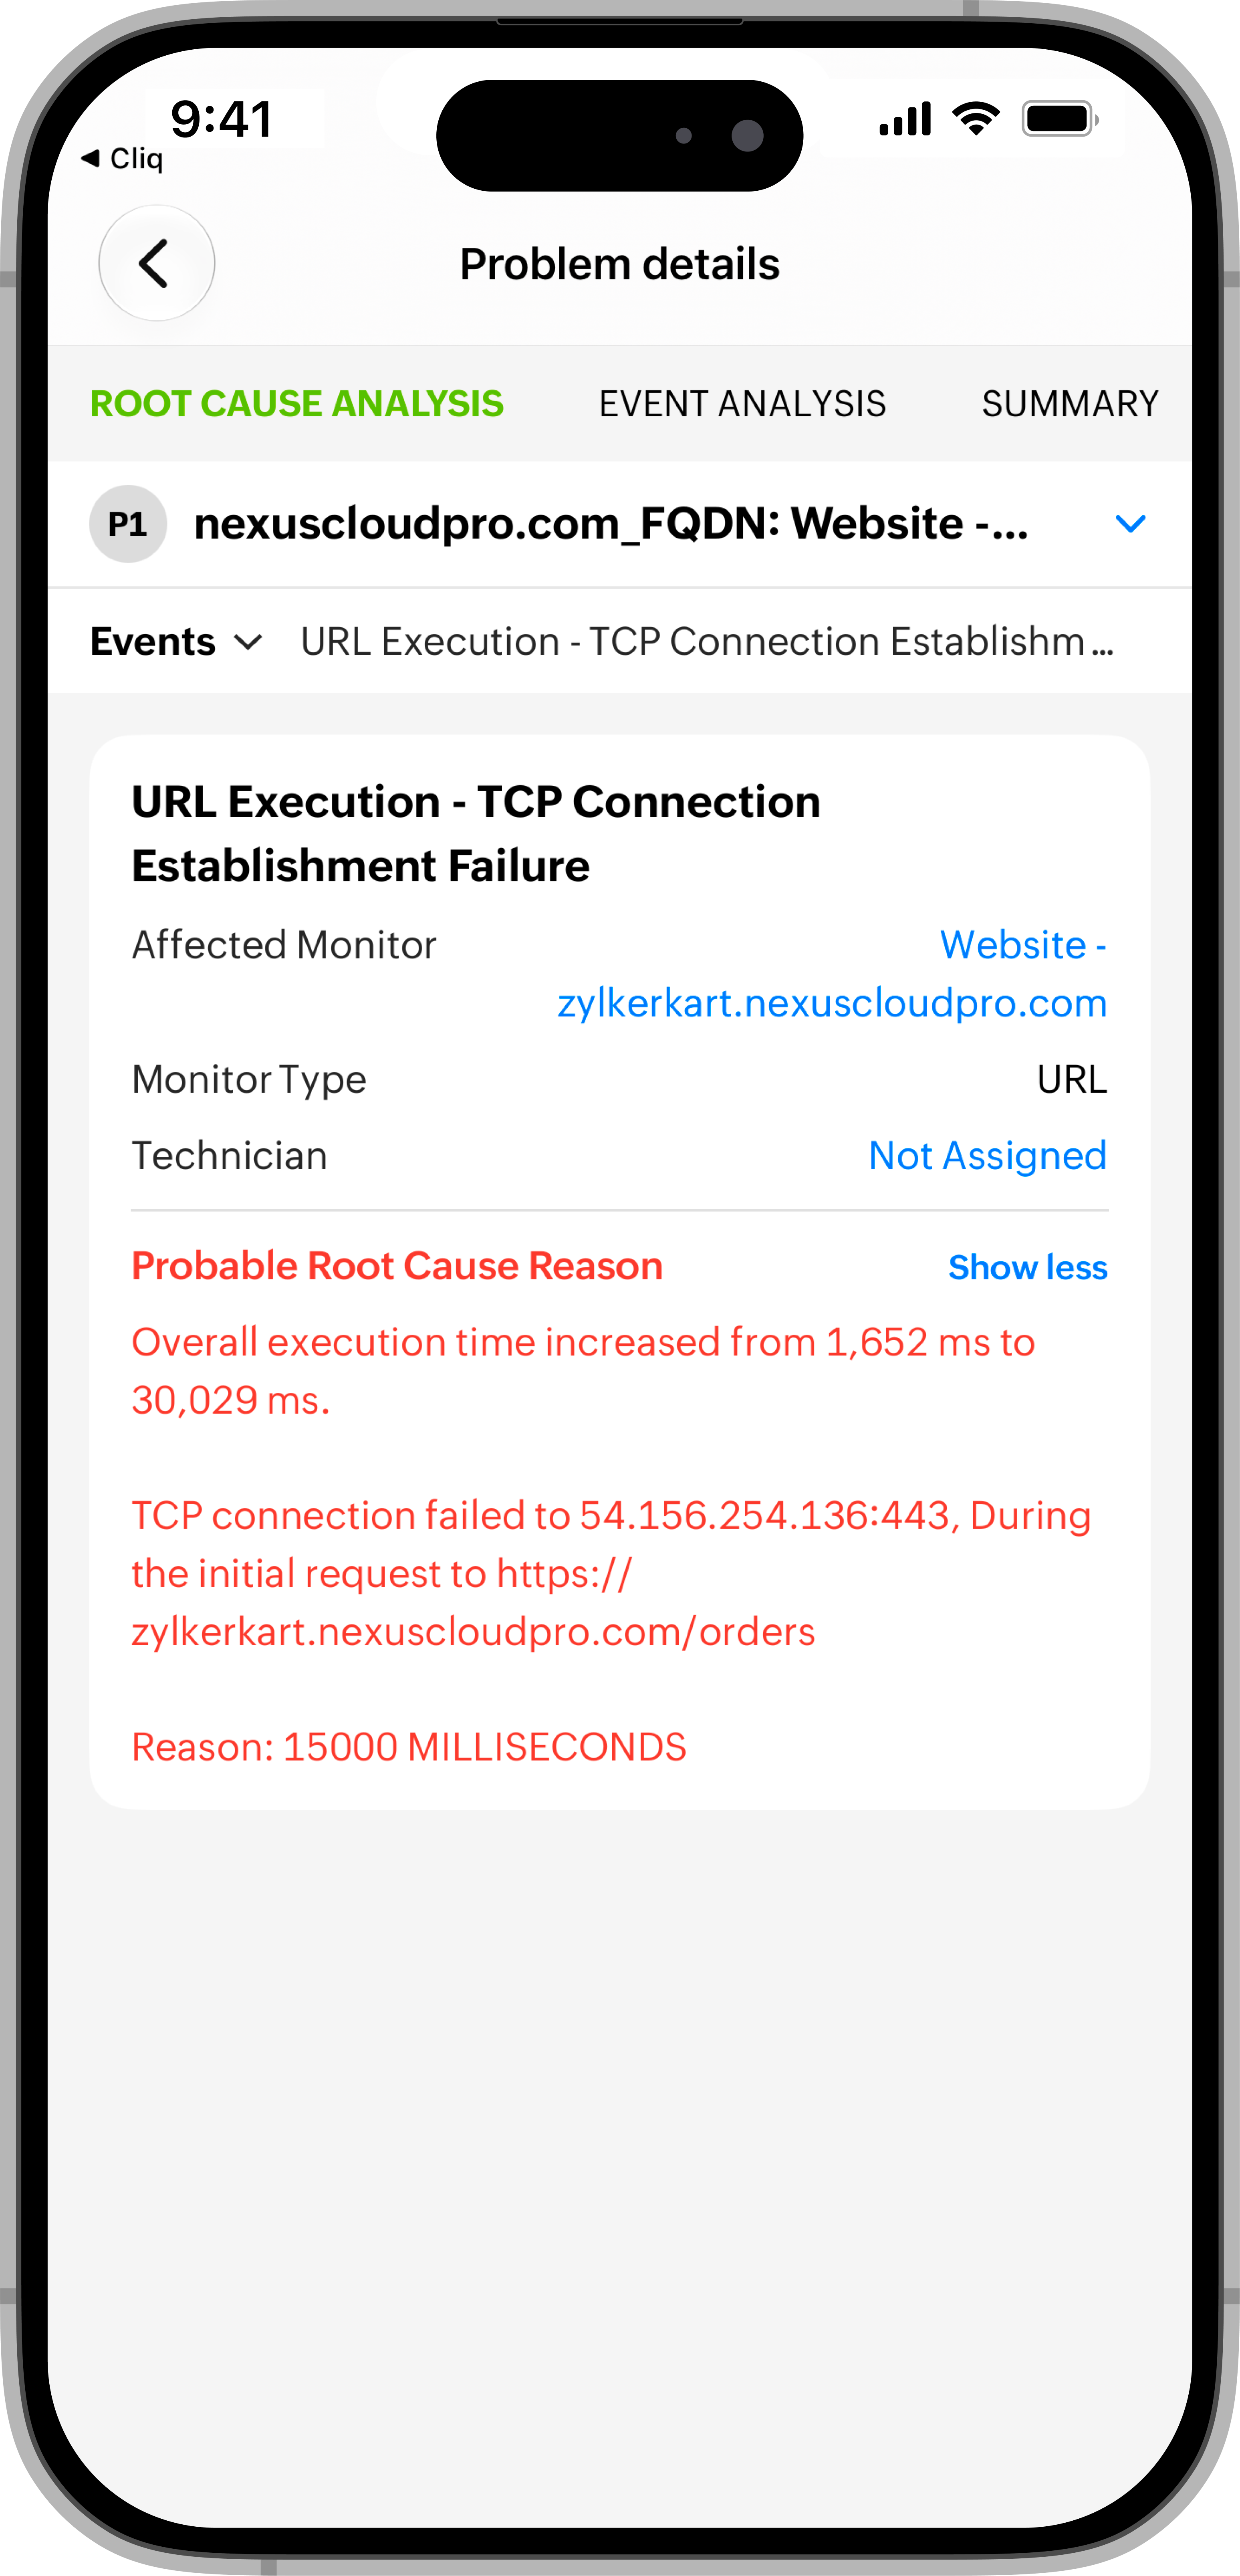
Root Cause Analysis: Review the probable root cause and details about the Affected Monitor, Monitor Type, Target Metric, Assigned Technician, and the reason identified for the issue. Use the Events selector to view the probable root cause for each event. If no technician is assigned, you can assign one from this screen.
-
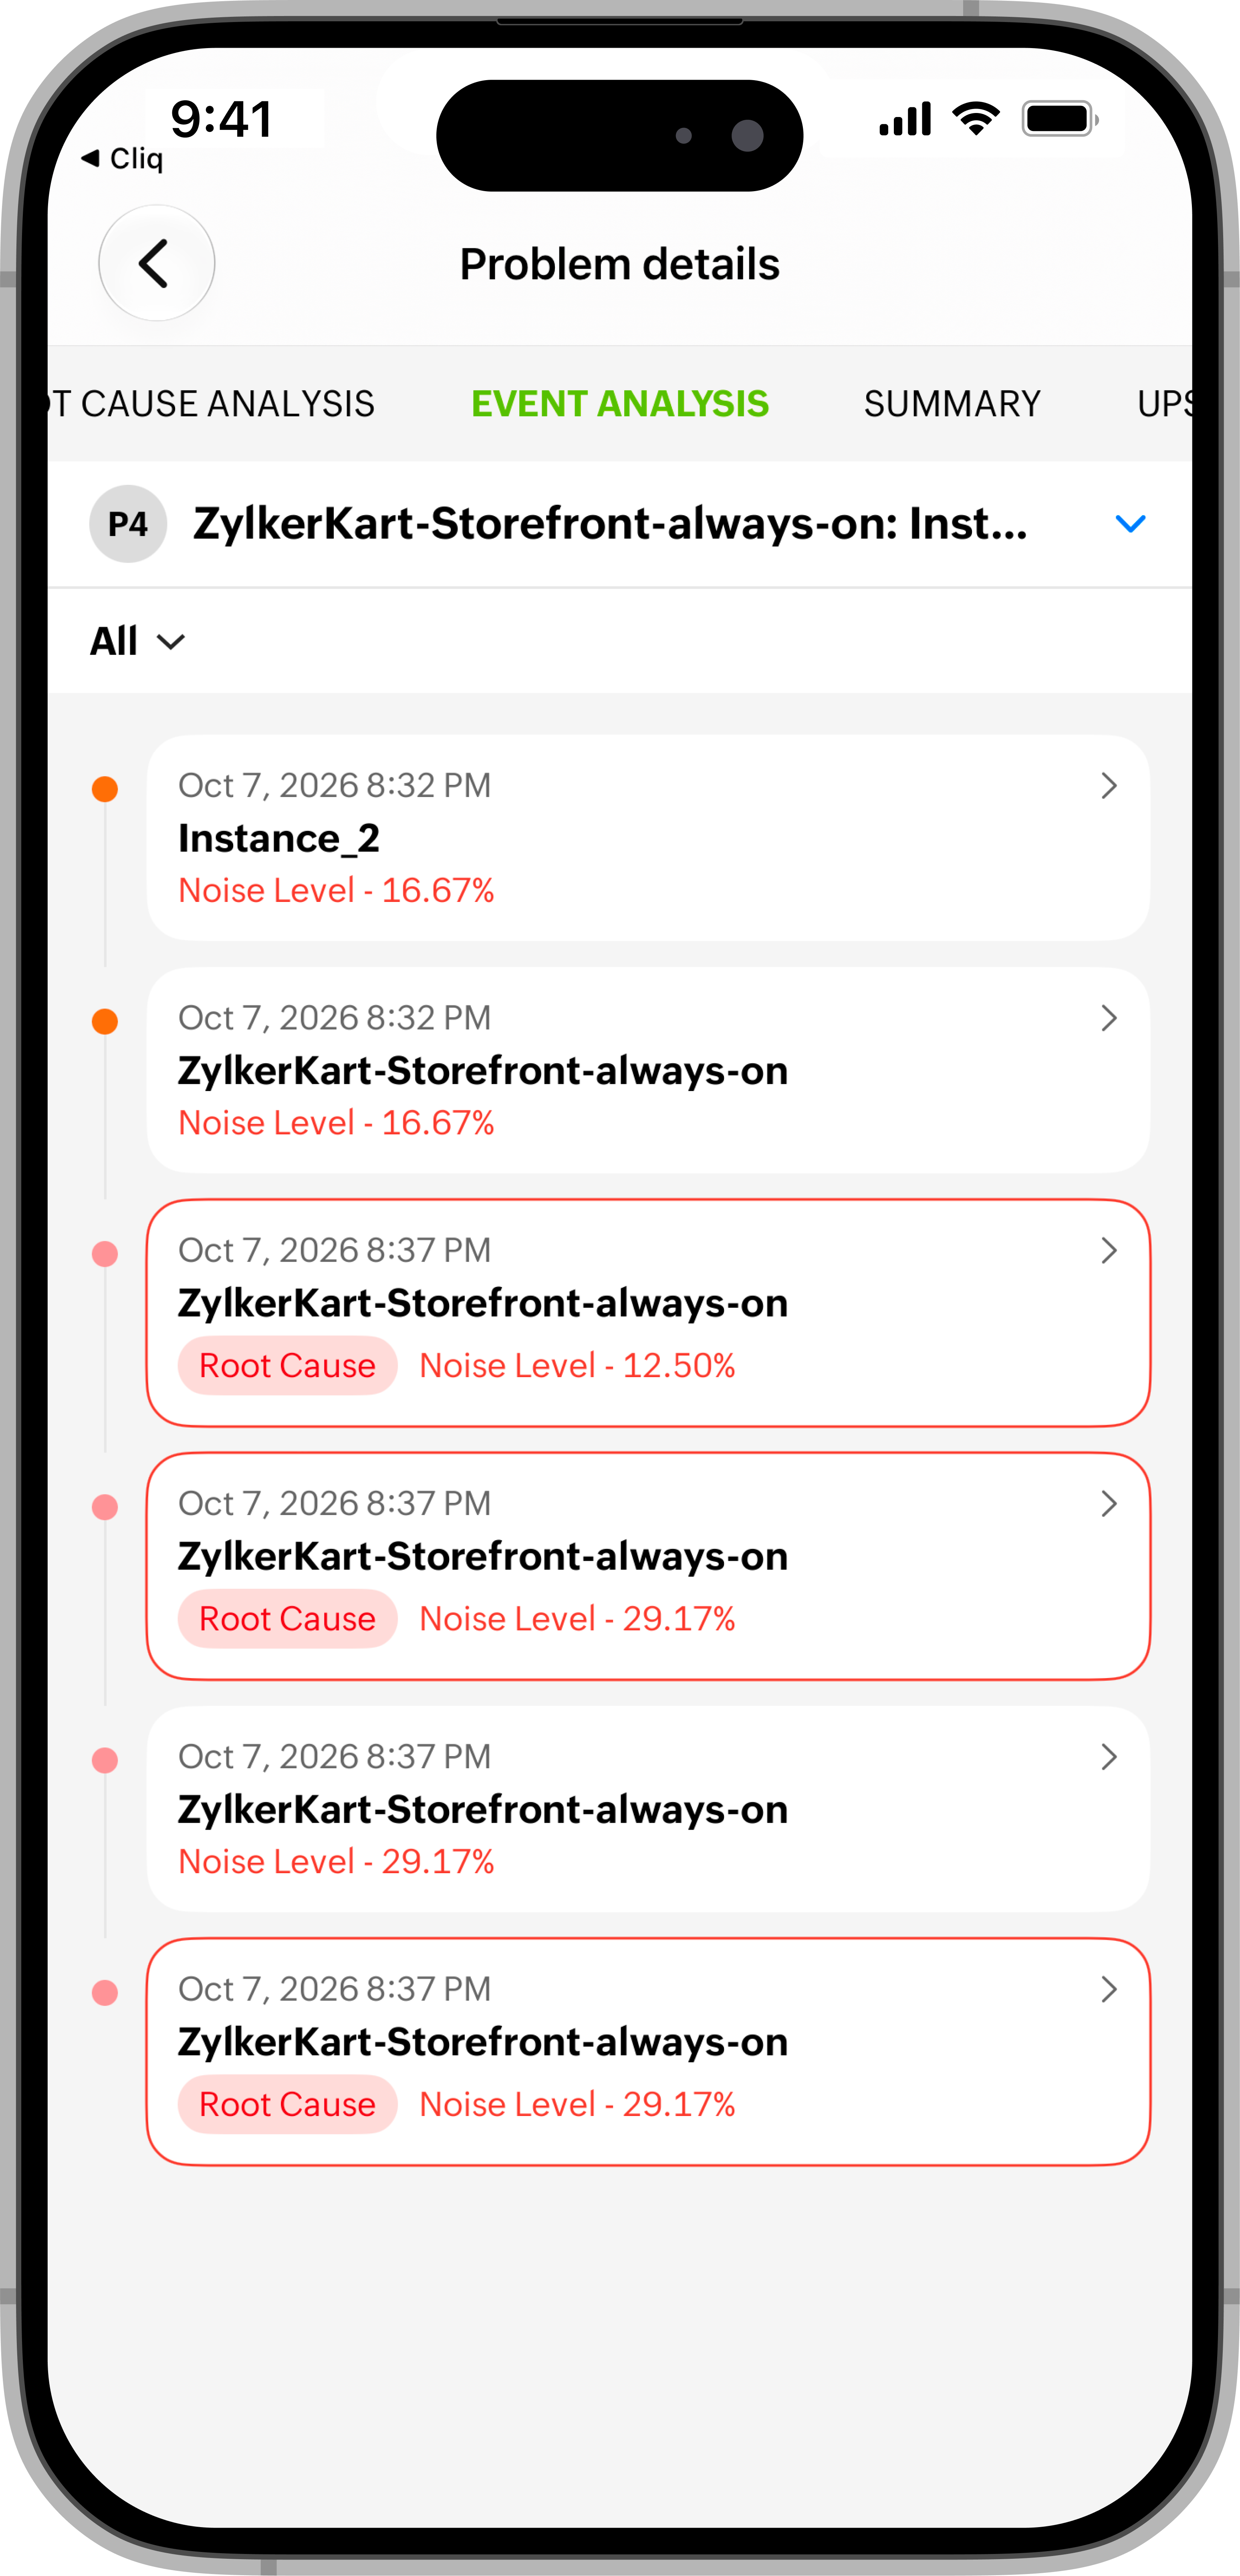
Event Analysis: View the events associated with the problem, including their time, affected monitor, event details, and noise level. The exact root cause is highlighted to help you identify the source of the issue. Events that may have contributed to the problem are marked as probable root cause events. Use the event filter to narrow the list. Tap an event to open its details.
-
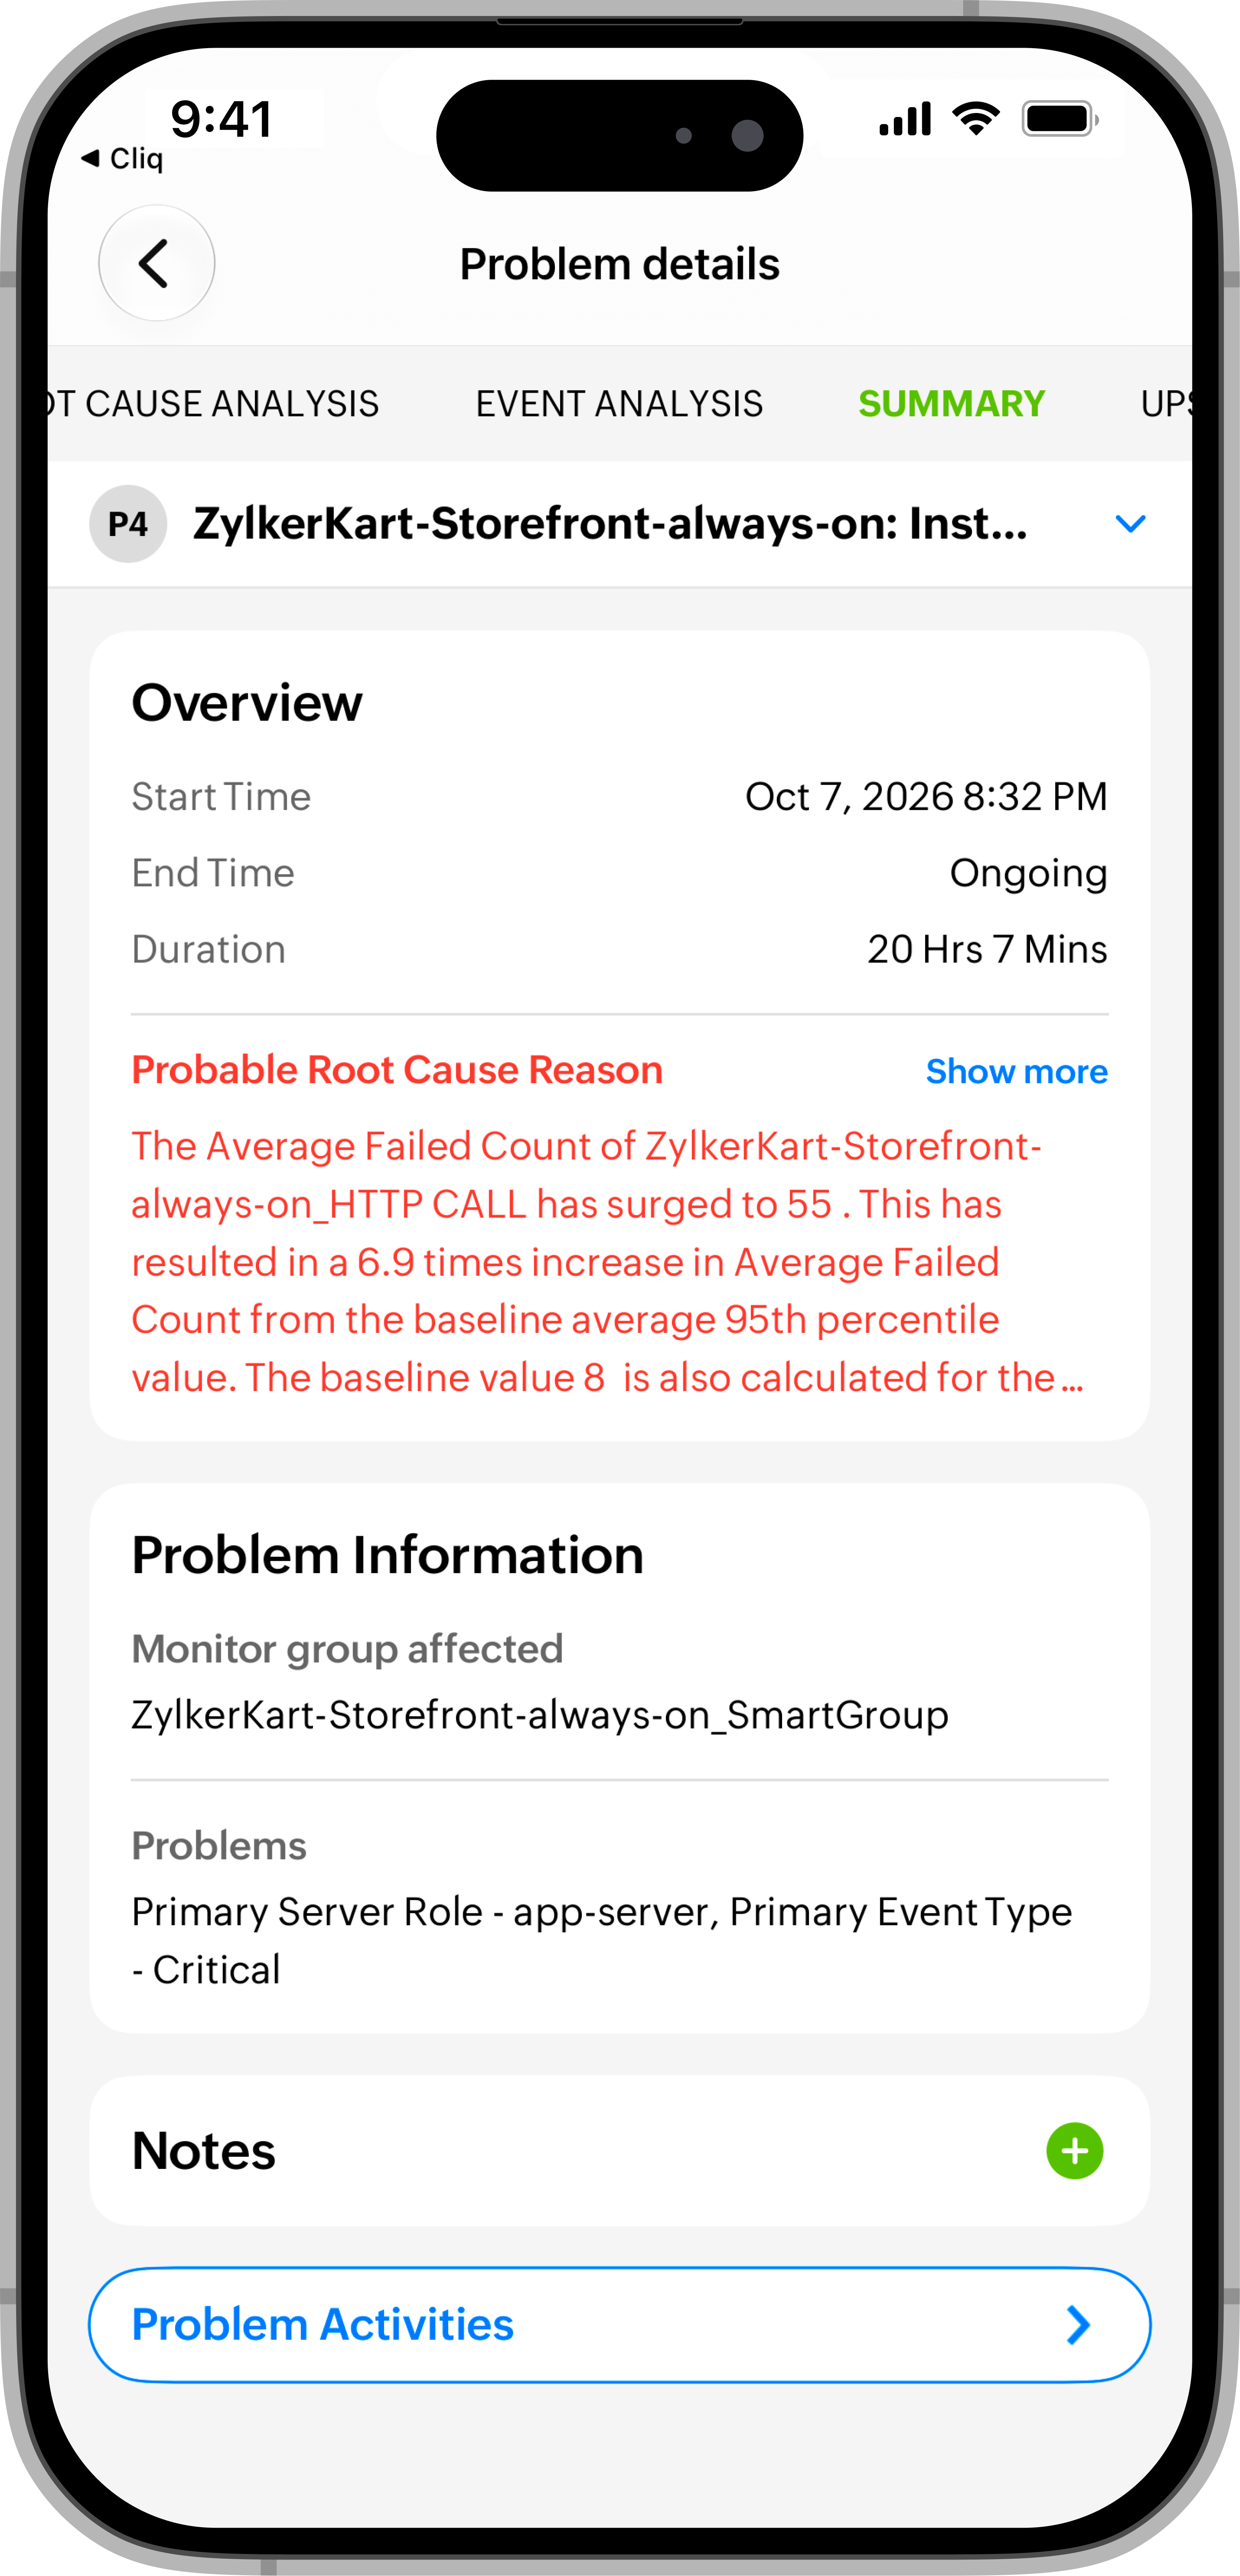
Summary: Review the problem Overview, including its start and end times, duration, and reason. The Problem Information section shows the affected monitor group and other problem details. Add notes in the Notes section, or tap the Problem Activities menu to view the problem’s activity history.
-
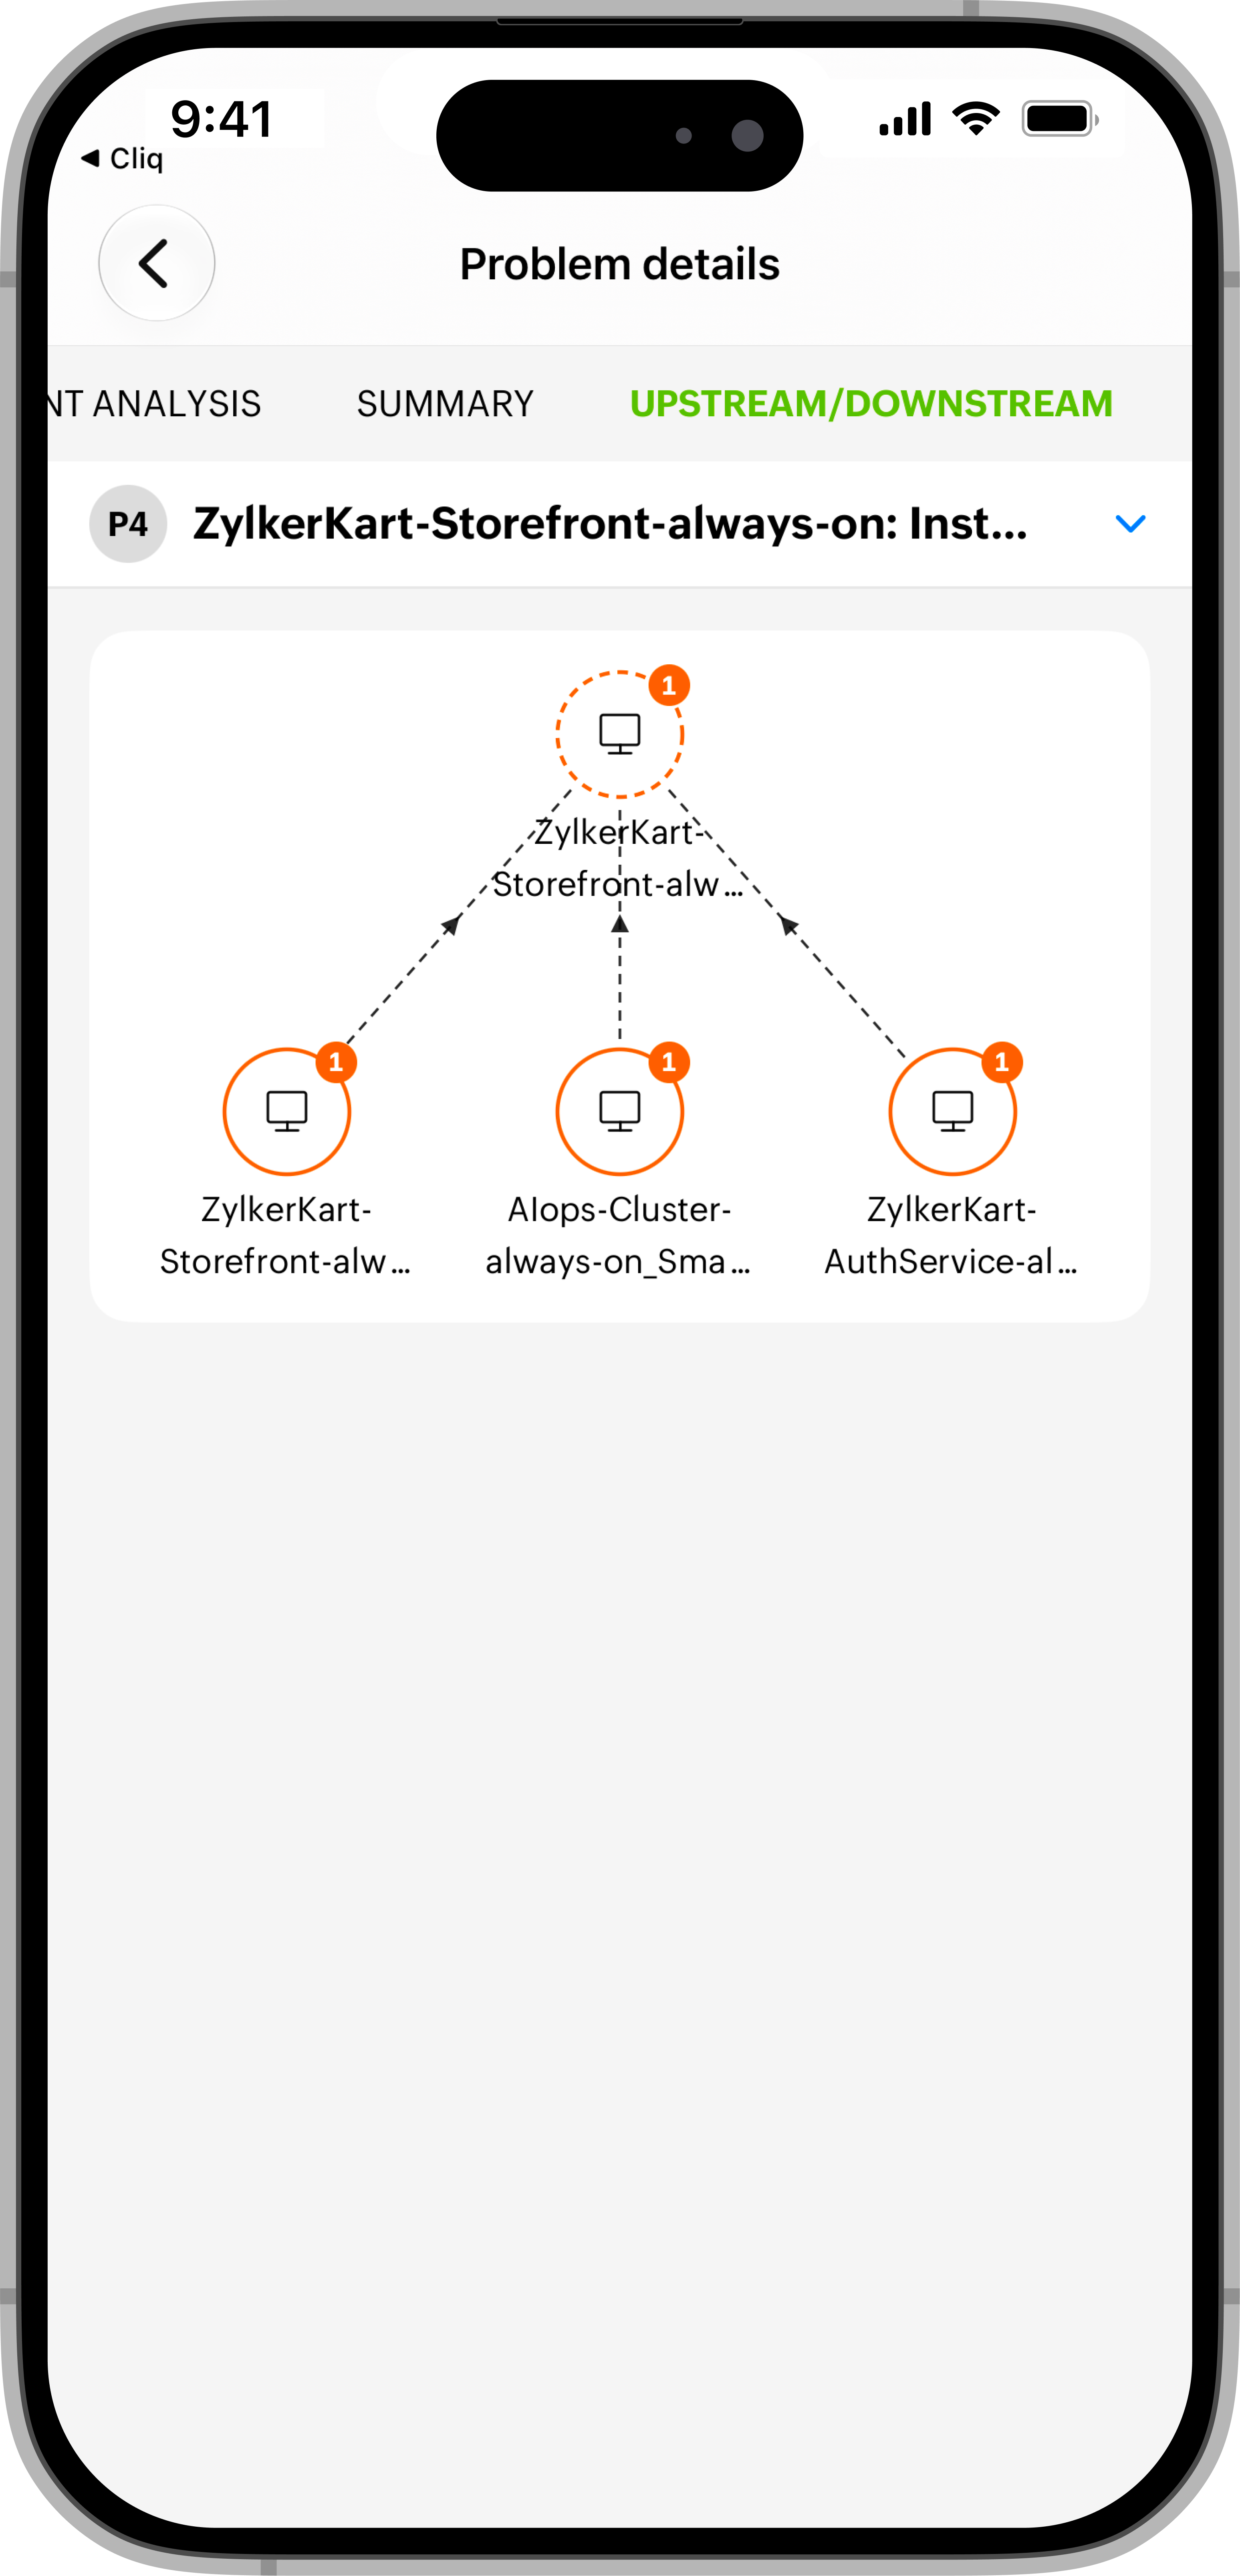
Up/Down Stream: View the upstream and downstream monitors related to the problem to understand its dependencies.
Use case
You receive an alert that an application is slow while you are away from your desk. Open Problems in the app, filter by Current and the relevant priority, then select the matching problem. Review Root Cause Analysis and Up/Down Stream to identify the likely cause and affected dependencies. Assign a technician to investigate the issue, and add a note to keep your team informed.
NoteTo make the Problems as the default view, navigate to More > Tab Customization for iOS and choose Problems.
Related articles
-
On this page
- Alarms
- Anomalies
- Problems
- Related articles