Performance Metrics and Reports
Once you've added a Cisco Meraki organization and device to your Site24x7 account, Site24x7 starts collecting availability and performance metrics from each Cisco Meraki organization and device. You can also set thresholds for all metrics to receive alerts when any of the limits are breached, ensuring complete control of your Cisco Meraki devices.
View performance metrics and reports for each Cisco Meraki organization and device for a granular analysis of availability, packet loss, and response time. The following are the various tabs available for each Cisco Meraki organization or device that help you view the performance details:
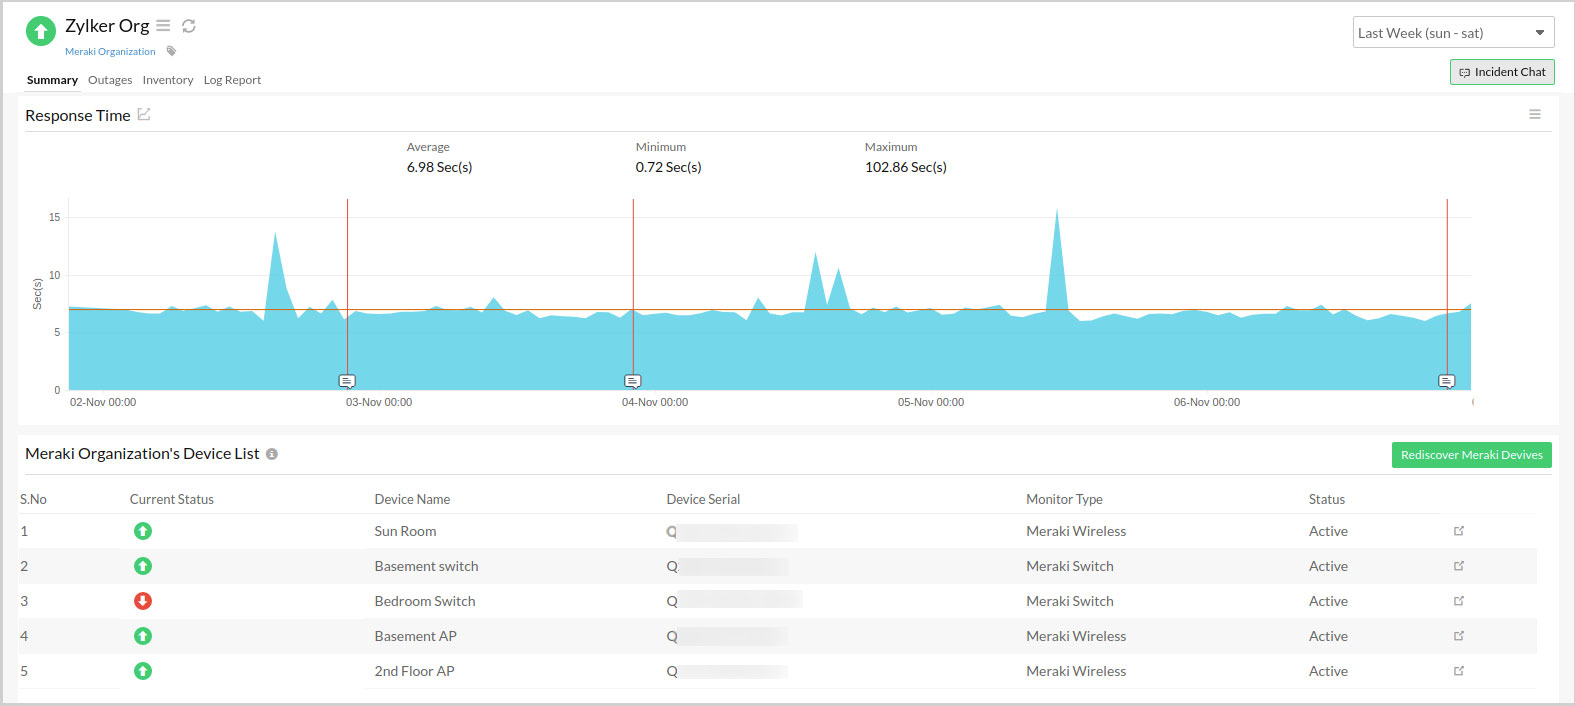
Summary
Gain an overview of various monitor statuses like Down, Critical, Trouble, Maintenance, Anomaly, and Suspended for each Meraki organization and device. This tab gives operational information like root cause analysis, device updates, the Meraki organization's device list, and the overall response time chart.
Click on Rediscover Meraki Devices in the Summary tab to discover and add newly added devices from the Cisco Meraki dashboard to Site24x7. You can also click on the box-arrow icon next to the Status of each Cisco Meraki device to view individual device details like Summary, Outages, Inventory, and Log Report.
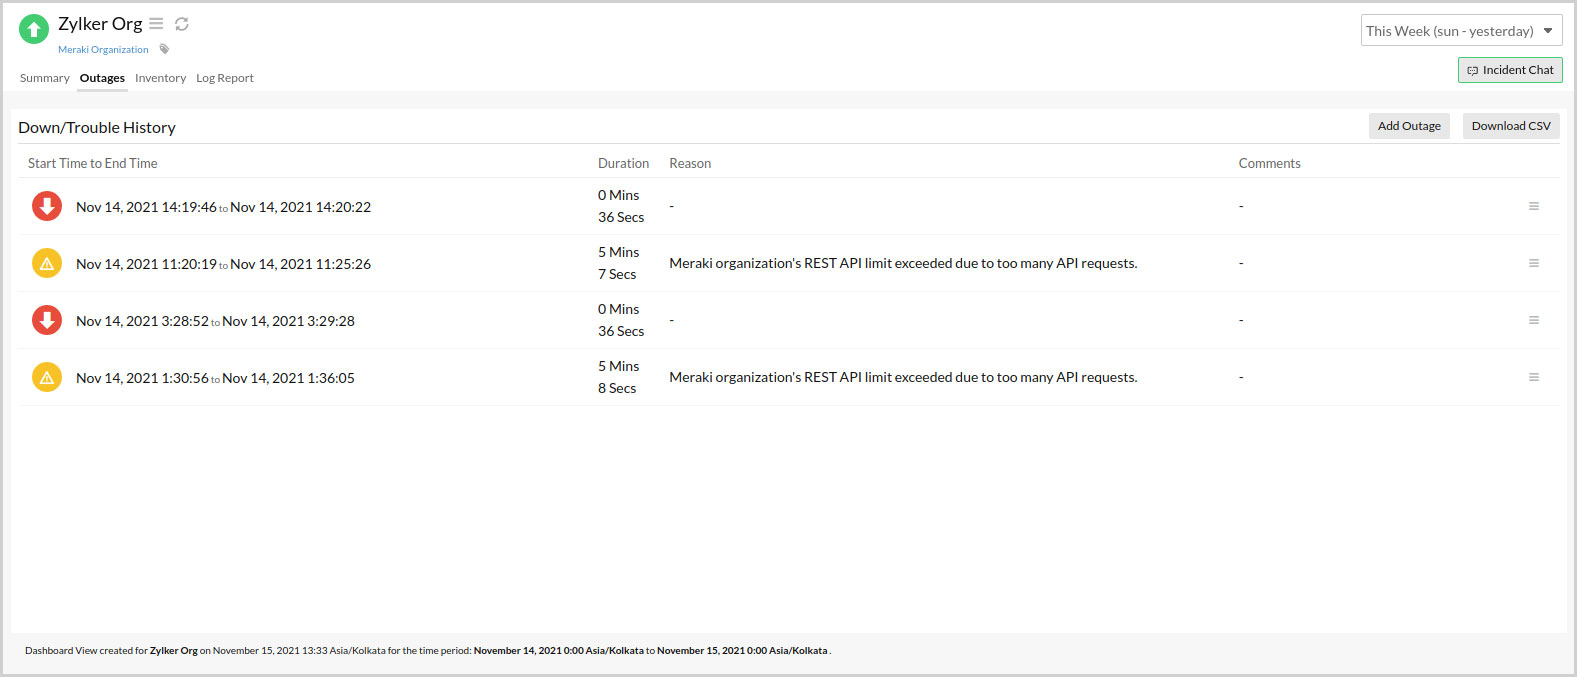
Outages
Any outage information like details on the history of Down or Trouble devices are displayed in this tab. View the start and end time, duration, and comments added in the Down/Trouble History. Hover over the hamburger icon beside each outage to mark the device as undergoing maintenance, edit comments, or delete an outage. You can also add an outage manually or download the outage report in CSV format by clicking Add Outage and Download CSV in the top-right corner respectively.
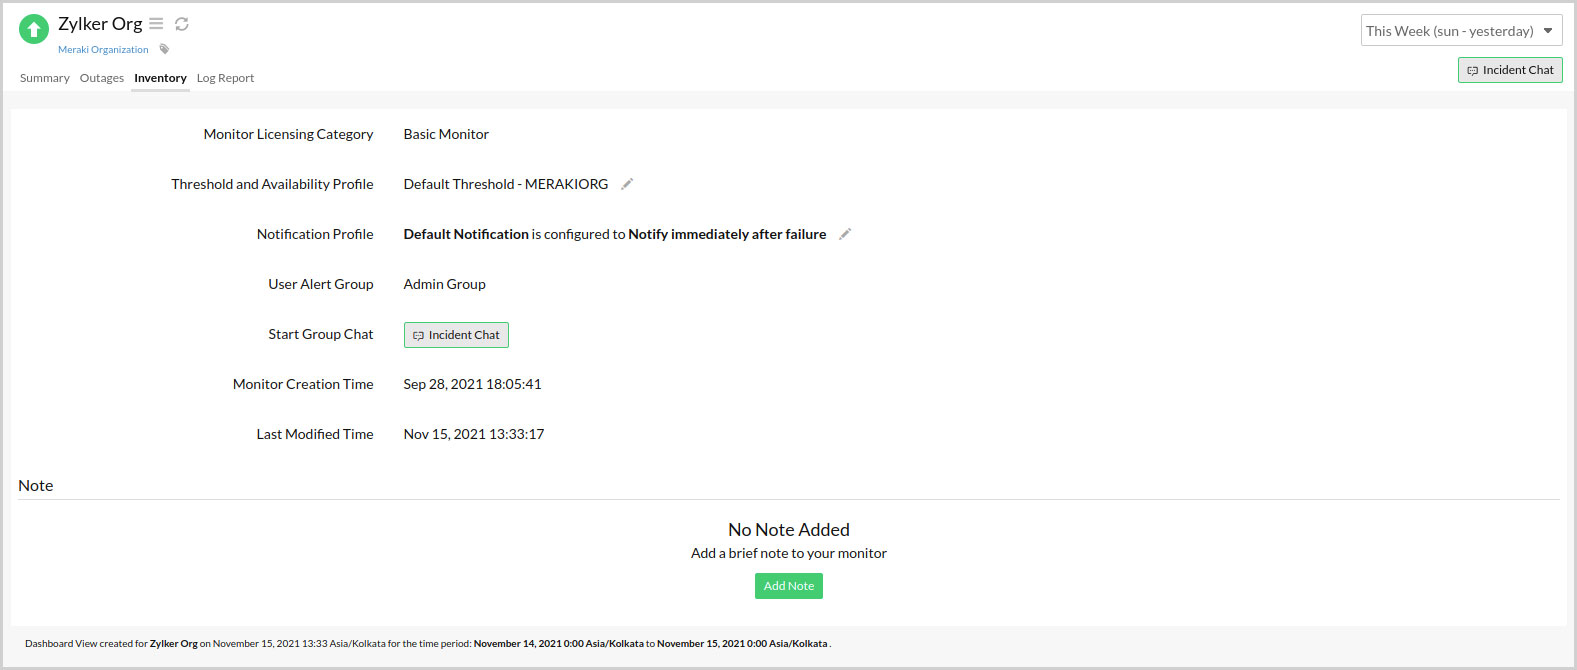
Inventory
The Inventory tab contains information like Monitor Licensing Category, Threshold and Availability Profile, Notification Profile, User Admin Group, Monitor Creation Time, Last Modified Time, and Note.
You can also configure the threshold limits for a specific Cisco Meraki organization or device from this tab.
For a Cisco Meraki organization:
- Log in to your Site24x7 account.
- Click Network > Meraki > Meraki organization > Inventory.
- Follow the steps in this doc for help seting up thresholds.
For a Cisco Meraki device:
- Log in to your Site24x7 account.
- Click Network > Meraki > Meraki organization > Inventory.
- Under the Meraki Organization's Device List section, select a Meraki device of your choice. Alternatively, you can click Home > Monitors > Meraki device > Inventory.
- Follow the steps in this doc for help setting up thresholds.
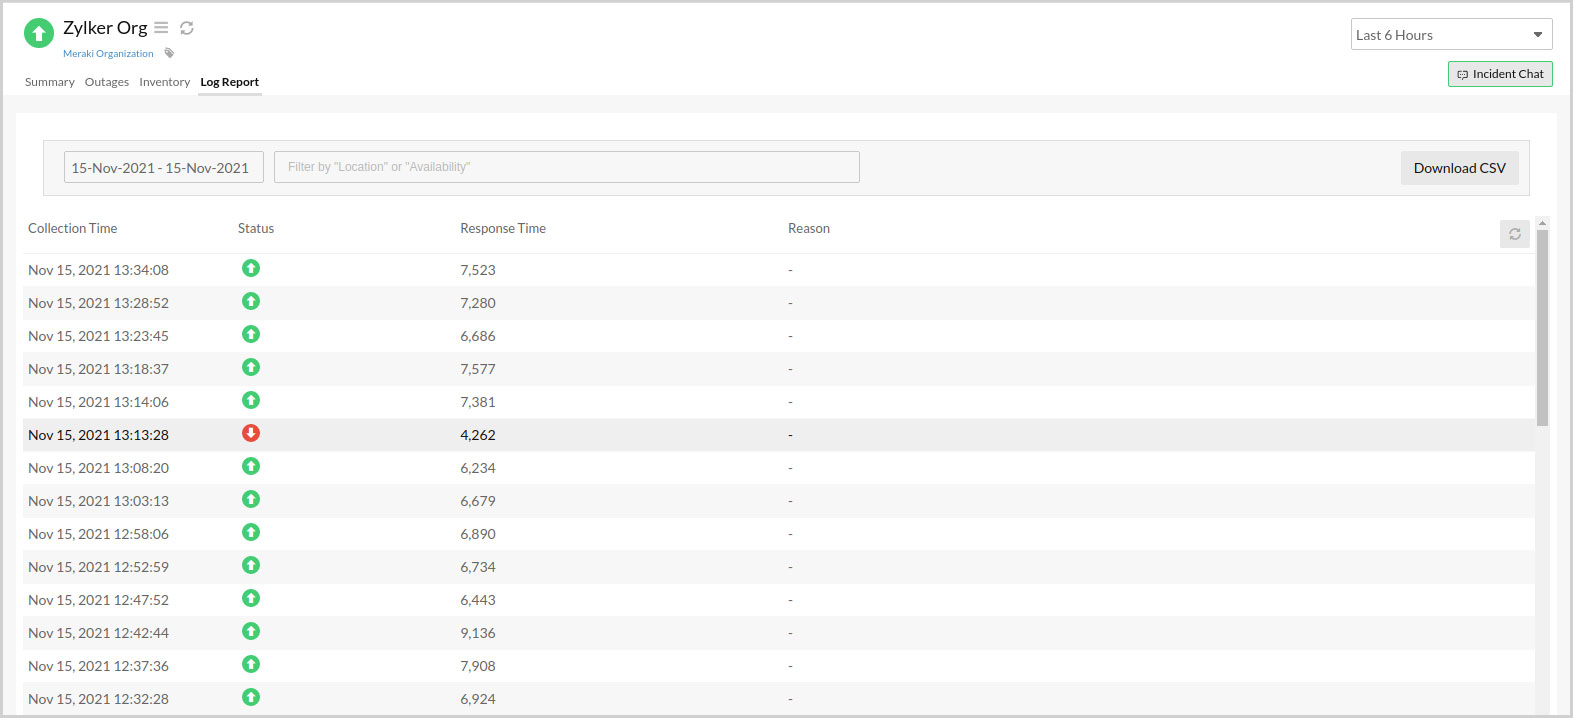
Log Report
View the audit log data of a Cisco Meraki organization or device for the selected time duration, along with details like Collection Time, Status, Response Time, and Reason. Click Download CSV in the top-right corner of this page to download the log report.
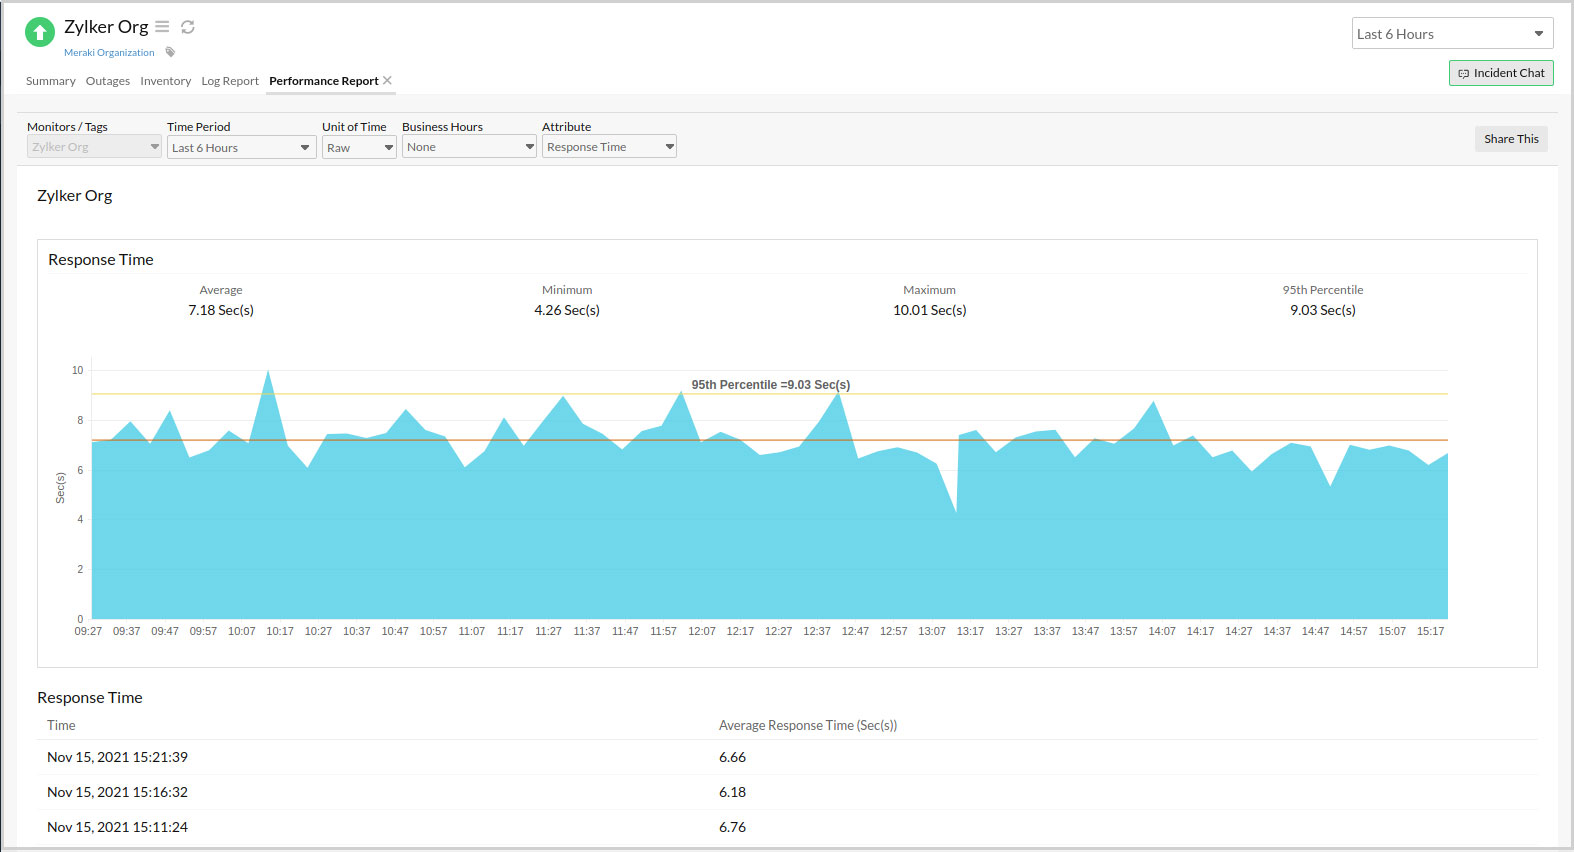
Performance Report
View a detailed analysis of response time and availability trends with this report. Customize the report with options like Time Period, Unit of Time, Business Hours, and Attribute. Use the Share This option at the top-right side of this page to download and share this report as PDF or CSV.
Follow these steps to view the performance report for a Meraki organization monitor:
- Log in to your Site24x7 account.
- Click Network > Meraki > Meraki organization.
- Click the Summary tab.
- Click the box-arrow icon beside Response Time.
Follow these steps to view the performance report for a Cisco Meraki device monitor:
- Log in to your Site24x7 account.
- Click Network > Meraki > Meraki device.
- Click the Summary tab.
- Click the box-arrow icon beside Availability Trend.
Troubleshooting Tips
- How do I generate the Meraki REST API key?
- Unable to suspend or delete my Cisco Meraki organization monitor.
- Why is the monitor status shown as Down in the Cisco Meraki dashboard while shown as Up in Site24x7 ?
- What happens if the Cisco Meraki organization's REST API key exceeds the limit?
- Why aren't my Cisco Meraki devices being discovered?
- What are the Cisco Meraki APIs used for monitoring in Site24x7?
-
On this page
- Summary
- Outages
- Inventory
- Log Report
- Performance Report
- Troubleshooting Tips