PHP FPM Slow Logs
PHP-FPM is a web tool used to speed up the performance of a website. The PHP-FPM slow log can be configured on a pool basis or for a specific website if needed. This log represents the slow PHP processes in your application. Site24x7 AppLogs natively supports PHP-FPM slow logs.
Getting started
1. Log in to your Site24x7 account.
2. Download and install the Site24x7 Server Monitoring agent (Windows | Linux).
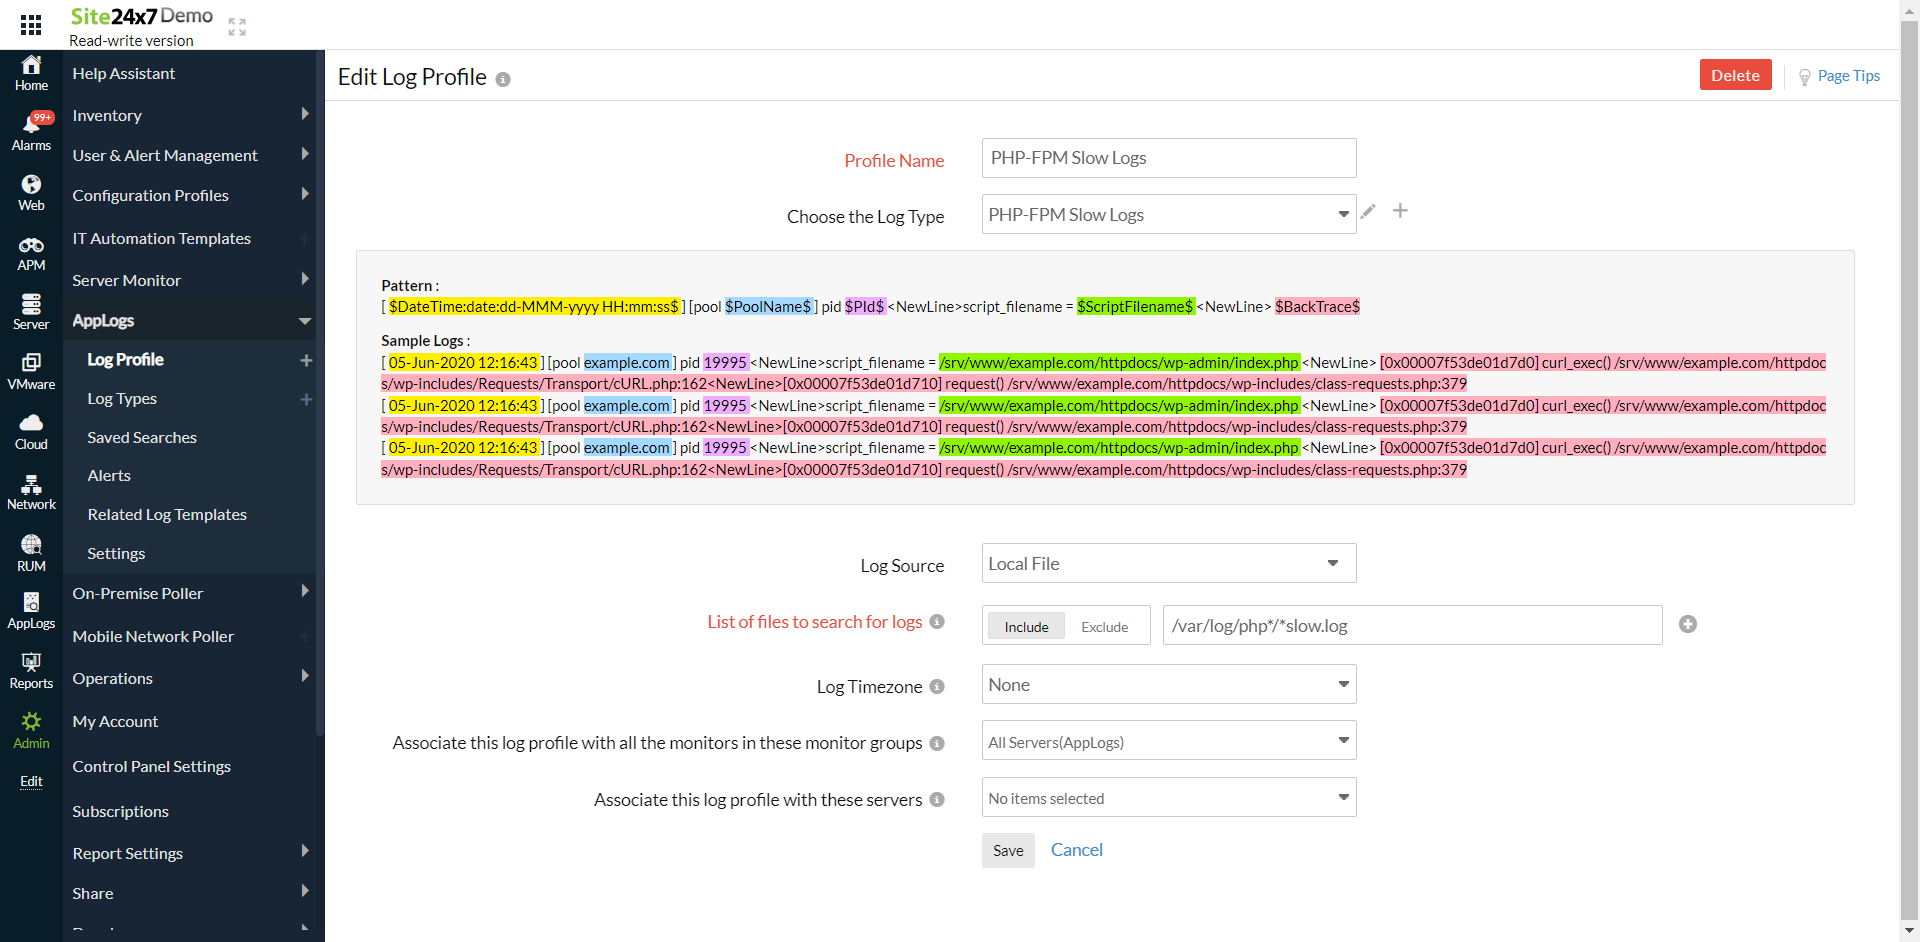
3. Go to Admin > AppLogs > Log Profile and select Add Log Profile.
4. Enter the Profile Name.
5. Select PHP-FPM Slow Logs from the Choose the Log Type dropdown.
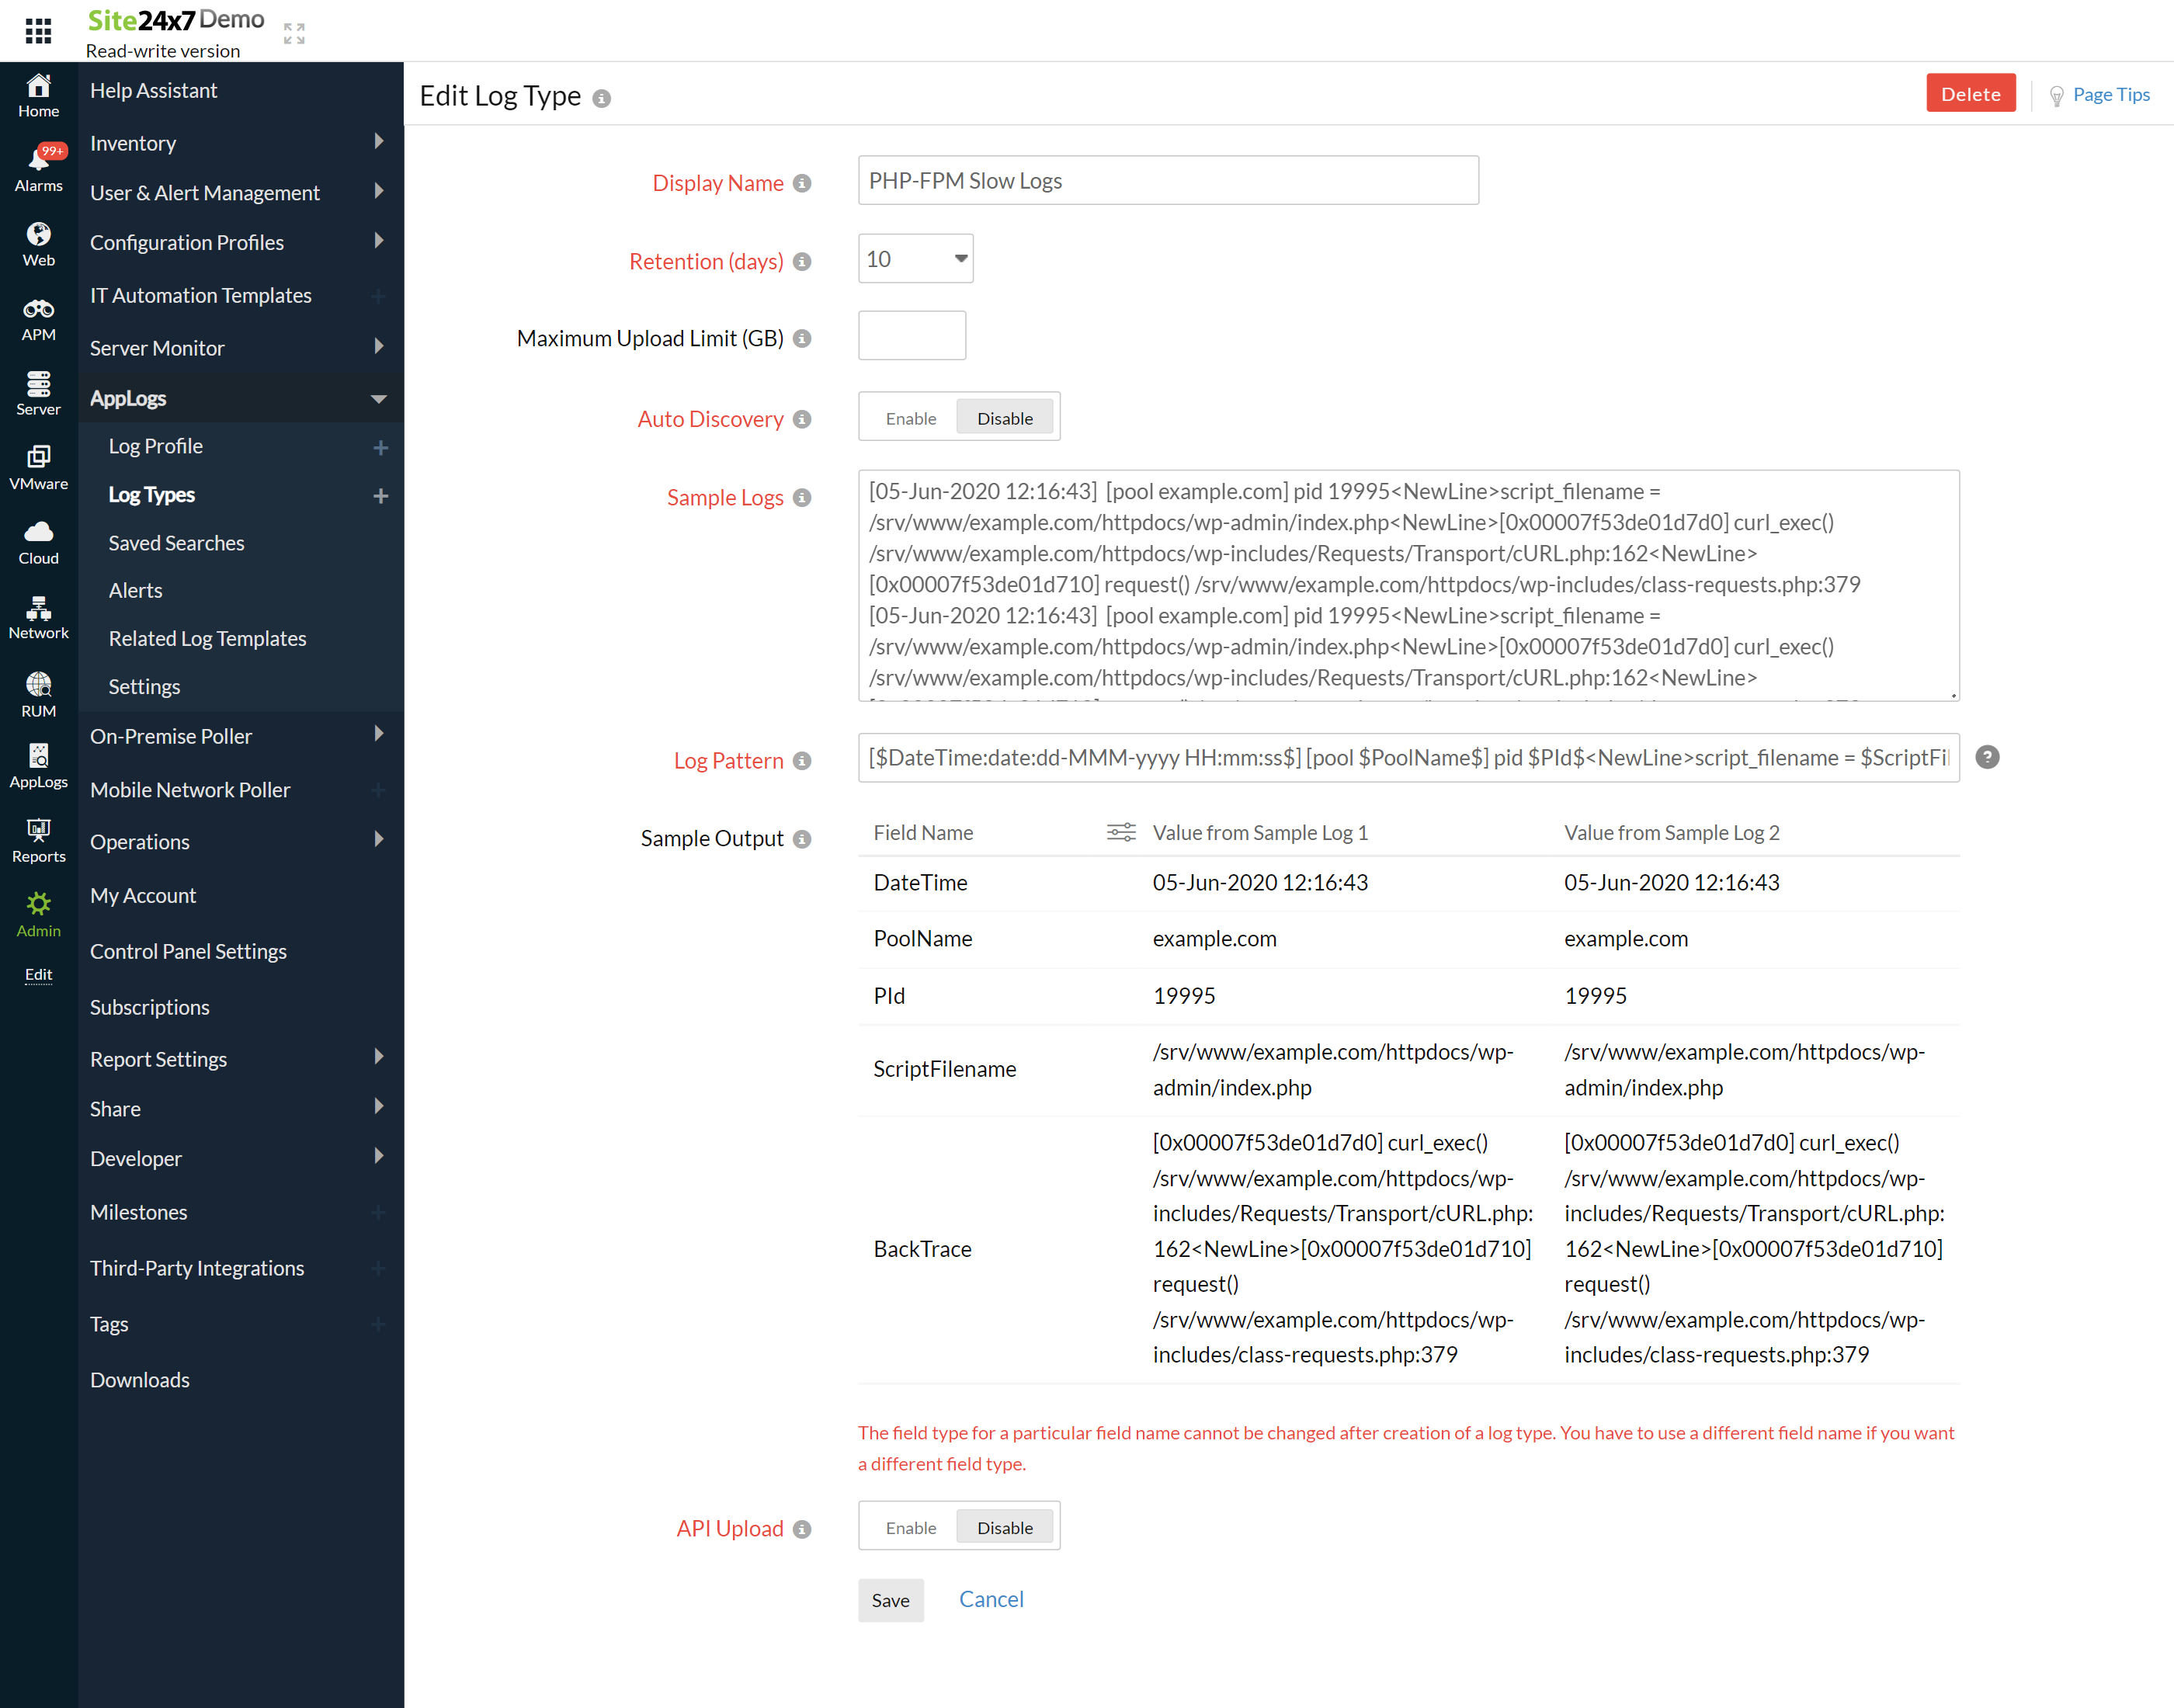
- The Log Pattern and Sample Logs are displayed below.
Sample logs:
[05-Jun-2020 12:16:43] [pool example.com] pid 19995
script_filename = /srv/www/example.com/httpdocs/wp-admin/index.php
[0x00007f53de01d7d0] curl_exec() /srv/www/example.com/httpdocs/wp-includes/Requests/Transport/cURL.php:162
[0x00007f53de01d710] request() /srv/www/example.com/httpdocs/wp-includes/class-requests.php:379
[0x00007f53de01d610] request() /srv/www/example.com/httpdocs/wp-includes/class-http.php:394
[0x00007f53de01d480] request() /srv/www/example.com/httpdocs/wp-includes/class-http.php:611
[0x00007f53de01d3e0] post() /srv/www/example.com/httpdocs/wp-includes/http.php:181
[0x00007f53de01d350] wp_remote_post() /srv/www/example.com/httpdocs/wp-admin/includes/dashboard.php:1687
[0x00007f53de01d270] wp_check_browser_version() /srv/www/example.com/httpdocs/wp-admin/includes/dashboard.php:27
[0x00007f53de01d120] wp_dashboard_setup() /srv/www/example.com/httpdocs/wp-admin/index.php:15
This log is separated into fields, each of which is uploaded to Site24x7. - By default, this is the log pattern identified by Site24x7 AppLogs for PHP-FPM slow logs:
[$DateTime:date:dd-MMM-yyyy HH:mm:ss$] [pool $PoolName$] pid $PId$<NewLine>script_filename = $ScriptFilename$<NewLine>$BackTrace$ - You can also add a custom log pattern instead of using the default one. To do so, click the pencil icon and specify your pattern.

6. Select the Log Source. By default, the paths below are used as a file source:
Linux: "/var/log/php*/*slow.log"
- If your source path is different from the default path, specify it while adding the log profile.
7. Select either monitors or monitor groups to collect the logs.

8. Click Save.
Dashboard
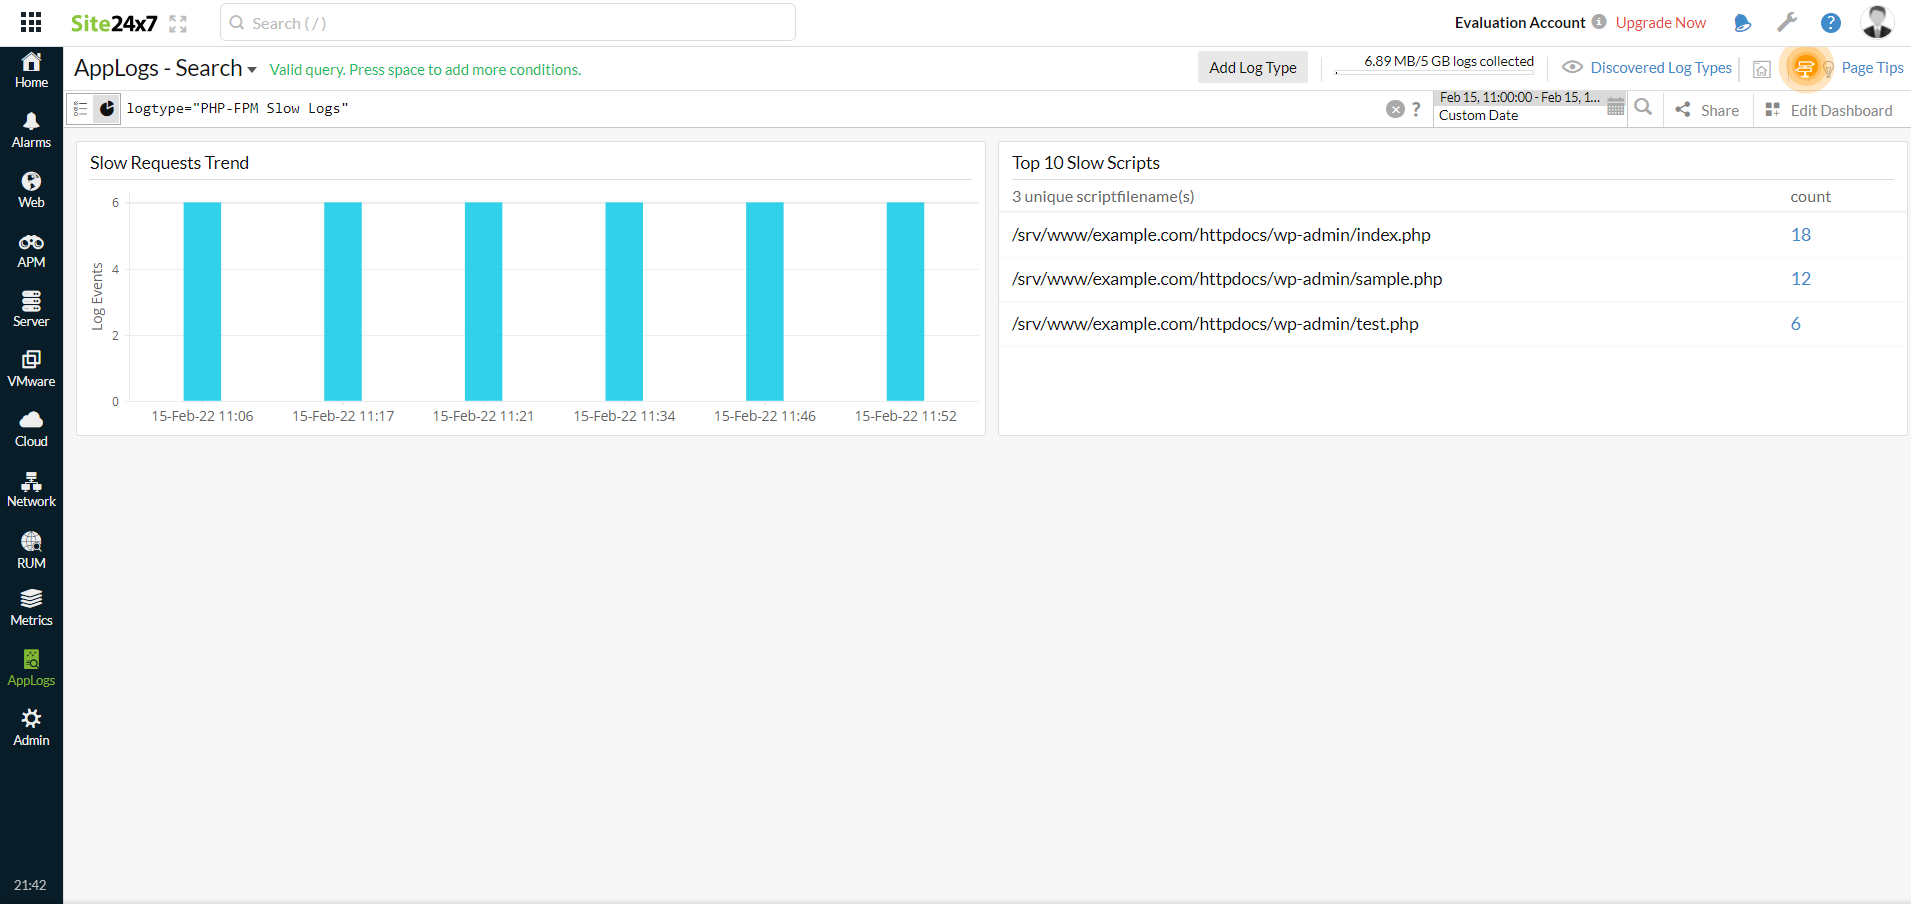
AppLogs creates an exclusive dashboard for every log type, and shows a few widgets by default. Here's a list of the widgets available in the PHP-FPM slow logs dashboard:
- Slow Requests Trend
- Top 10 Slow Scripts

Related log types
-
On this page
- Getting started
- Dashboard
- Related log types
