Node.js logs
Node.js is an open-source, cross-platform JavaScript runtime environment. It is essential to use logging to understand the entire Node.js application life cycle.
You can use a logging framework such as winston, Bunyan, or Morgan to log from your Node.js application and send the logs to Site24x7 AppLogs for monitoring.
Using winston
The most popular logging framework for Node.js, winston supports multiple transports, such as console, file, and API. Use file transport to send your logs to Site24x7.
Below are the steps to use winston to log the information to a file:
- Ensure that the recent versions of Node.js and Node Package Manager (NPM) are installed on your machine. You can install winston using the command below:
$ npm install winston
- Add the code below to declare the default logger available in the winston module:
const { createLogger, format, transports } = require('winston');
const logger = createLogger({
level: 'info',
exitOnError: false,
format: format.json(),
transports: [
new transports.File({ filename: `<application_dir>/logs/<FILE_NAME>.log` }),
],
});
module.exports = logger;
logger.log('info', 'Hello World!');NoteMake sure to provide the file name in the code snippet above.
- To verify logging, check whether the sample log below was created in your log file:
{"level":"info","message":"Hello World!","timestamp":"2022-05-15T14:52:05.337Z"}
Getting started with log management
- Log in to your Site24x7 account.
- Download and install the Site24x7 server monitoring agent (Windows | Linux).
- Go to Admin > AppLogs > Log Profile > Add Log Profile.
- Profile Name: Enter a name for your log profile.
- Choose the Log Type: Select Node JS from the drop-down menu.
- Log Source: Select Local File from the drop-down menu.
- List of files to search for logs: Add the file path where winston transports the file to.
E.g.: <application_dir>/logs/<FILE_NAME>.log
- Select the server and click Save.
Log patterns and sample logs
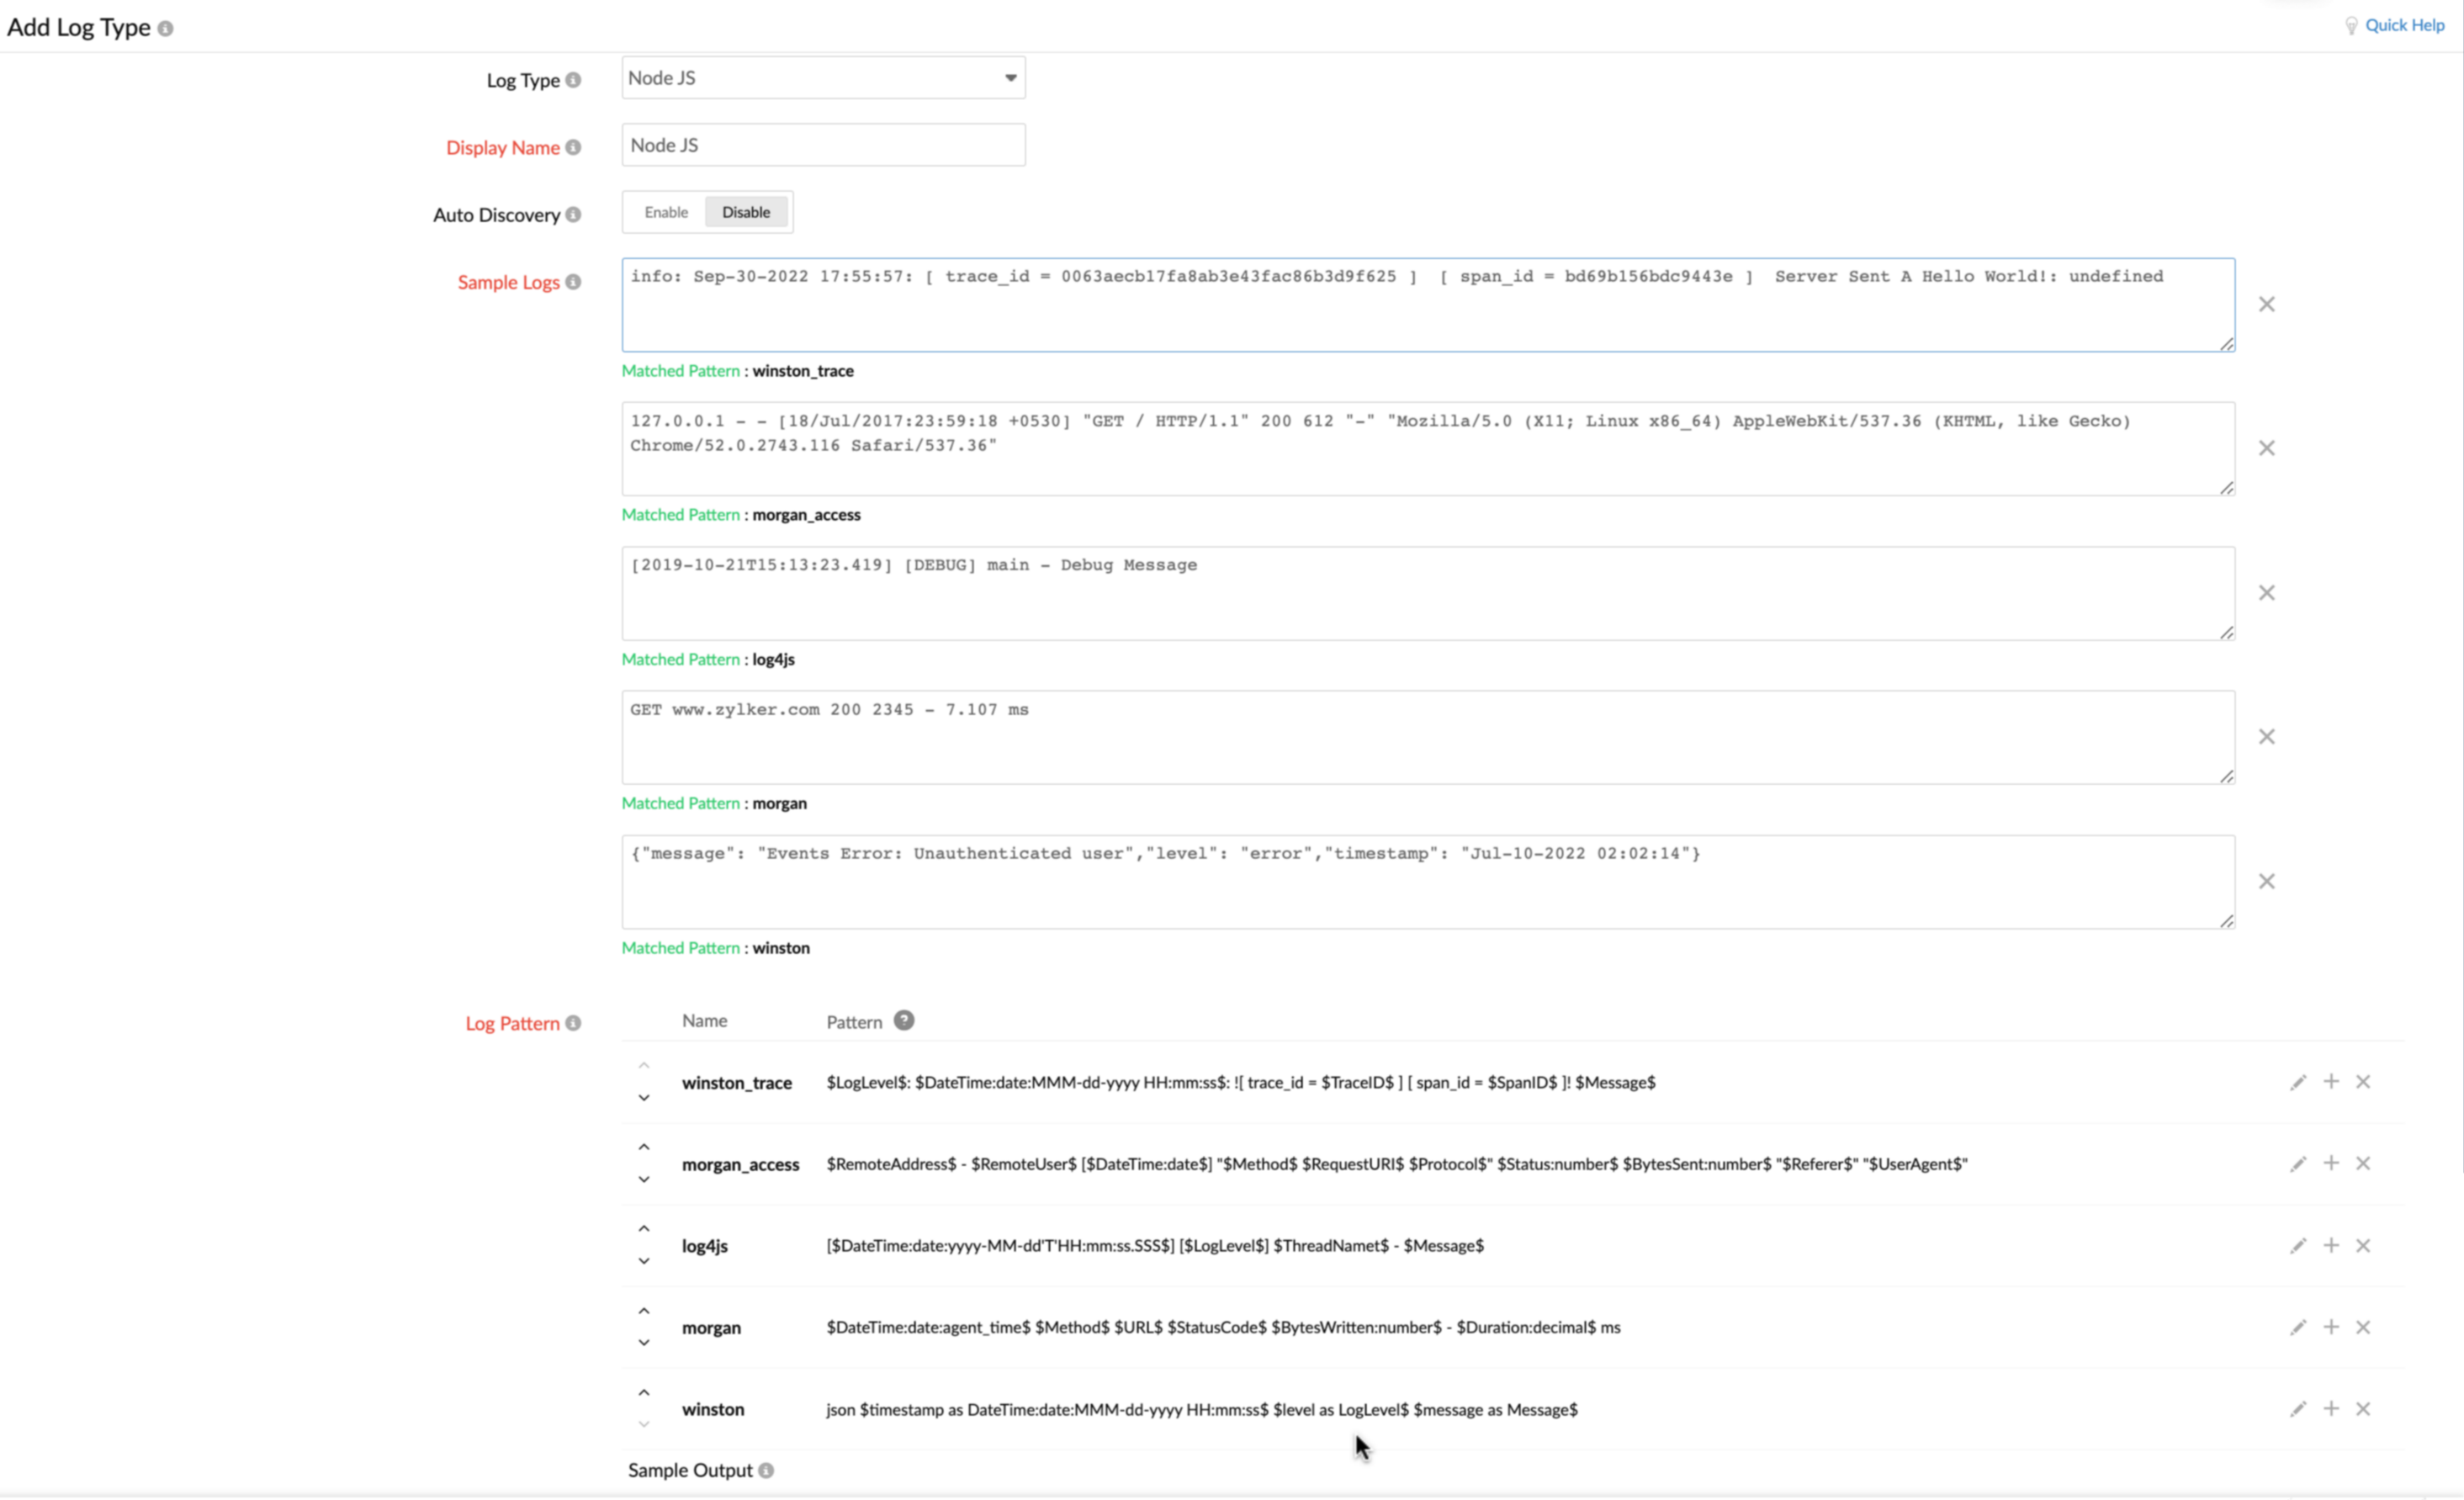
Using multiple log pattern support, you can add the required log pattern matching your logs. Below are the sample logs and their log patterns applicable for the Node.js logs:
Morgan access
Log pattern
$RemoteAddress$ - $RemoteUser$ [$DateTime:date$] "$Method$ $RequestURI$ $Protocol$" $Status:number$ $BytesSent:number$ "$Referer$" "$UserAgent$"
Sample log
127.0.0.1 - - [18/Jul/2017:23:59:18 +0530] "GET / HTTP/1.1" 200 612 "-" "Mozilla/5.0 (X11; Linux x86_64) AppleWebKit/537.36 (KHTML, like Gecko) Chrome/52.0.2743.116 Safari/537.36"
Morgan
Log pattern
$DateTime:date:agent_time$ $Method$ $URL$ $StatusCode$ $BytesWritten:number$ - $Duration:decimal$ ms
Sample log
GET www.zylker.com 304 5000 - 2.306 ms
winston
Log pattern
json $timestamp as DateTime:date:MMM-dd-yyyy HH:mm:ss$ $level as LogLevel$ $message as Message$
Sample log
{"message": "Events Error: Unauthenticated user","level": "error","timestamp": "Jul-10-2022 02:02:14"}
winston trace
Log pattern
$LogLevel$: $DateTime:date:MMM-dd-yyyy HH:mm:ss$: ![ trace_id = $TraceID$ ] [ span_id = $SpanID$ ]! $Message$
Sample log
info: Sep-30-2022 17:55:57: [ trace_id = 0063aecb17fa8ab3e43fac86b3d9f625 ] [ span_id = bd69b156bdc9443e ] Server Sent A Hello World!: undefined
log4js
Log pattern
[$DateTime:date:yyyy-MM-dd'T'HH:mm:ss.SSS$] [$LogLevel$] $ThreadNamet$ - $Message$
Sample log
[2019-10-21T15:13:23.419] [INFO] default - An info message

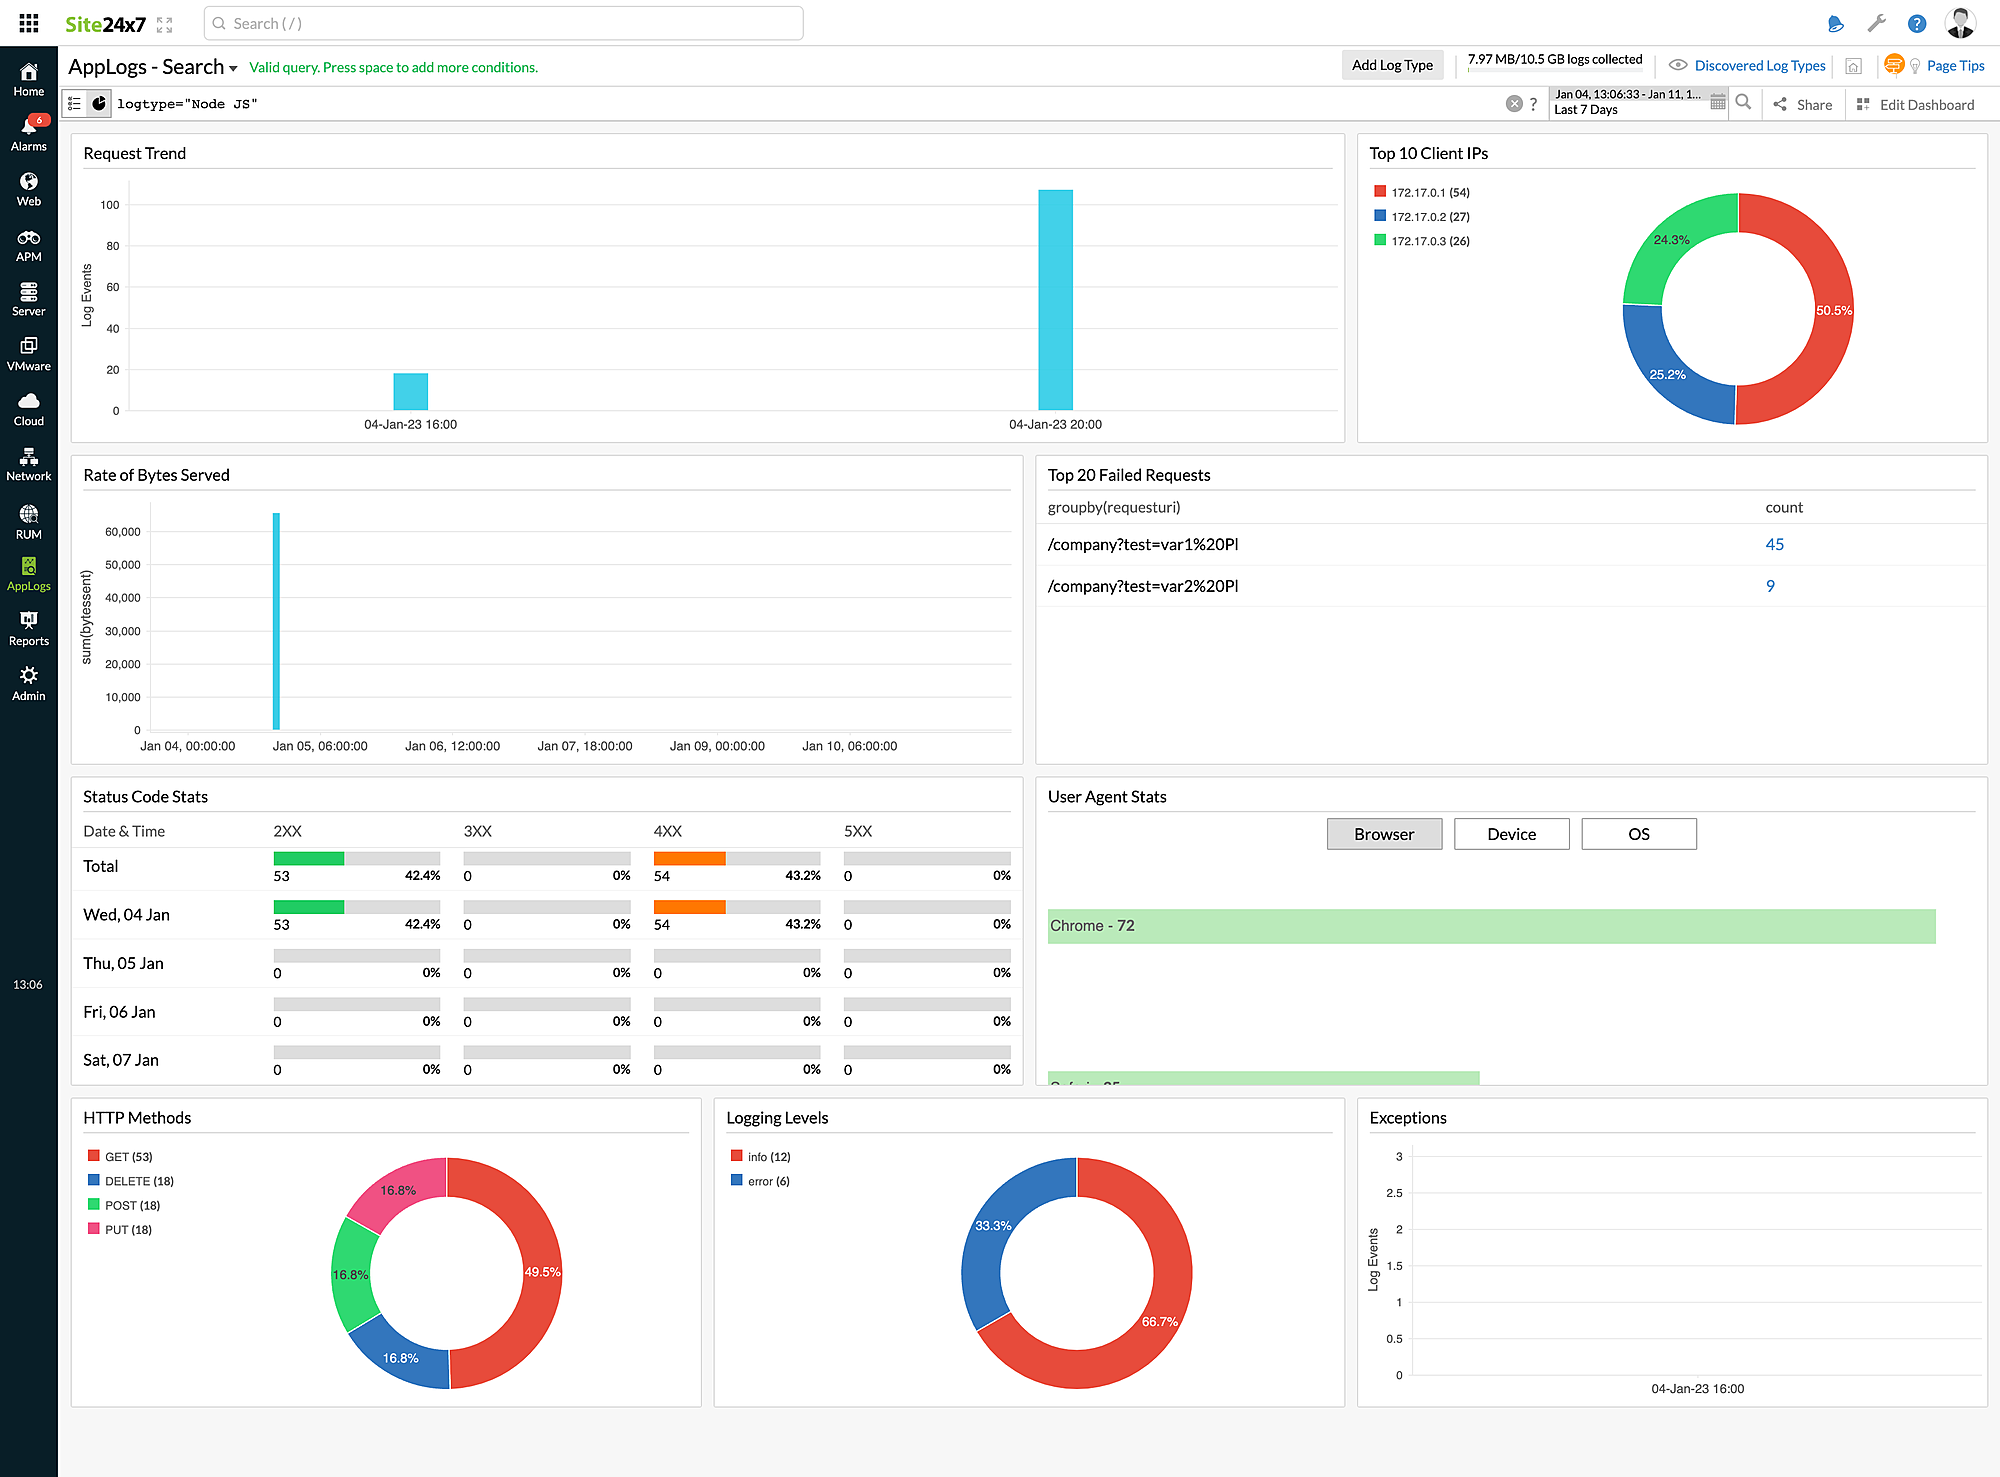
Dashboard
Here is a list of the widgets available on the Node.js logs dashboard:
- Request Trend
- Top 10 Client IPs
- Rate of Bytes Served
- Top 20 Failed Requests
- Status Code Stats
- User Agent Stats
- HTTP Methods
- Logging Levels
- Exceptions

