IIS Error Logs
Incoming server requests are first routed through HTTP.SYS, and then to IIS servers. An IIS access log should record every single web request. If a web request isn't recorded, it's possible that either the request never made it to the IIS server or the IIS server wasn't running. In such cases, these errors are logged in HTTPERR; 400, 503, and 504 are some of the most common errors you’ll find in IIS error logs. Learn more about log management with Site24x7.
Getting started
- Log in to your Site24x7 account.
- Download and install the Site24x7 Server Monitoring agent (Windows).
- Go to Admin > AppLogs > Log Profile and Add Log Profile.
Log file path
Each application writes logs in different folders and files. By default, IIS error logs are sourced from the folder path mentioned below. If you have logs in a different folder, you can add them under the File Path to source them from that particular folder while creating a log profile.

Log pattern
$DateTime:date$ $ClientIP$ $ClientPort:number$ $ServerIP$ $ServerPort:number$ $ProtocolVersion$ $Method$ $RequestUri$ $StatusCode:number$ $SiteId$ $Reason$ $QueueName$
This is the default log pattern defined by Site24x7 for parsing IIS error logs.
Sample log
2018-08-20 21:42:28 192.168.218.147 42294 172.21.9.17 80 HTTP/1.1 POST /sites/sachin/_vti_bin/sites.asmx 404 - NotFound -
The above sample log can be separated into 12 fields, each of which will take its respective value from the original log, and then be uploaded to Site24x7.
| Field name | Filed value |
| Date Time | 2018-08-20 21:42:28 |
| Client IP | 192.168.218.147 |
| Client Port | 42294 |
| Server IP | 172.21.9.17 |
| Server Port | 80 |
| Protocol Version | HTTP/1.1 |
| Method | POST |
| Request URI | /sites/sachin/_vti_bin/sites.asmx |
| Status Code | 404 |
| Site ID | - |
| Reason | NotFound |
| Queue Name | - |
You can also monitor the availability and performance of IIS servers using Site24x7 IIS server monitoring.
IIS error logs dashboard
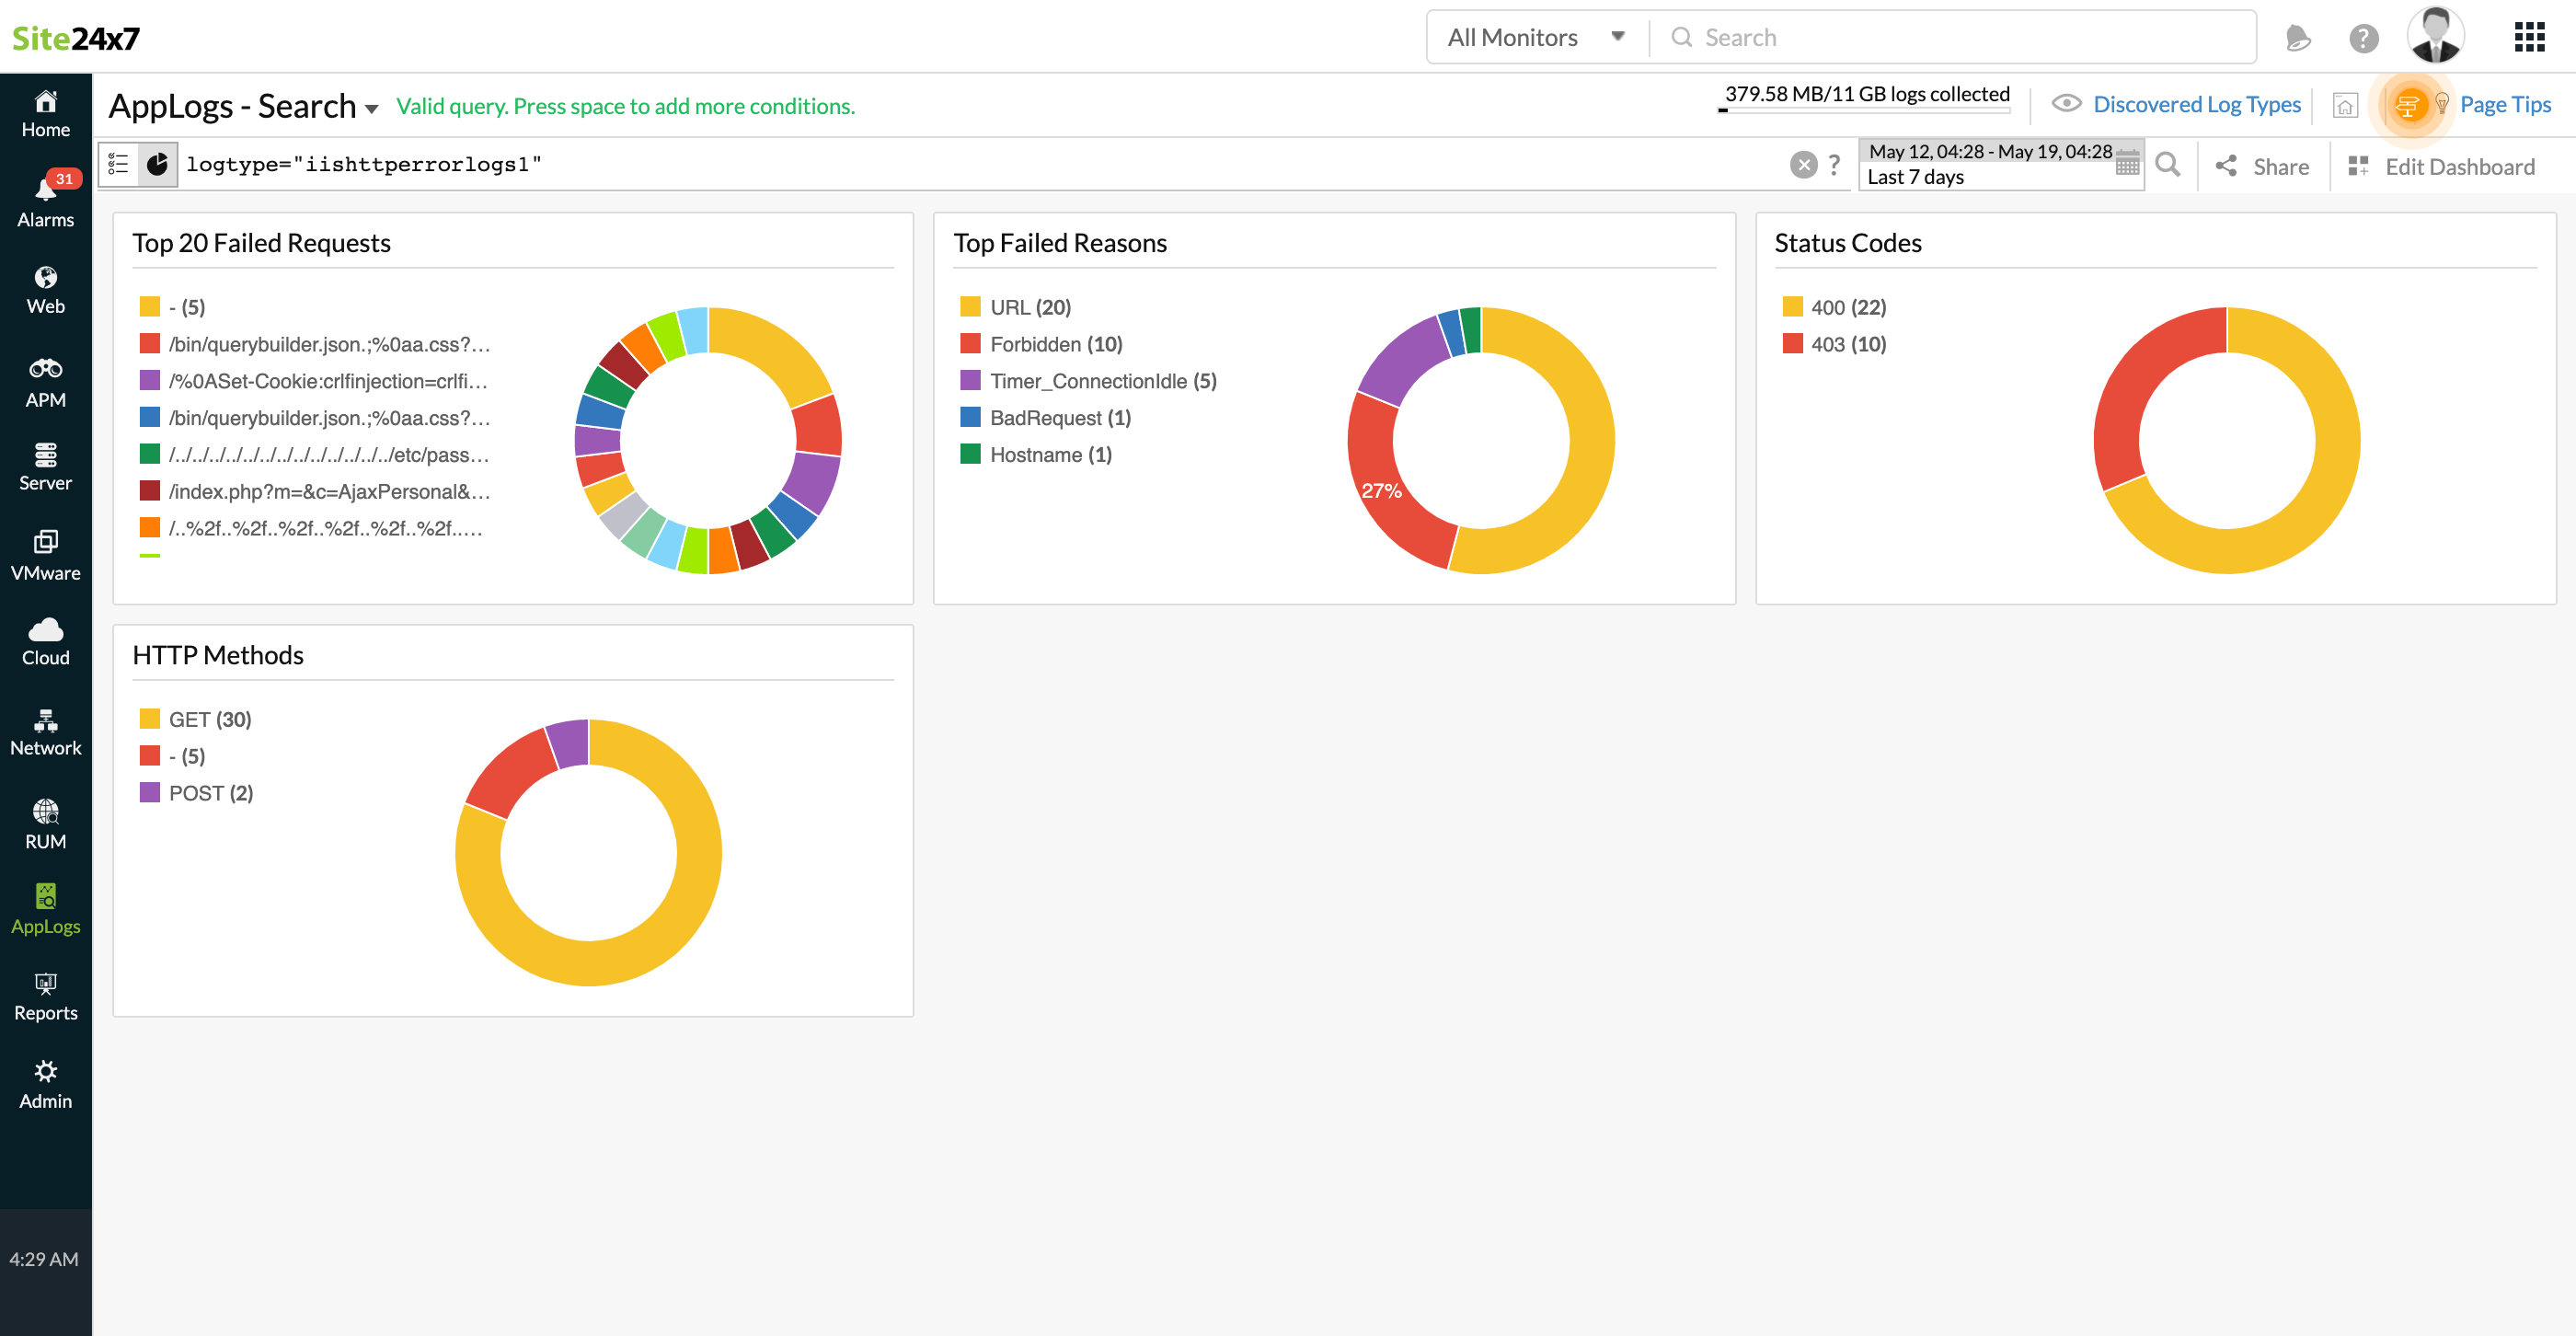
AppLogs creates an exclusive dashboard for every Log Type, and shows a few widgets by default. Here's a list of the widgets available in the IIS error logs dashboard:
- Top 20 Failed Requests
- Top Failed Reasons
- Status Codes
- HTTP Methods

In addition to the default widgets, your saved searches will also be added to the dashboard automatically.
