Google Cloud Platform VPC Flow Logs
VPC Flow Logs gives you information on the IP traffic to and from network interfaces within your virtual private cloud (VPC). You can follow the steps in this document to collect VPC flow logs from Google Cloud Platform (GCP) and forward them to Site24x7's AppLogs for monitoring.
Prerequisites
The logged-in user should have owner-level permissions for the project. In other words, the user should have permission to:
- Create a Pub/Sub topic and set its permissions.
- Create and update a Log Router.
- Create a Dataflow job.
Enable VPC Flow Logs for an existing subnet
Follow the steps below to enable VPC Flow Logs for an existing subnet. Refer to Google's official documentation for more information.
- Go to the VPC networks page in the Google Cloud console.
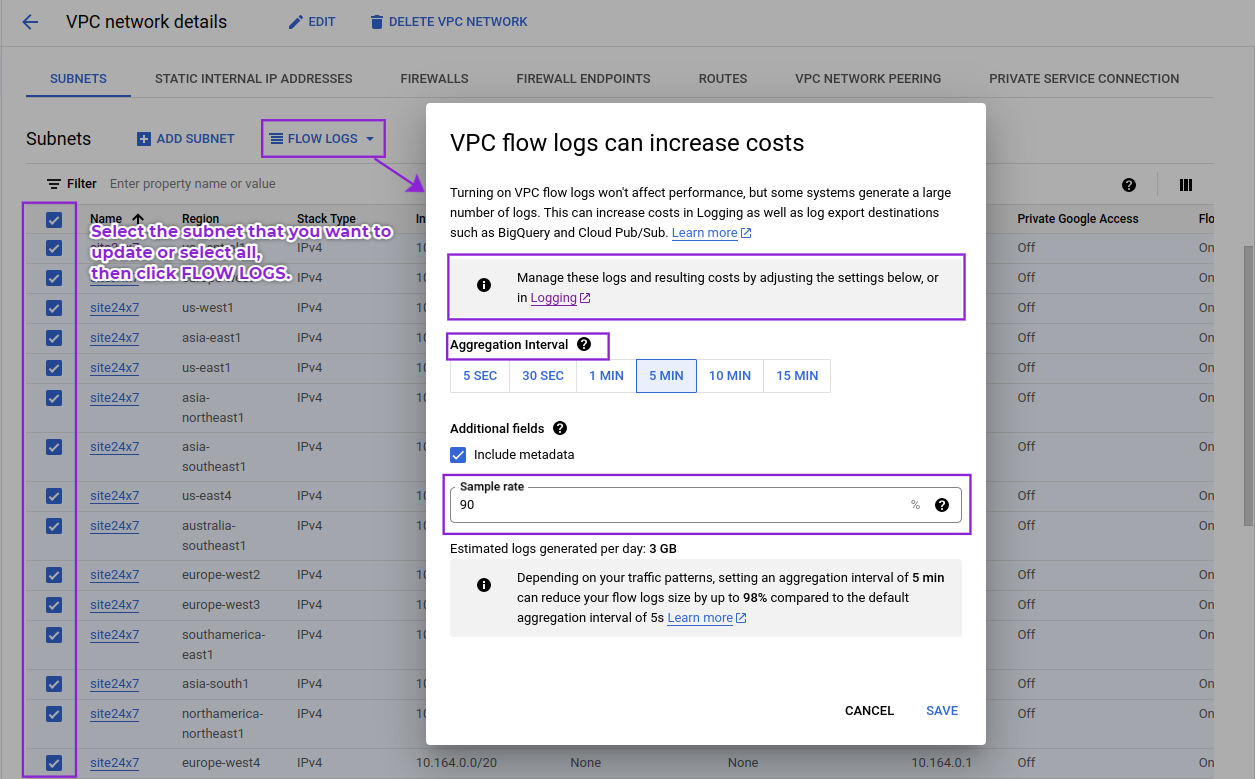
- You can either select the subnet you want to update or select all, then click FLOW LOGS.
- Adjust the Aggregation Interval and Sample rate to manage the logs and data ingestion cost. For example, if you keep a 100% Sample rate with an Aggregation Interval of 5 SEC, then all the entries are kept, resulting in a higher data ingestion cost.
- Click SAVE.
GCP VPC flow log best practice
Aggregation interval
To troubleshoot network connectivity issues or detect security threats in real time, we recommend setting the aggregation interval to 5 seconds. If you only want to analyze network performance or optimize network costs, we recommend setting the aggregation interval to one minute, 5 minutes, or 10 minutes.
Sampling rate
Set the flow sampling rate to 100% (for all logs). This will ensure Site24x7 captures all network traffic, not just a sample.

Log forwarding from GCP
Follow the steps in this document to forward logs from the GCP. Make sure to configure the log filter, as mentioned below, when creating a log routing sink:
gcloud logging sinks create SINK_NAME pubsub.googleapis.com/projects/PROJECT_ID/topics/TOPIC_NAME --log-filter='resource.type="gce_subnetwork"'
Sample log
Below is the sample log syntax for VPC Flow Logs:
{
    "insertId": "2s85kofd71z0y",
    "jsonPayload": {
        "reporter": "SRC",
        "src_gke_details": {
            "pod": {
                "pod_name": "packageserver-df86dcdd-qlpnz",
                "pod_namespace": "olm"
            },
            "cluster": {
                "cluster_name": "redis-test",
                "cluster_location": "us-central1-a"
            },
            "service": [
                {
                    "service_name": "packageserver-service",
                    "service_namespace": "olm"
                }
            ]
        },
        "src_instance": {
            "zone": "us-central1-a",
            "region": "us-central1",
            "project_id": "zylker-a76a7ass",
            "vm_name": "gke-redis-test-default-pool-2f152eb2-53hc"
        },
        "dest_vpc": {
            "project_id": "zylker-a76a7ass",
            "vpc_name": "default",
            "subnetwork_name": "default"
        },
        "src_vpc": {
            "vpc_name": "default",
            "project_id": "zylker-a76a7ass",
            "subnetwork_name": "default"
        },
        "dest_instance": {
            "region": "us-central1",
            "vm_name": "gke-redis-test-default-pool-2f152eb2-x642",
            "project_id": "zylker-a76a7ass",
            "zone": "us-central1-a"
        },
        "dest_gke_details": {
            "pod": {
                "pod_namespace": "kube-system",
                "pod_name": "konnectivity-agent-777f7f84d6-57fgj"
            },
            "cluster": {
                "cluster_name": "redis-test",
                "cluster_location": "us-central1-a"
            }
        },
        "packets_sent": "8",
        "end_time": "2023-10-11T05:25:47.962287597Z",
        "bytes_sent": "1448",
        "start_time": "2023-10-11T05:25:47.958517575Z",
        "connection": {
            "dest_ip": "10.10.0.10",
            "protocol": 6,
            "dest_port": 11111,
            "src_ip": "10.10.0.10",
            "src_port": 1111
        }
    },
    "resource": {
        "type": "gce_subnetwork",
        "labels": {
            "subnetwork_name": "default",
            "project_id": "zylker-a76a7ass",
            "location": "us-central1-a",
            "subnetwork_id": "12345678901"
        }
    },
    "timestamp": "2023-10-11T05:25:52.288729877Z",
    "logName": "projects/zylker-a76a7ass
logs/compute.googleapis.com%2Fvpc_flows",
 "
receiveTimestamp": "2023-10-11T05:25:52.288729877Z"
}
VPC Flow Logs dashboard
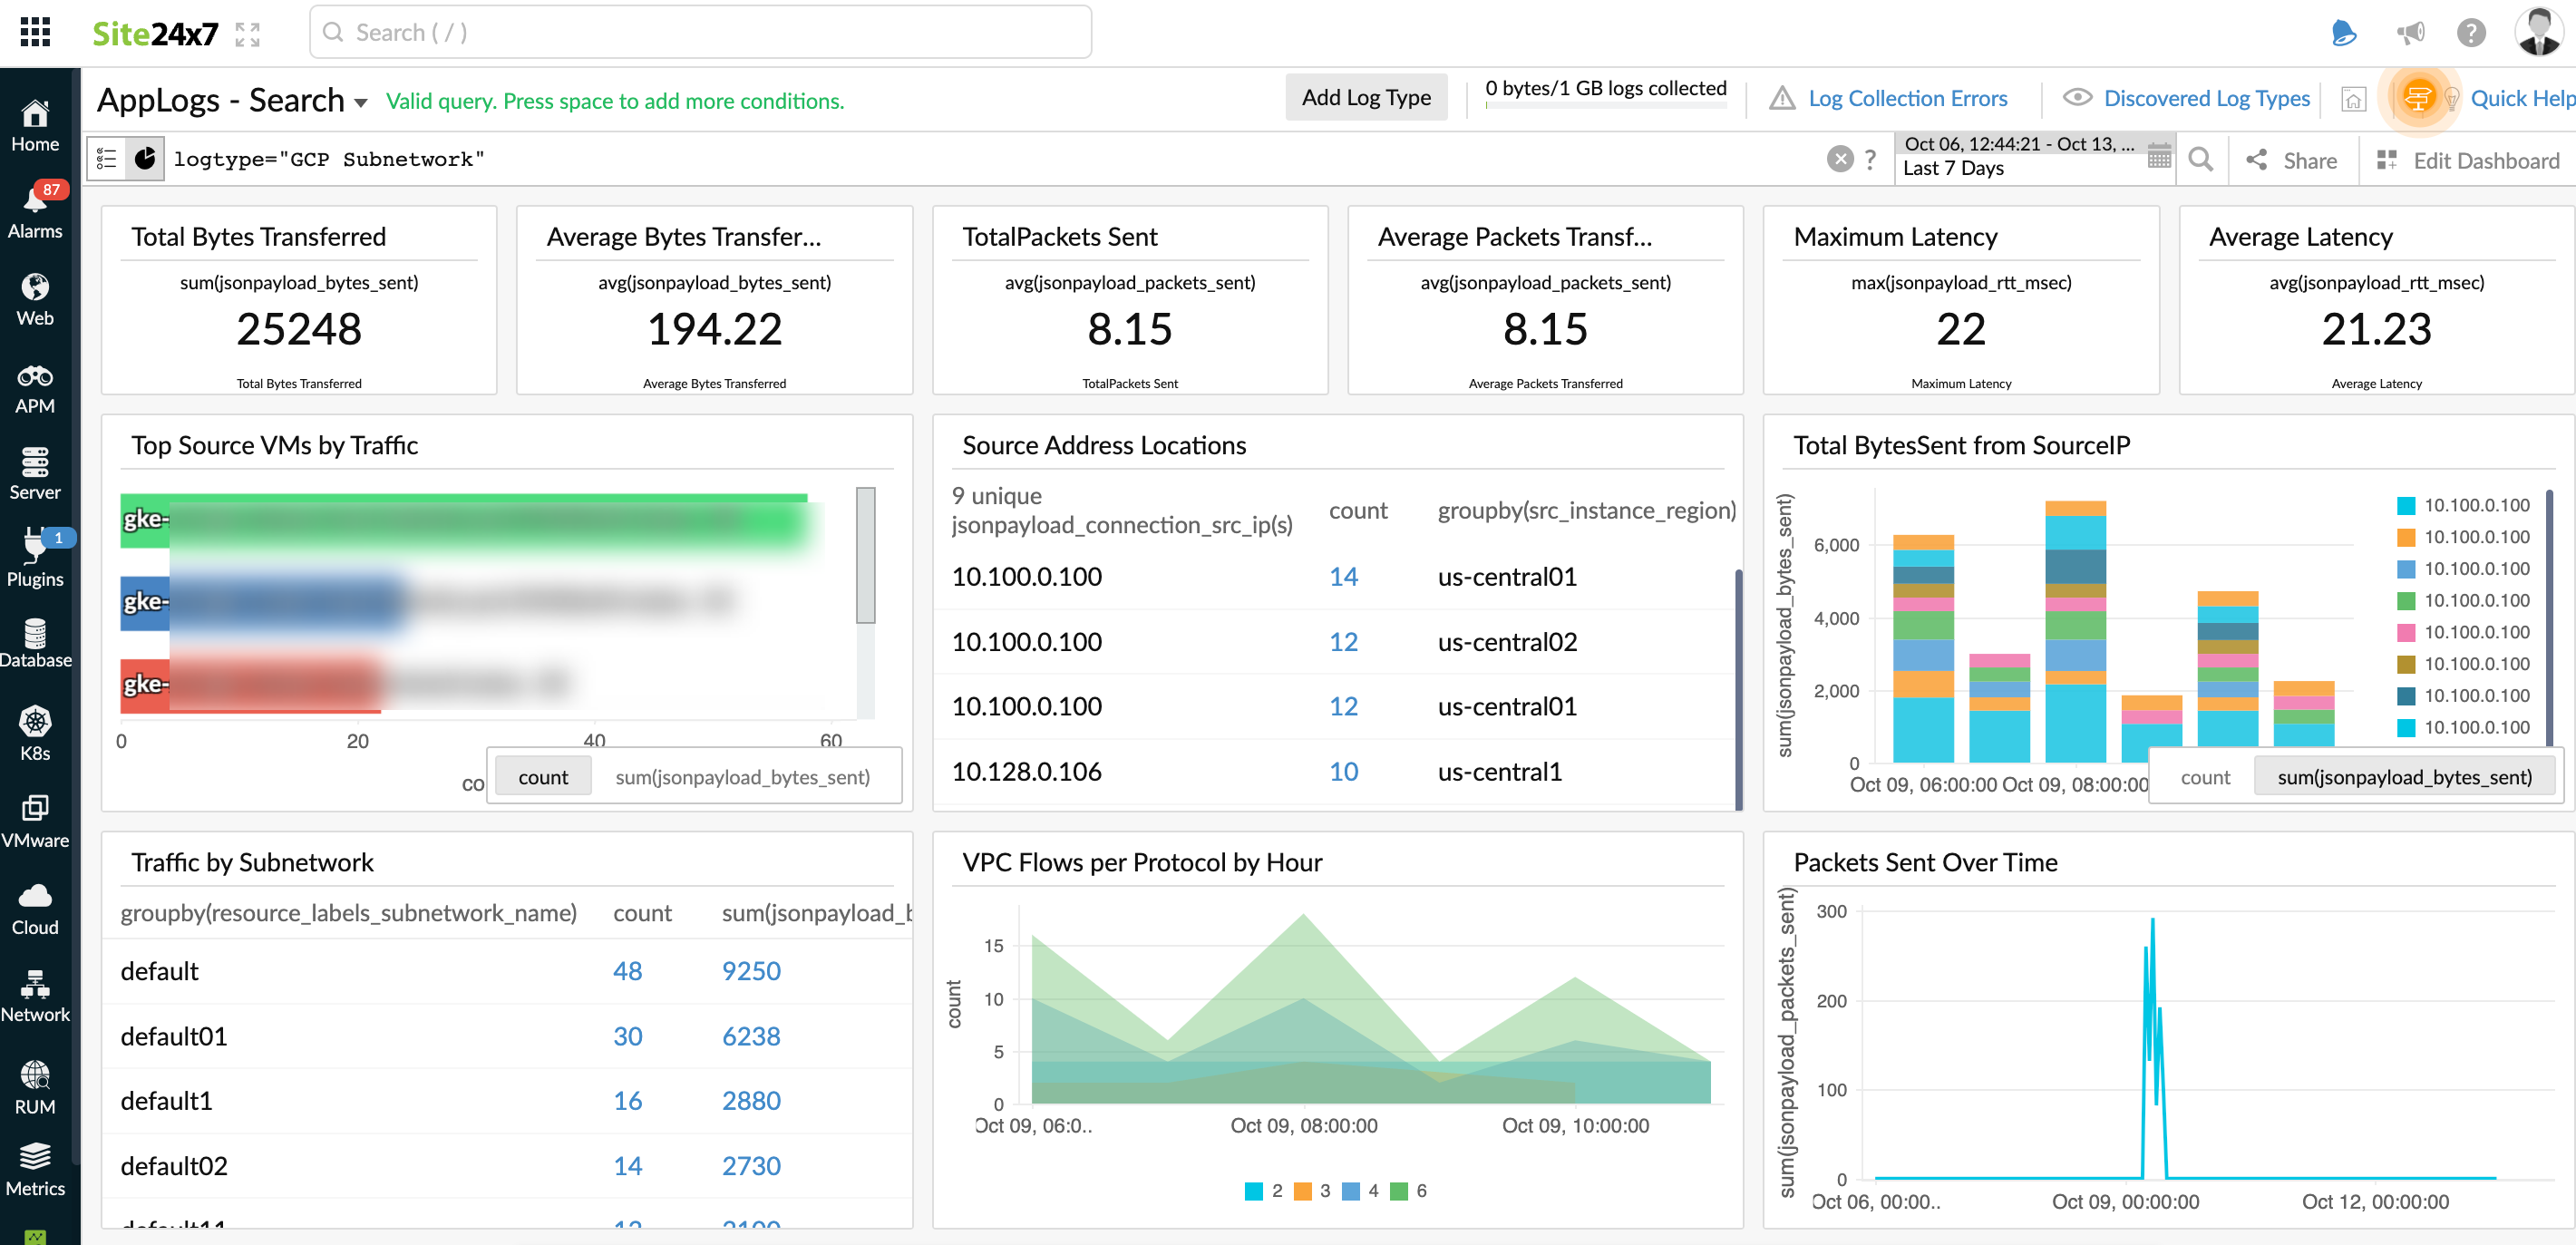
Here's a list of the widgets available on the GCP VPC Flow Logs dashboard:
- Total Bytes Transferred
- Average Bytes Transferred
- TotalPackets Sent
- Average Packets Transferred
- Maximum Latency
- Average Latency
- Top Source VMs by Traffic
- Source Address Locations
- Total BytesSent from SourceIP
- Traffic by Subnetwork
- VPC Flows per Protocol by Hour
- Packets Sent Over Time
- Bytes transfers by source and destination IP addresses
- Average Latency of Destination over time
- Destination Address Locations
- Top External Destination Ports by VPC Flows
- Top External IPs by VPC Flows
- Top Destination IPs by Traffic

