Cluster Messages based on Pattern Similarity using Log Templates
Often, we get hundreds of log lines with a similar pattern that differ only by one or two variables. Instead of displaying them as separate log lines, Site24x7 AppLogs groups them into one line and shows the different variables with their metrics separately. This means that log lines are soft-matched to group messages with similar structures, Site24x7 combines repeated text strings and displays the variable part in those strings separately. This solution also displays the variable parameters within a pie chart for string data, and within a line chart for number data so you can easily view trends.
If there is more than one variable in a common text string, they are displayed as separate columns, differentiated with color codes.
Accessing Log Templates
You can view the Log Templates for your queries using a few simple steps:
- Log in to your Site24x7 account and go to the AppLogs tab.
- Enter a search query.
- Once the results populate, click the Log Templates button on the top right corner.
- Choose any string field corresponding to the log type from the drop-down menu. Here, we can consider choosing Message.
This will group the messages with similar text strings and highlight the variables using a *.
Refer to the below how-to video to group messages with a similar structure:
Use case
Let's consider the following logline:
( inode2.apm- 2k12 r2-aio ) Unable to open queue on WebSphere MQ queue manager ''APMQA'': completion code 2; reason code 2085 . An failure occurred when opening the indicated WebSphere MQ message queue. The error codes relate to the MQOPEN call. Check the WebSphere MQ completion and reason codes in the WebSphere MQ Application Programming Reference manual to establish the cause of the error, and take the appropriate action. You might have to restart the integration node after you take this recovery action. If the failure to open occurred because the queue manager or queue did not exist, define these objects to WebSphere MQ. If the failure occurred because incorrect object names were specified, correct the message flow configuration, and attempt to redeploy the integration node.
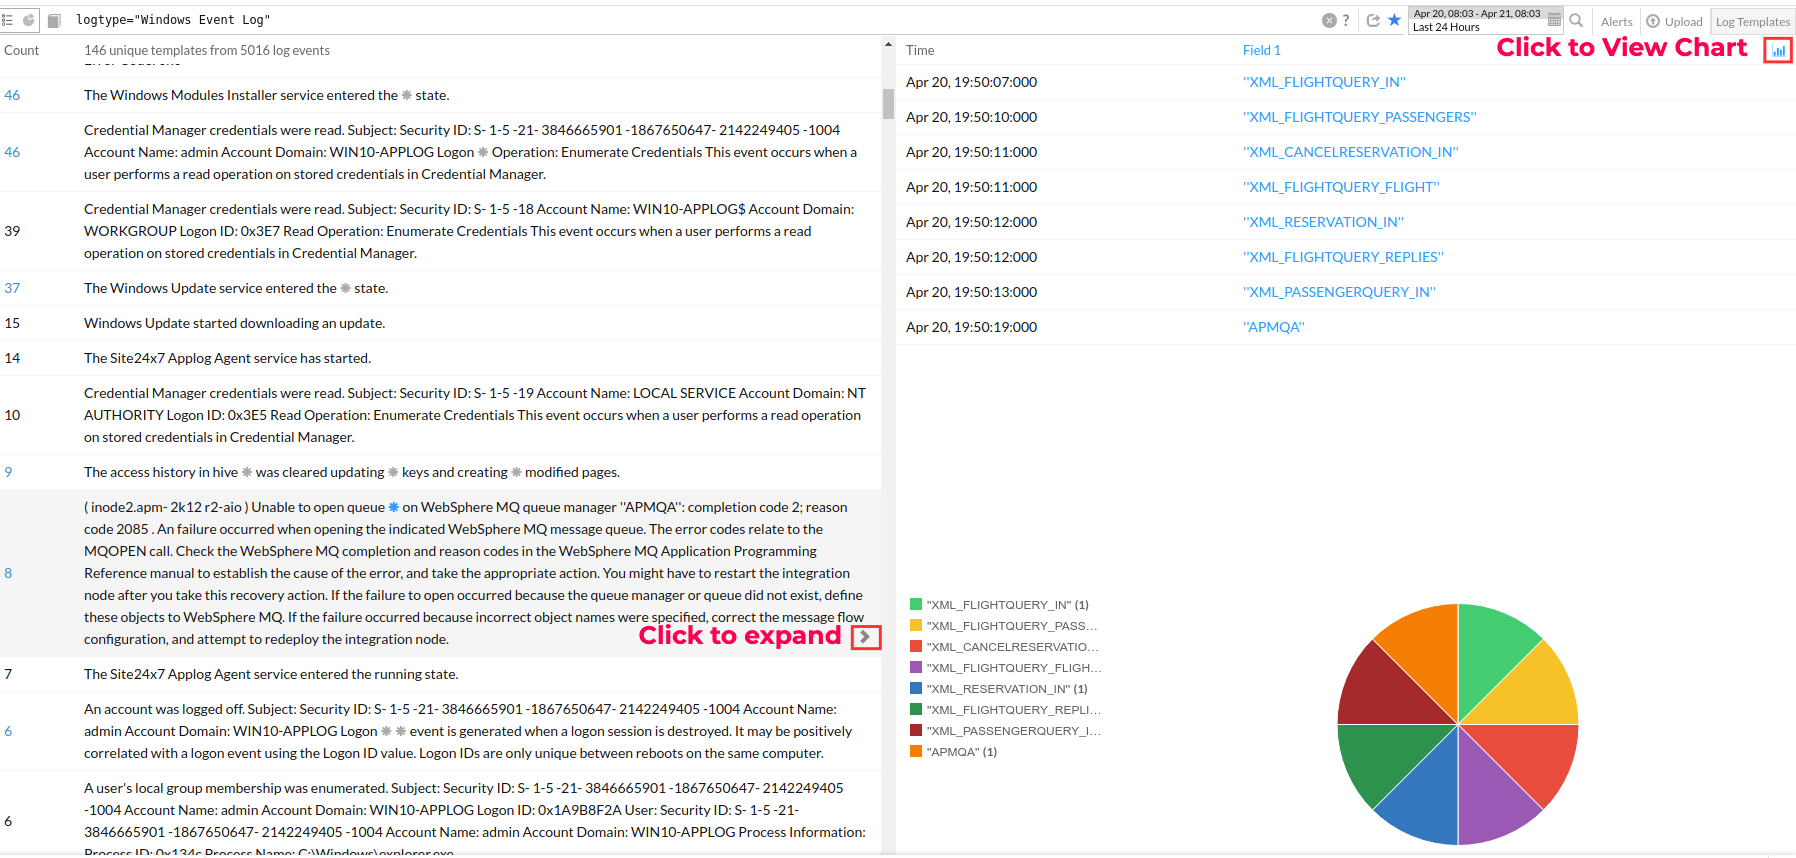
Here, * denotes the variables. Refer to the screenshot below to better understand from the color-coding. You can view the number of log lines grouped under the Count column. The variables are categorized based on time, and displayed on the right.

When there are multiple variables, they are shown as different fields and displayed as columns in a table with a distinct color code differentiation.
You can choose to view charts for a field by clicking ![]() , next to a field name.
, next to a field name.
You can also click on a grouped logline to expand and view it in detail.
Related articles:
-
On this page
- Accessing Log Templates
- Use case
- Related articles
