AWS API Gateway Access Logs
Amazon API Gateway is a centralized service to create, publish, maintain, monitor, and secure your APIs under one roof. To help debug issues related to request execution or client access to your API, you can enable logs for your API calls.
AWS API Gateway access logs contain the summary of individual requests that hit the API Gateway instance. These logs serve as a general summary of the requests handled by the API gateway.
With Site24x7 AppLogs, you can collect, consolidate, track, and manage your AWS API Gateway access logs.
Prerequisites:
You need to enable logging for your API Gateway and it should be forwarded to CloudWatch logs in order to monitor them using Site24x7.
Table of contents:
1. Create a Log Profile for AWS API Gateway access logs
3. View AWS API Gateway Access Logs
Detailed steps:
1.Create a Log Profile
The first step to monitor AWS API logs is to create a Log Profile for them in Site24x7 AppLogs. To create a log profile:
- Log in to your Site24x7 account > Admin > AppLogs > Log Profile.
- Enter a Profile Name.
- Choose AWS API Gateway Access Logs as the Log Type.
- In general, the default log pattern is applied. Log Pattern:
json $requestTime:date:dd/MMM/yyyy:HH:mm:ss Z$ $domainname$ $path$ $caller$ $protocol$ $requestId$ $ip:ip$ $resourcePath$ $responseLength$ $httpMethod$ $user$ $status$ $responselatency:number$File Path
- Sample Logs:
{ "domainname":"zlyker.com", "path":"\user", "requestId":"1f286b4d-2d8b-432a-9841-6e931accb312", "ip": "16.41.70.121", "caller":"-", "user":"-","requestTime":"14/Feb/2020:20:42:25 +0000", "httpMethod":"POST","resourcePath":"/{myproxy+}", "status":"200","protocol":"HTTP/1.1", "responseLength":"307", "responselatency":"39" }
{ "domainname":"zlyker.com", "path":"\view", "requestId":"1f286b4d-2d8b-432a-9841-6e931accb322", "ip": "46.11.70.221", "caller":"-", "user":"-","requestTime":"14/Feb/2020:20:43:25 +0000", "httpMethod":"POST","resourcePath":"/{myproxy+}", "status":"200","protocol":"HTTP/1.1", "responseLength":"1507", "responselatency":"149" }
{ "domainname":"zlyker.com", "path":"\validate", "requestId":"1f286b4d-2d8b-432a-9841-6e931accb332", "ip": "86.41.10.221", "caller":"-", "user":"-","requestTime":"14/Feb/2020:20:44:30 +0000", "httpMethod":"POST","resourcePath":"/{myproxy+}", "status":"400","protocol":"HTTP/1.1", "responseLength":"7","responselatency":"3" } - You can also give your own log pattern instead of the default one. To do so, click on the pencil icon.
- Enter your log pattern and give three examples for us to understand and query your log pattern.
- In general, the default log pattern is applied. Log Pattern:
- Select AWS Lambda as the Log Source.
- Copy the input variable displayed; this is your environment variable for the Lambda function (explained in the next step).
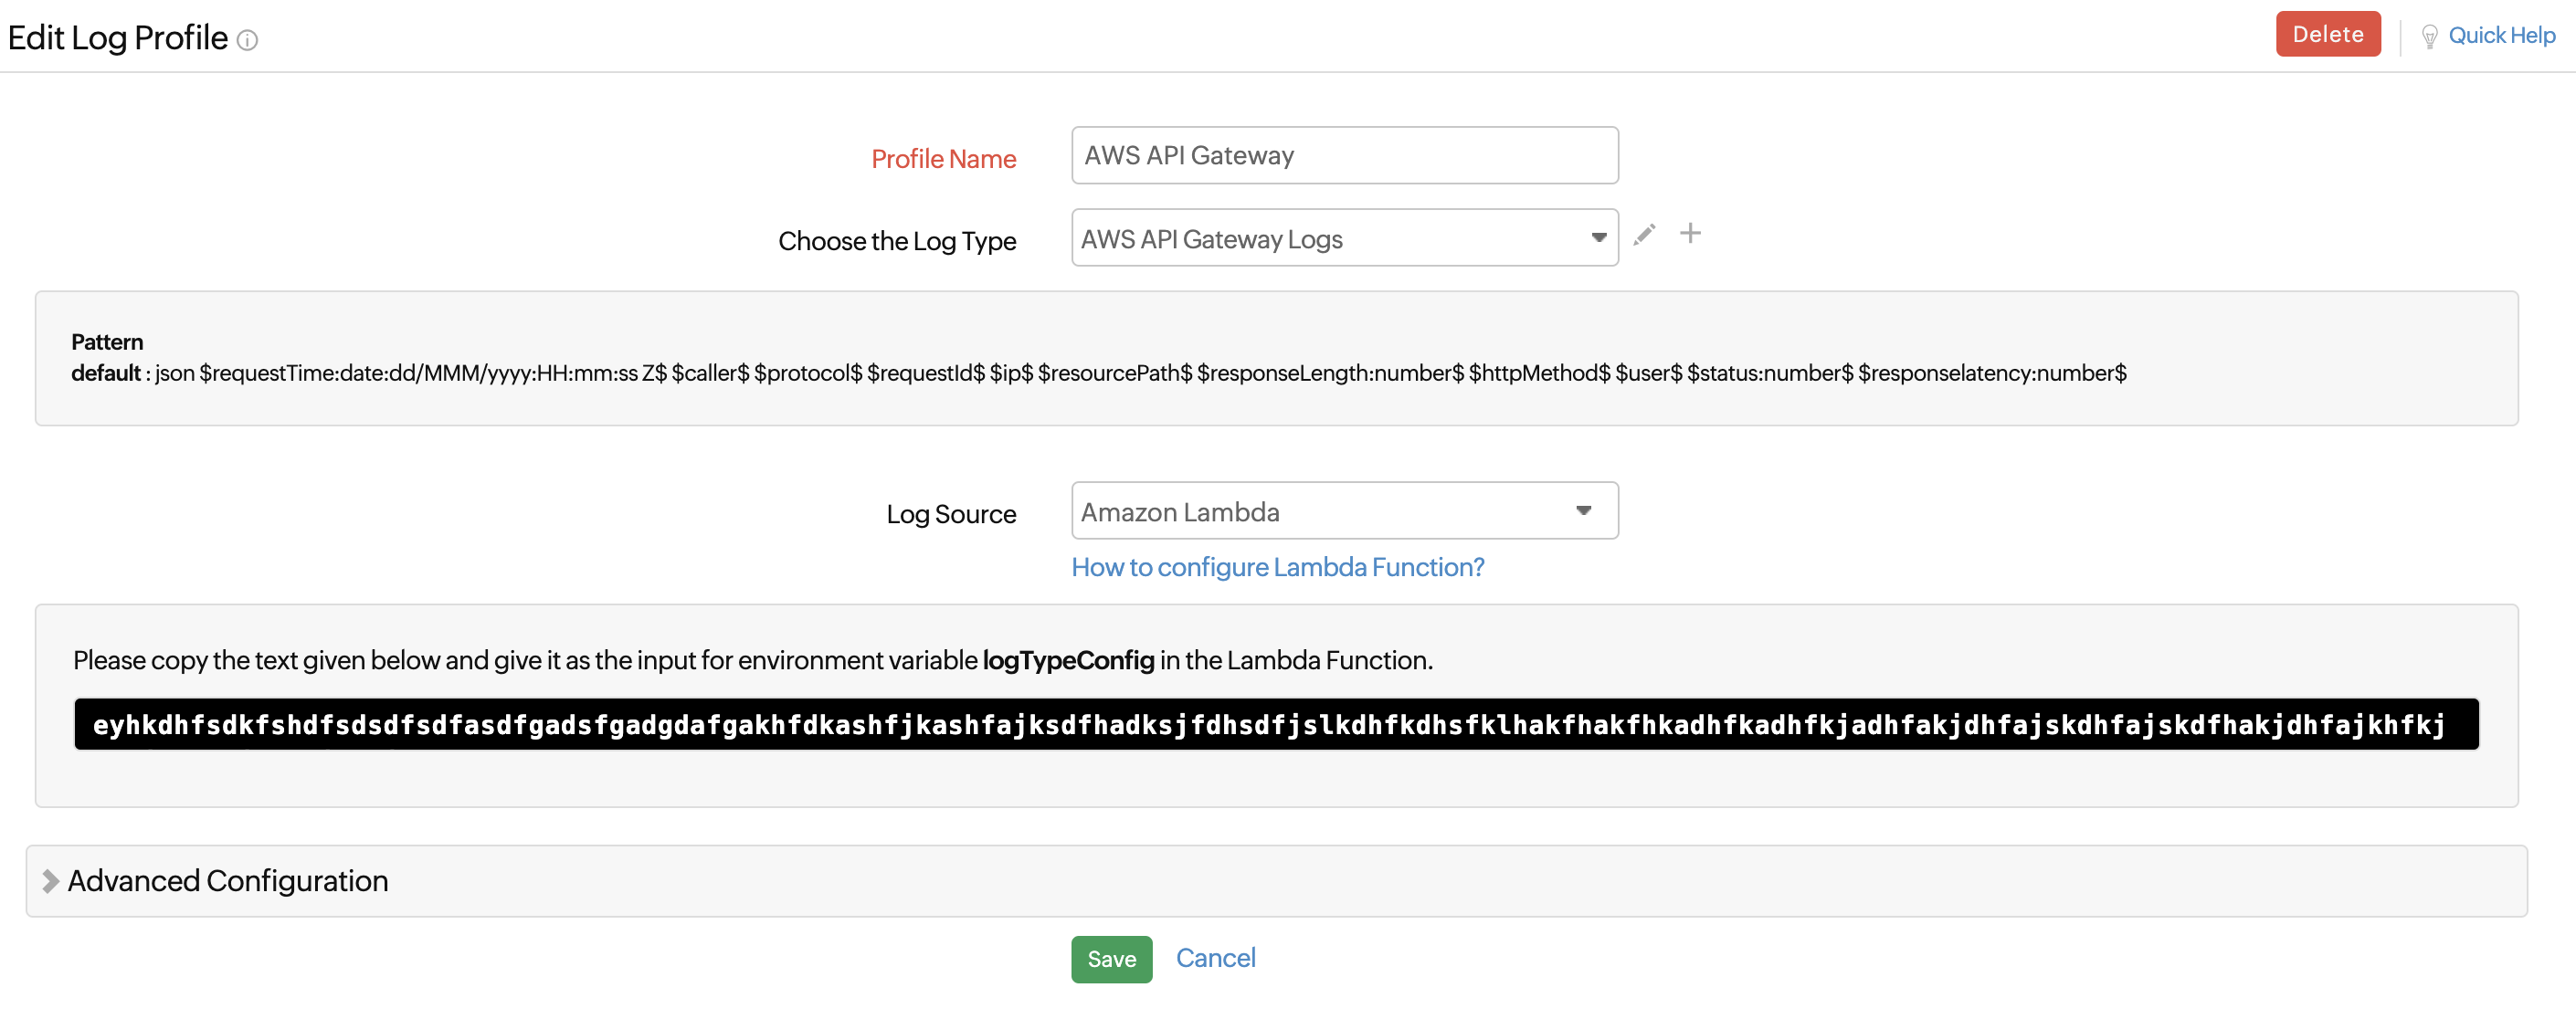
- Click Save.
2. Create the Lambda function
- Choose Lambda from the Services drop-down list, and choose Create Function. Select Author from scratch, define a name for the function, and choose Python 3.7 as the Runtime.
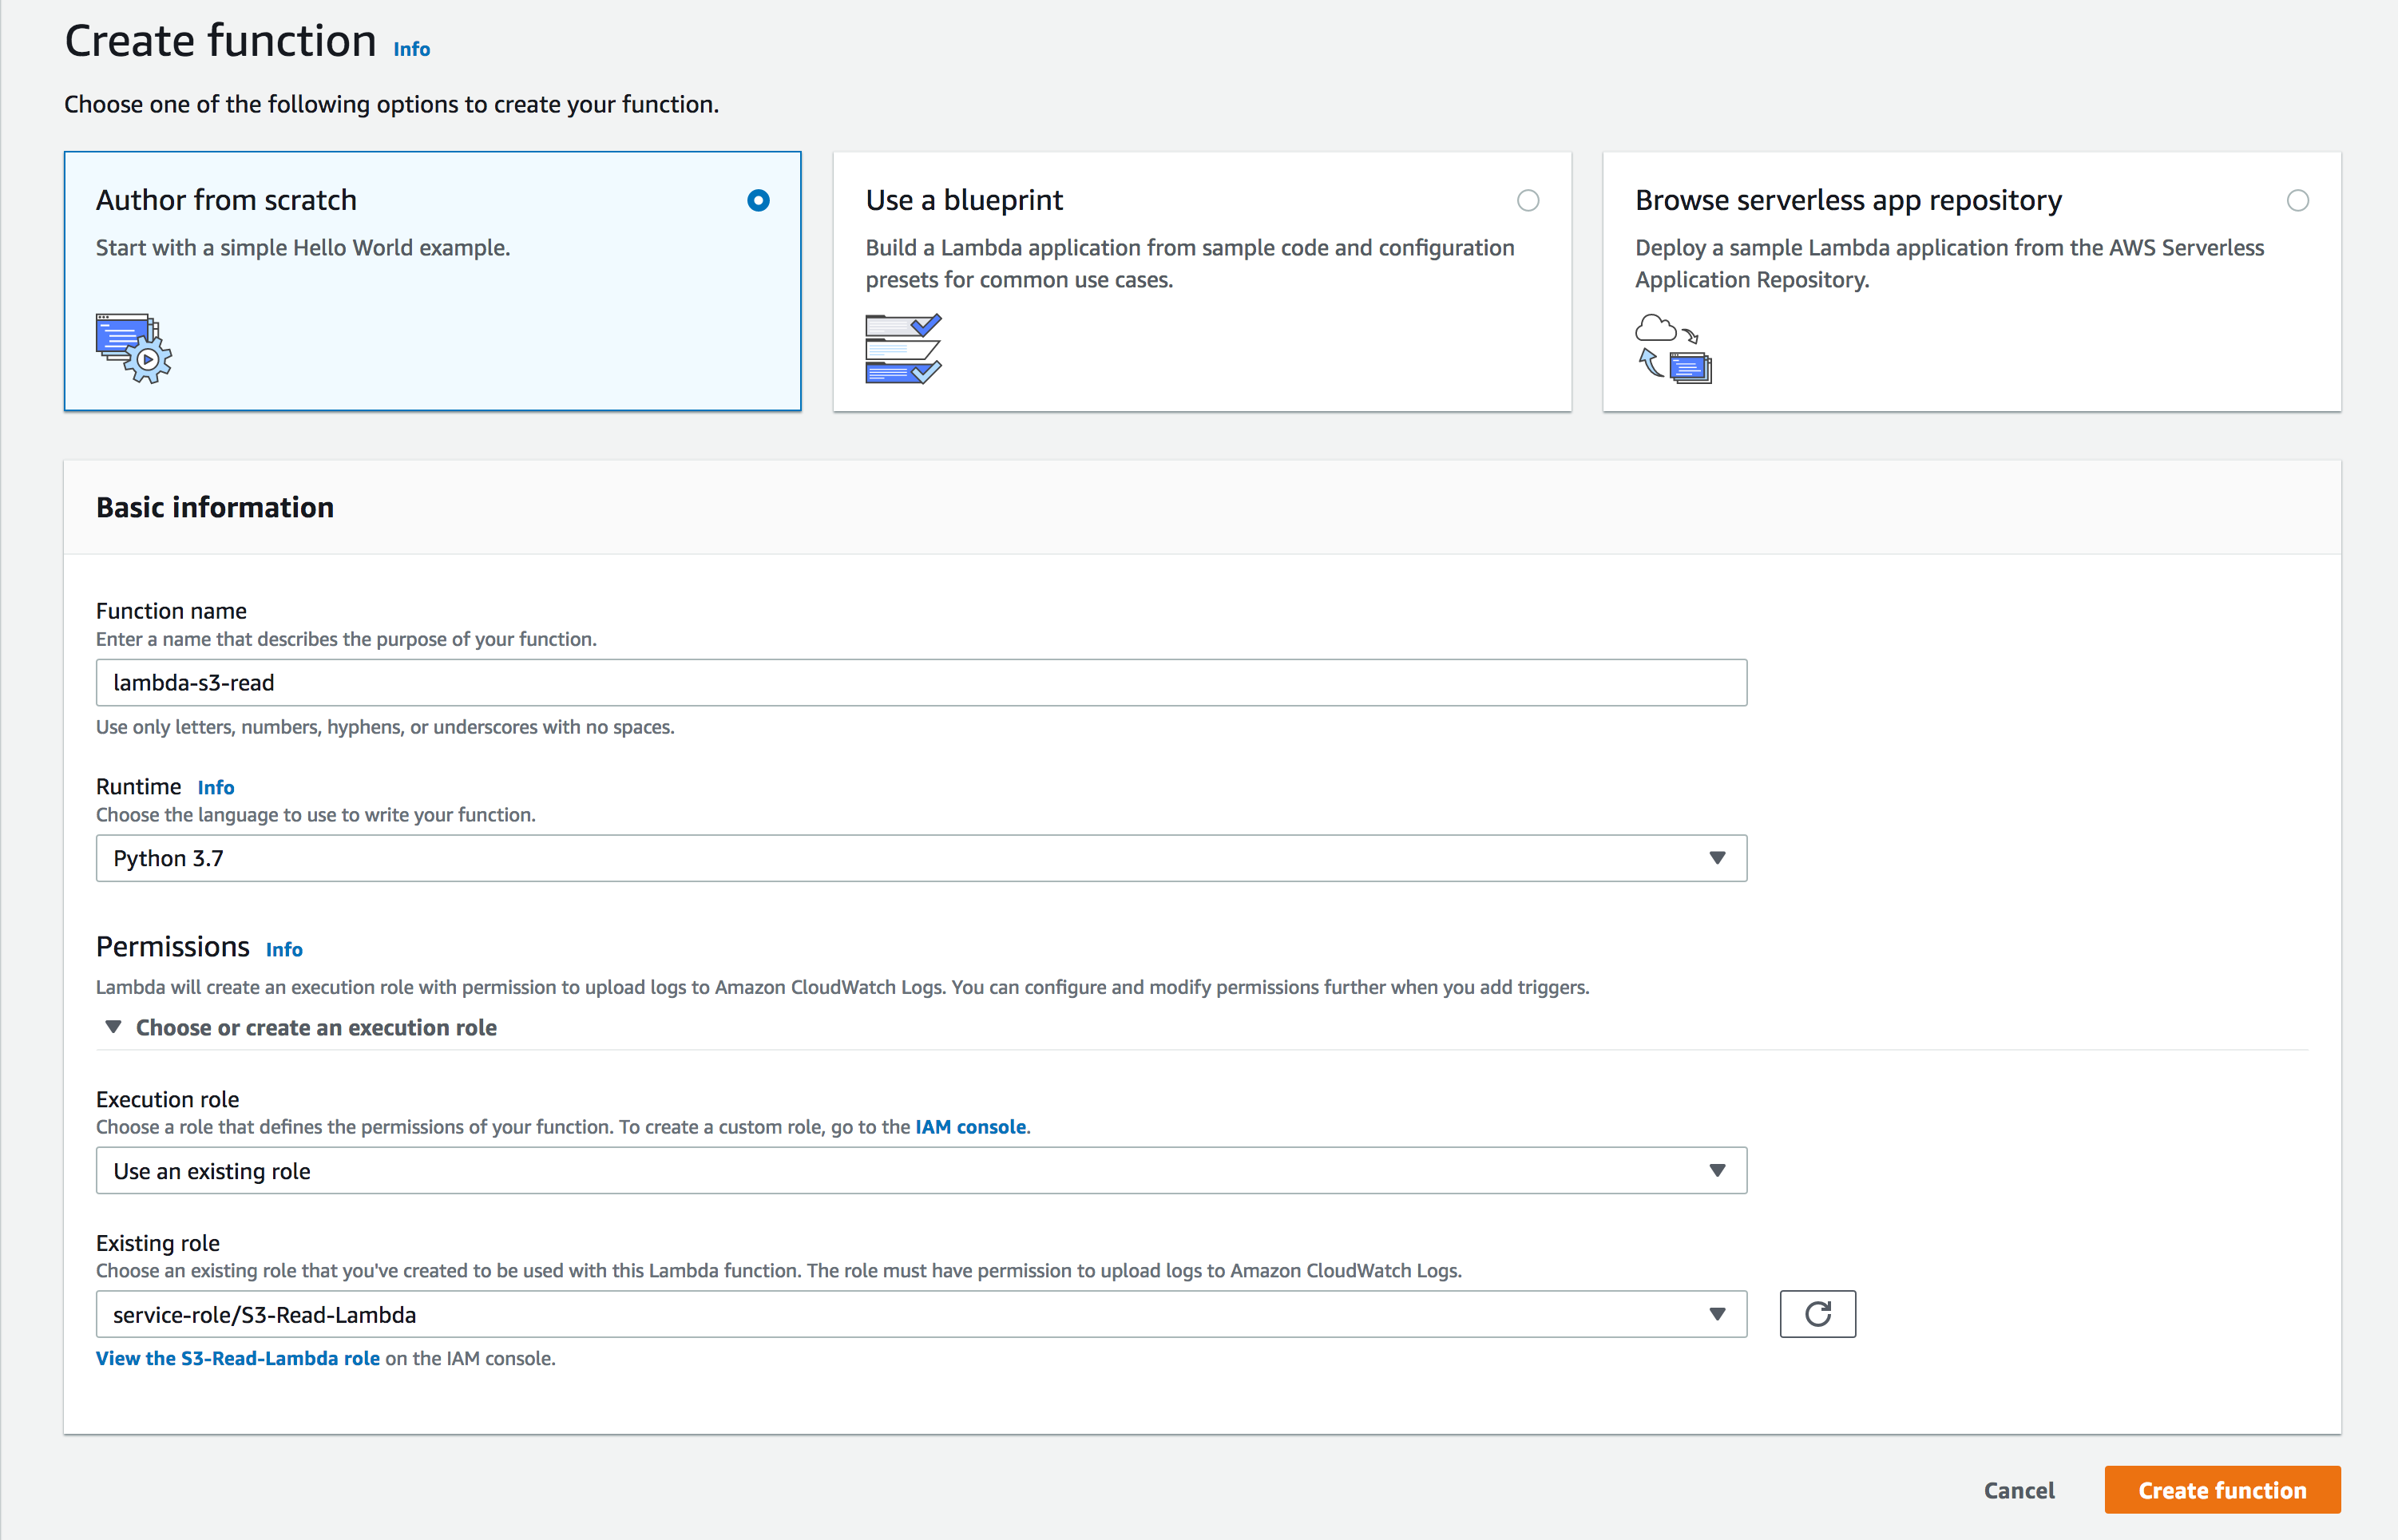
- Permissions: You can choose an existing IAM role or Create a new role with basic Lambda permissions. You also have the option to create a new user role and extend permission to other services as well.
- Add triggers: Scroll down to choose CloudWatch Logs. Any log file added, will be sent to Site24x7 by the Lambda Function.
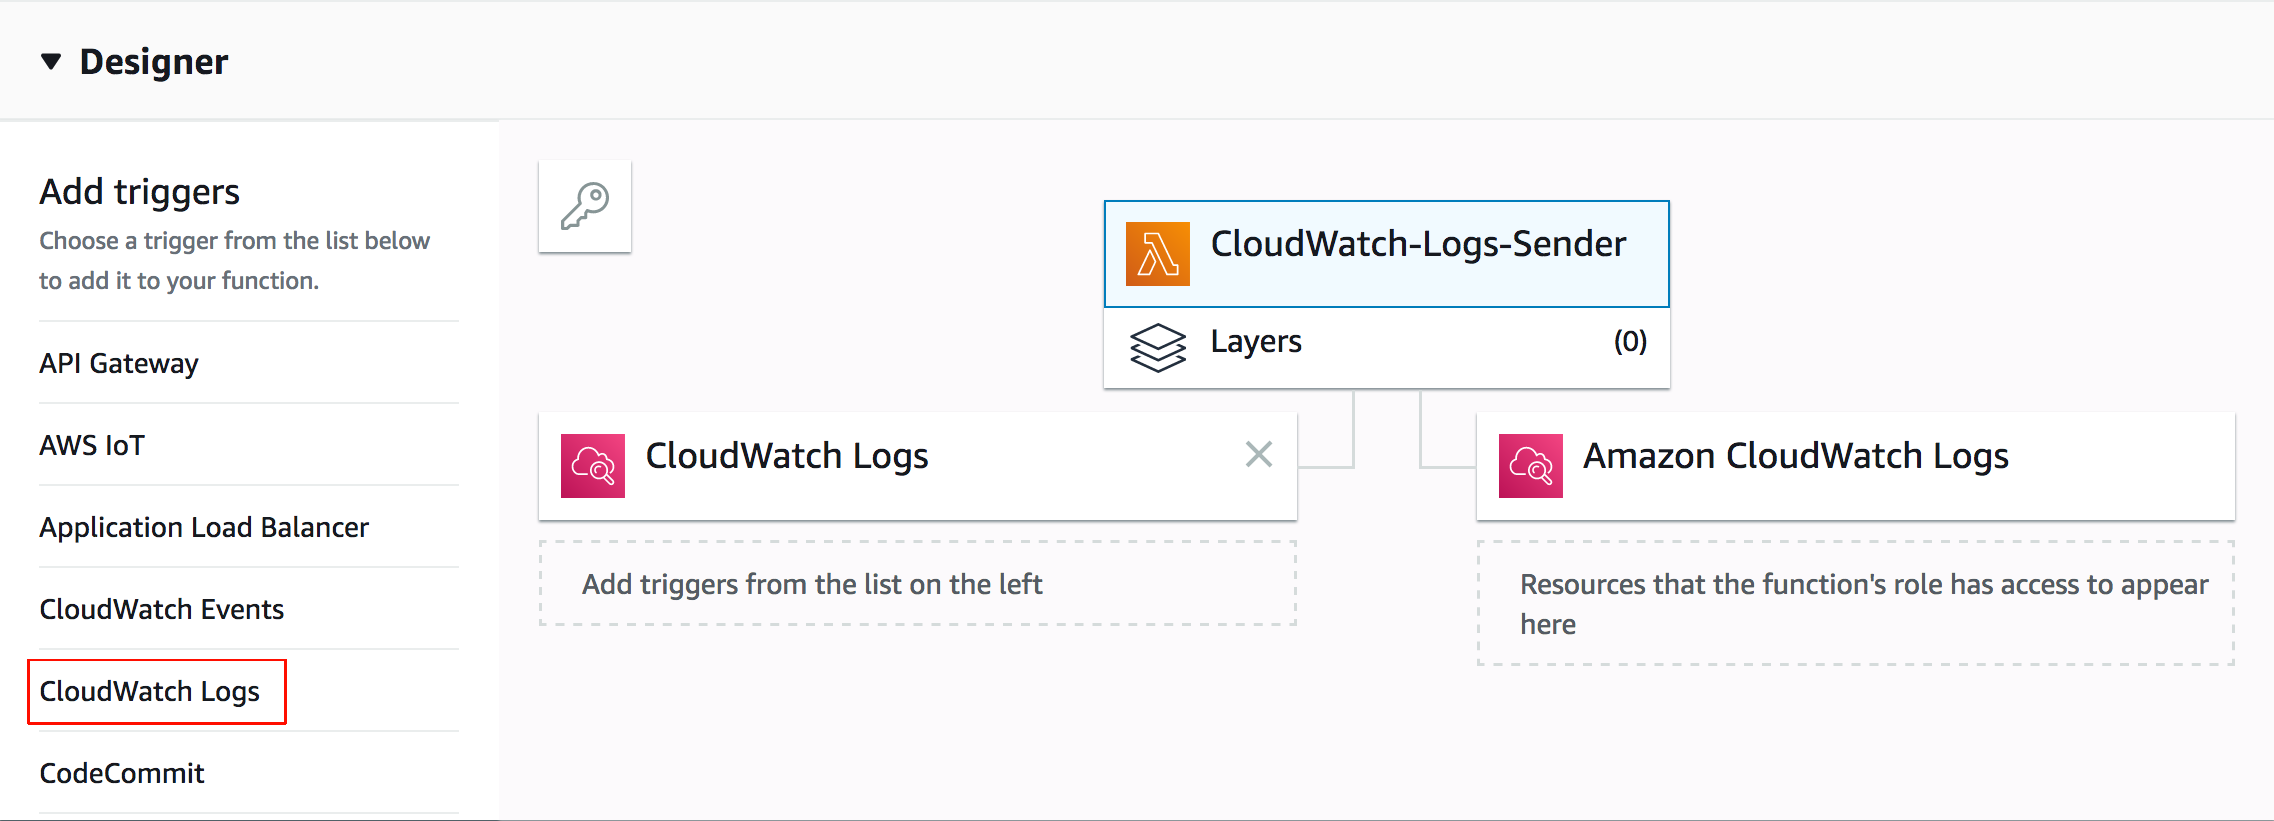
- Configure Triggers
- Log group: Select the CloudWatch log group that acts as the source. Any event triggered in the selected group will call the Lambda Function.
- Filter name: Choose a name for your filter.
- Select the check box for enable trigger and click Add.
- In the window that opens, click on the Lambda Function as shown:
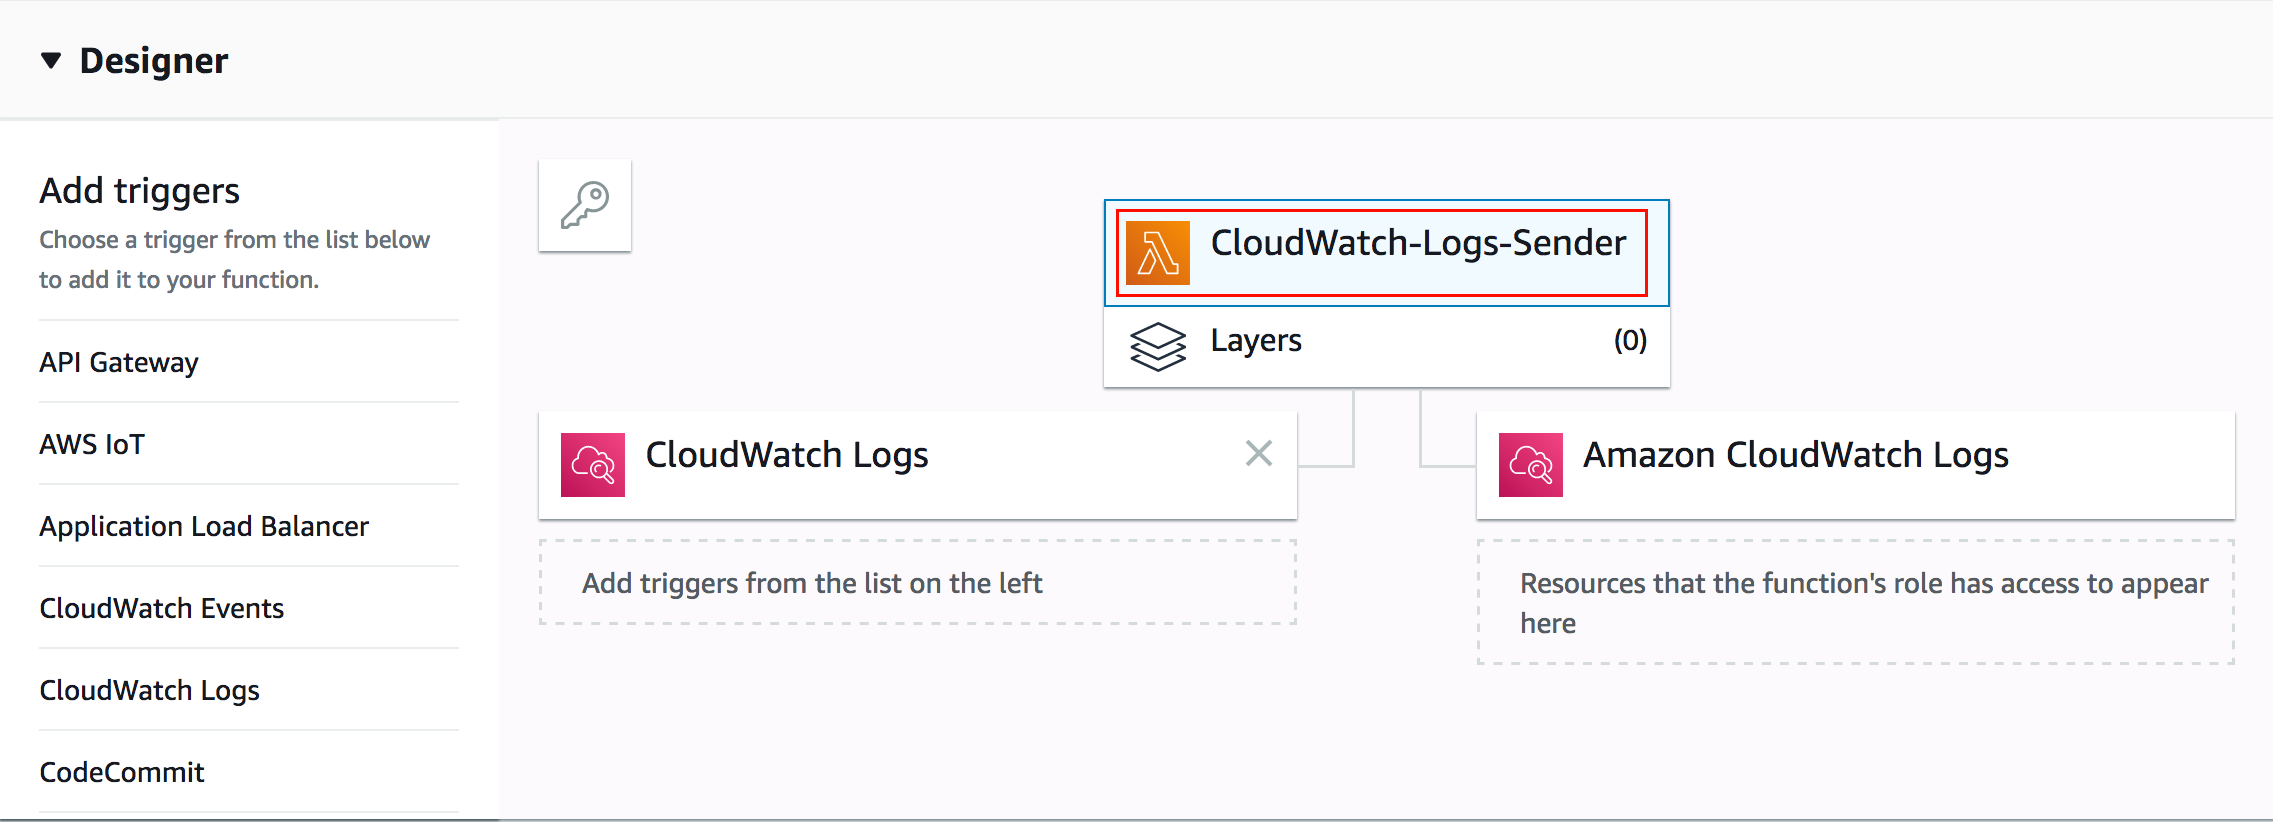
- Scroll to the editor, and place the code provided in the link below:
-
- After entering the code, navigate to the Site24x7 web client, select Admin > Applogs > Log Profile, then select the created Log Profile, and copy the code that appears on the screen as the input for the variable logTypeConfig under the field Environment variables.

- After entering the code, navigate to the Site24x7 web client, select Admin > Applogs > Log Profile, then select the created Log Profile, and copy the code that appears on the screen as the input for the variable logTypeConfig under the field Environment variables.
- Paste this code under Environment Variable with the field name logTypeConfig in the AWS console.
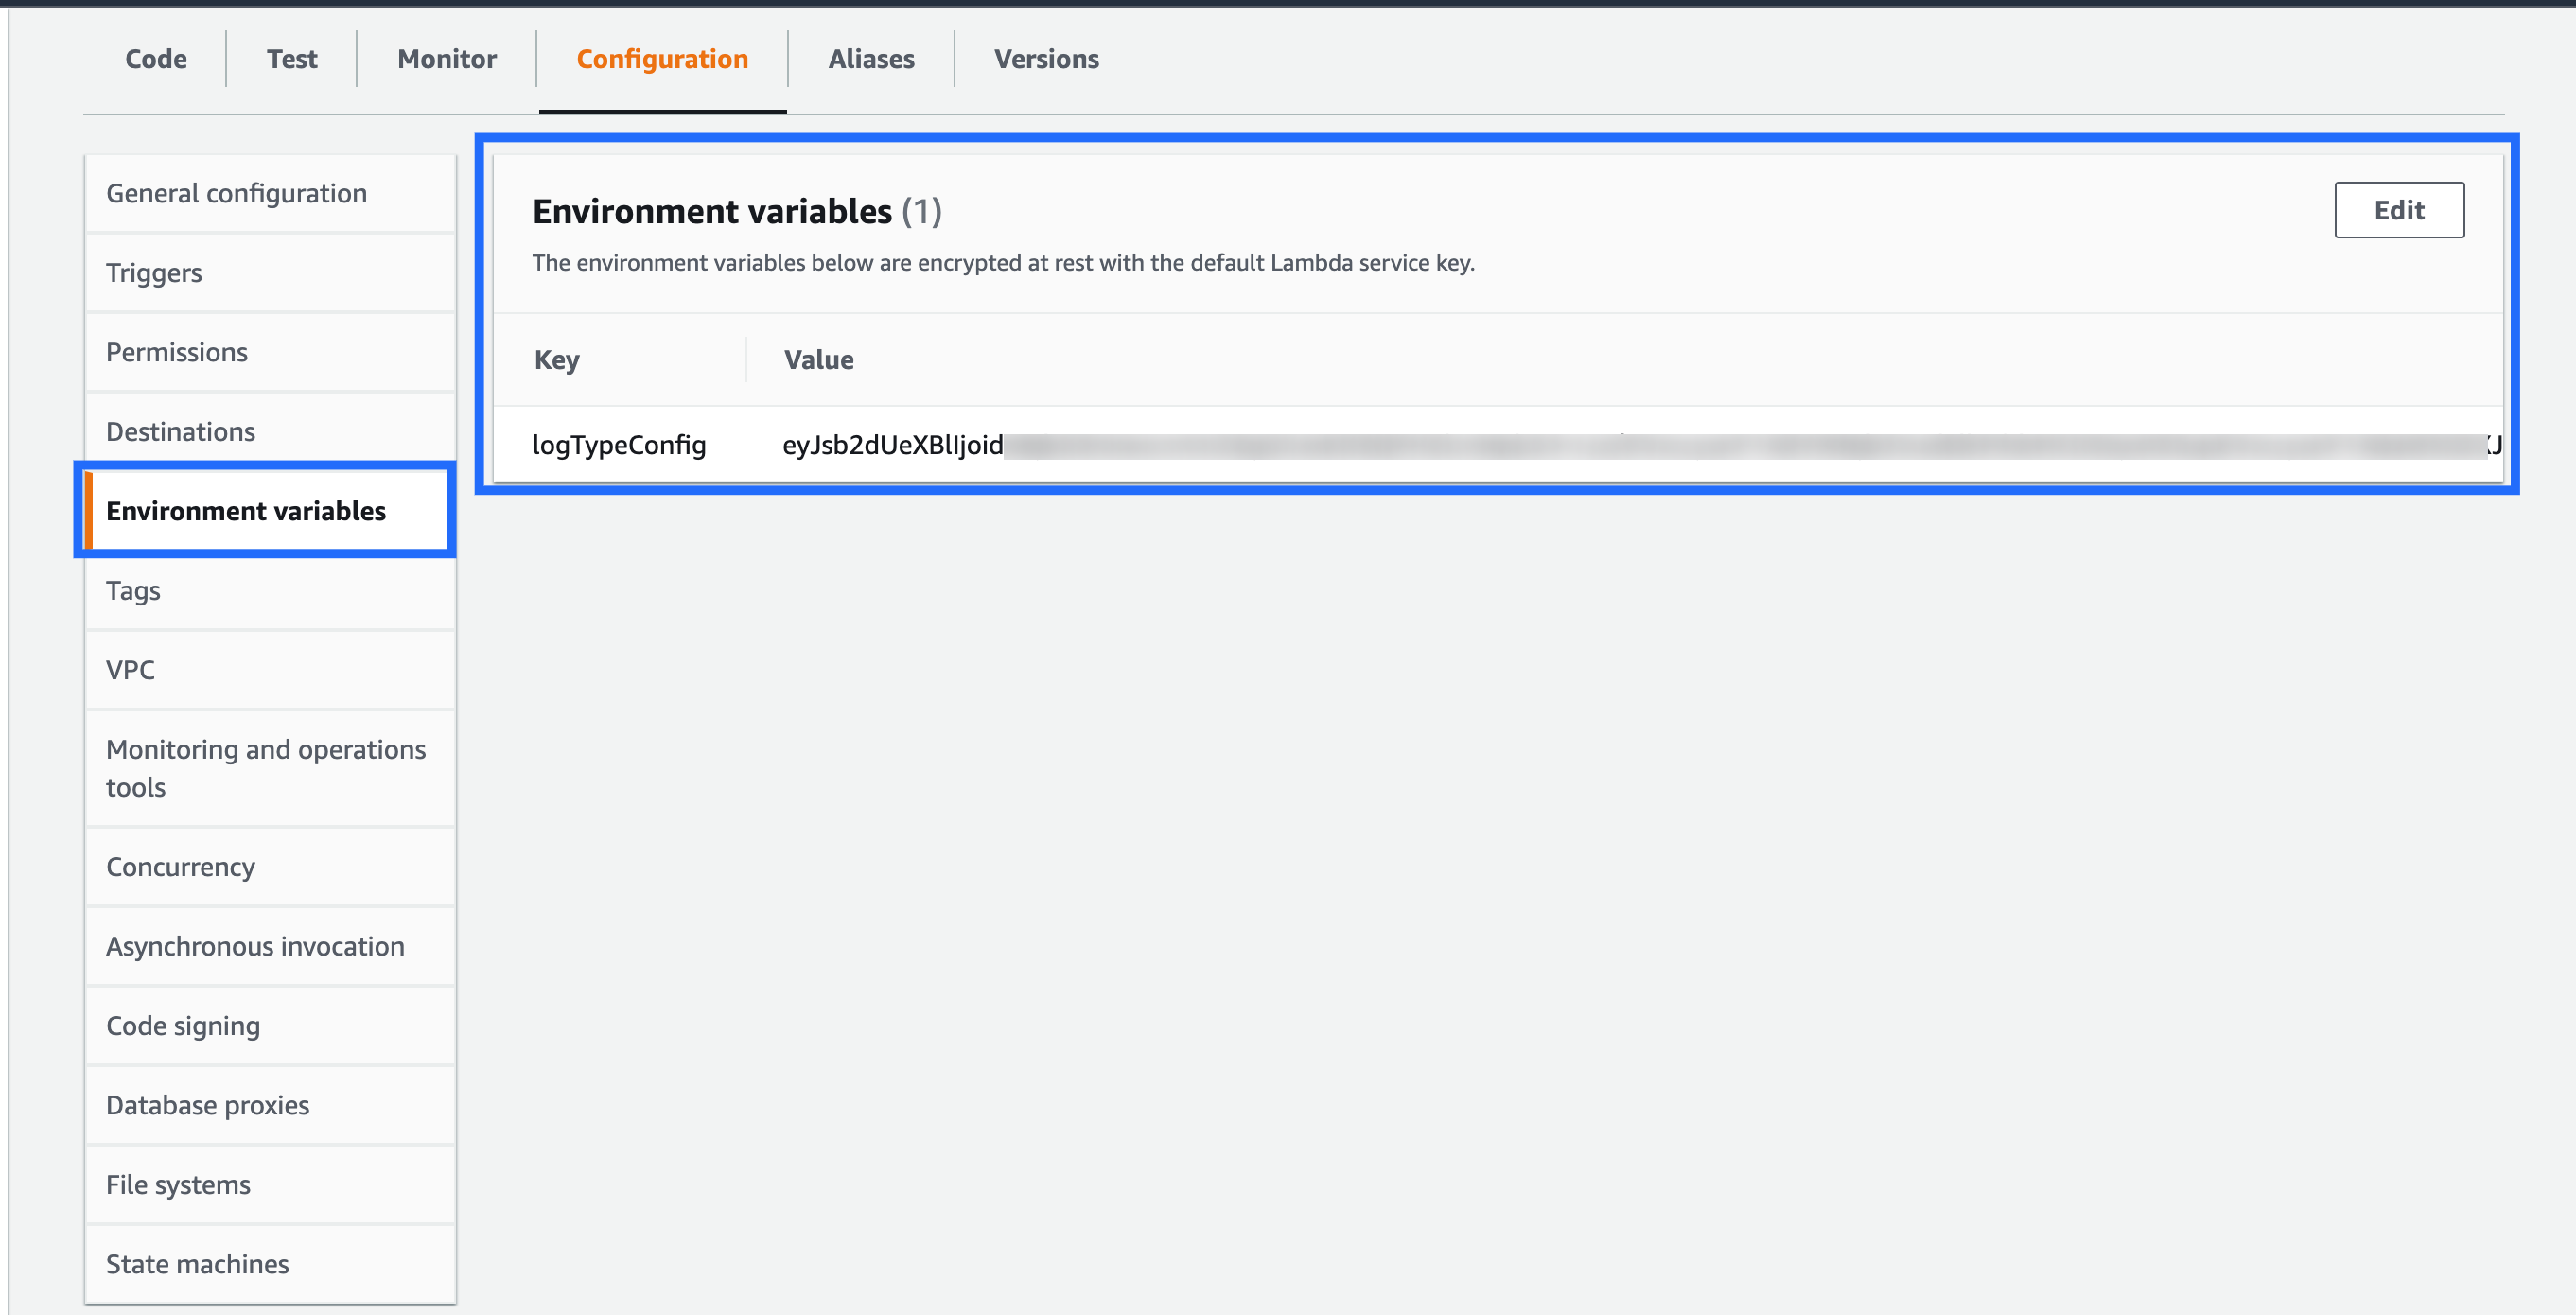
3. View AWS API Gateway Access Logs
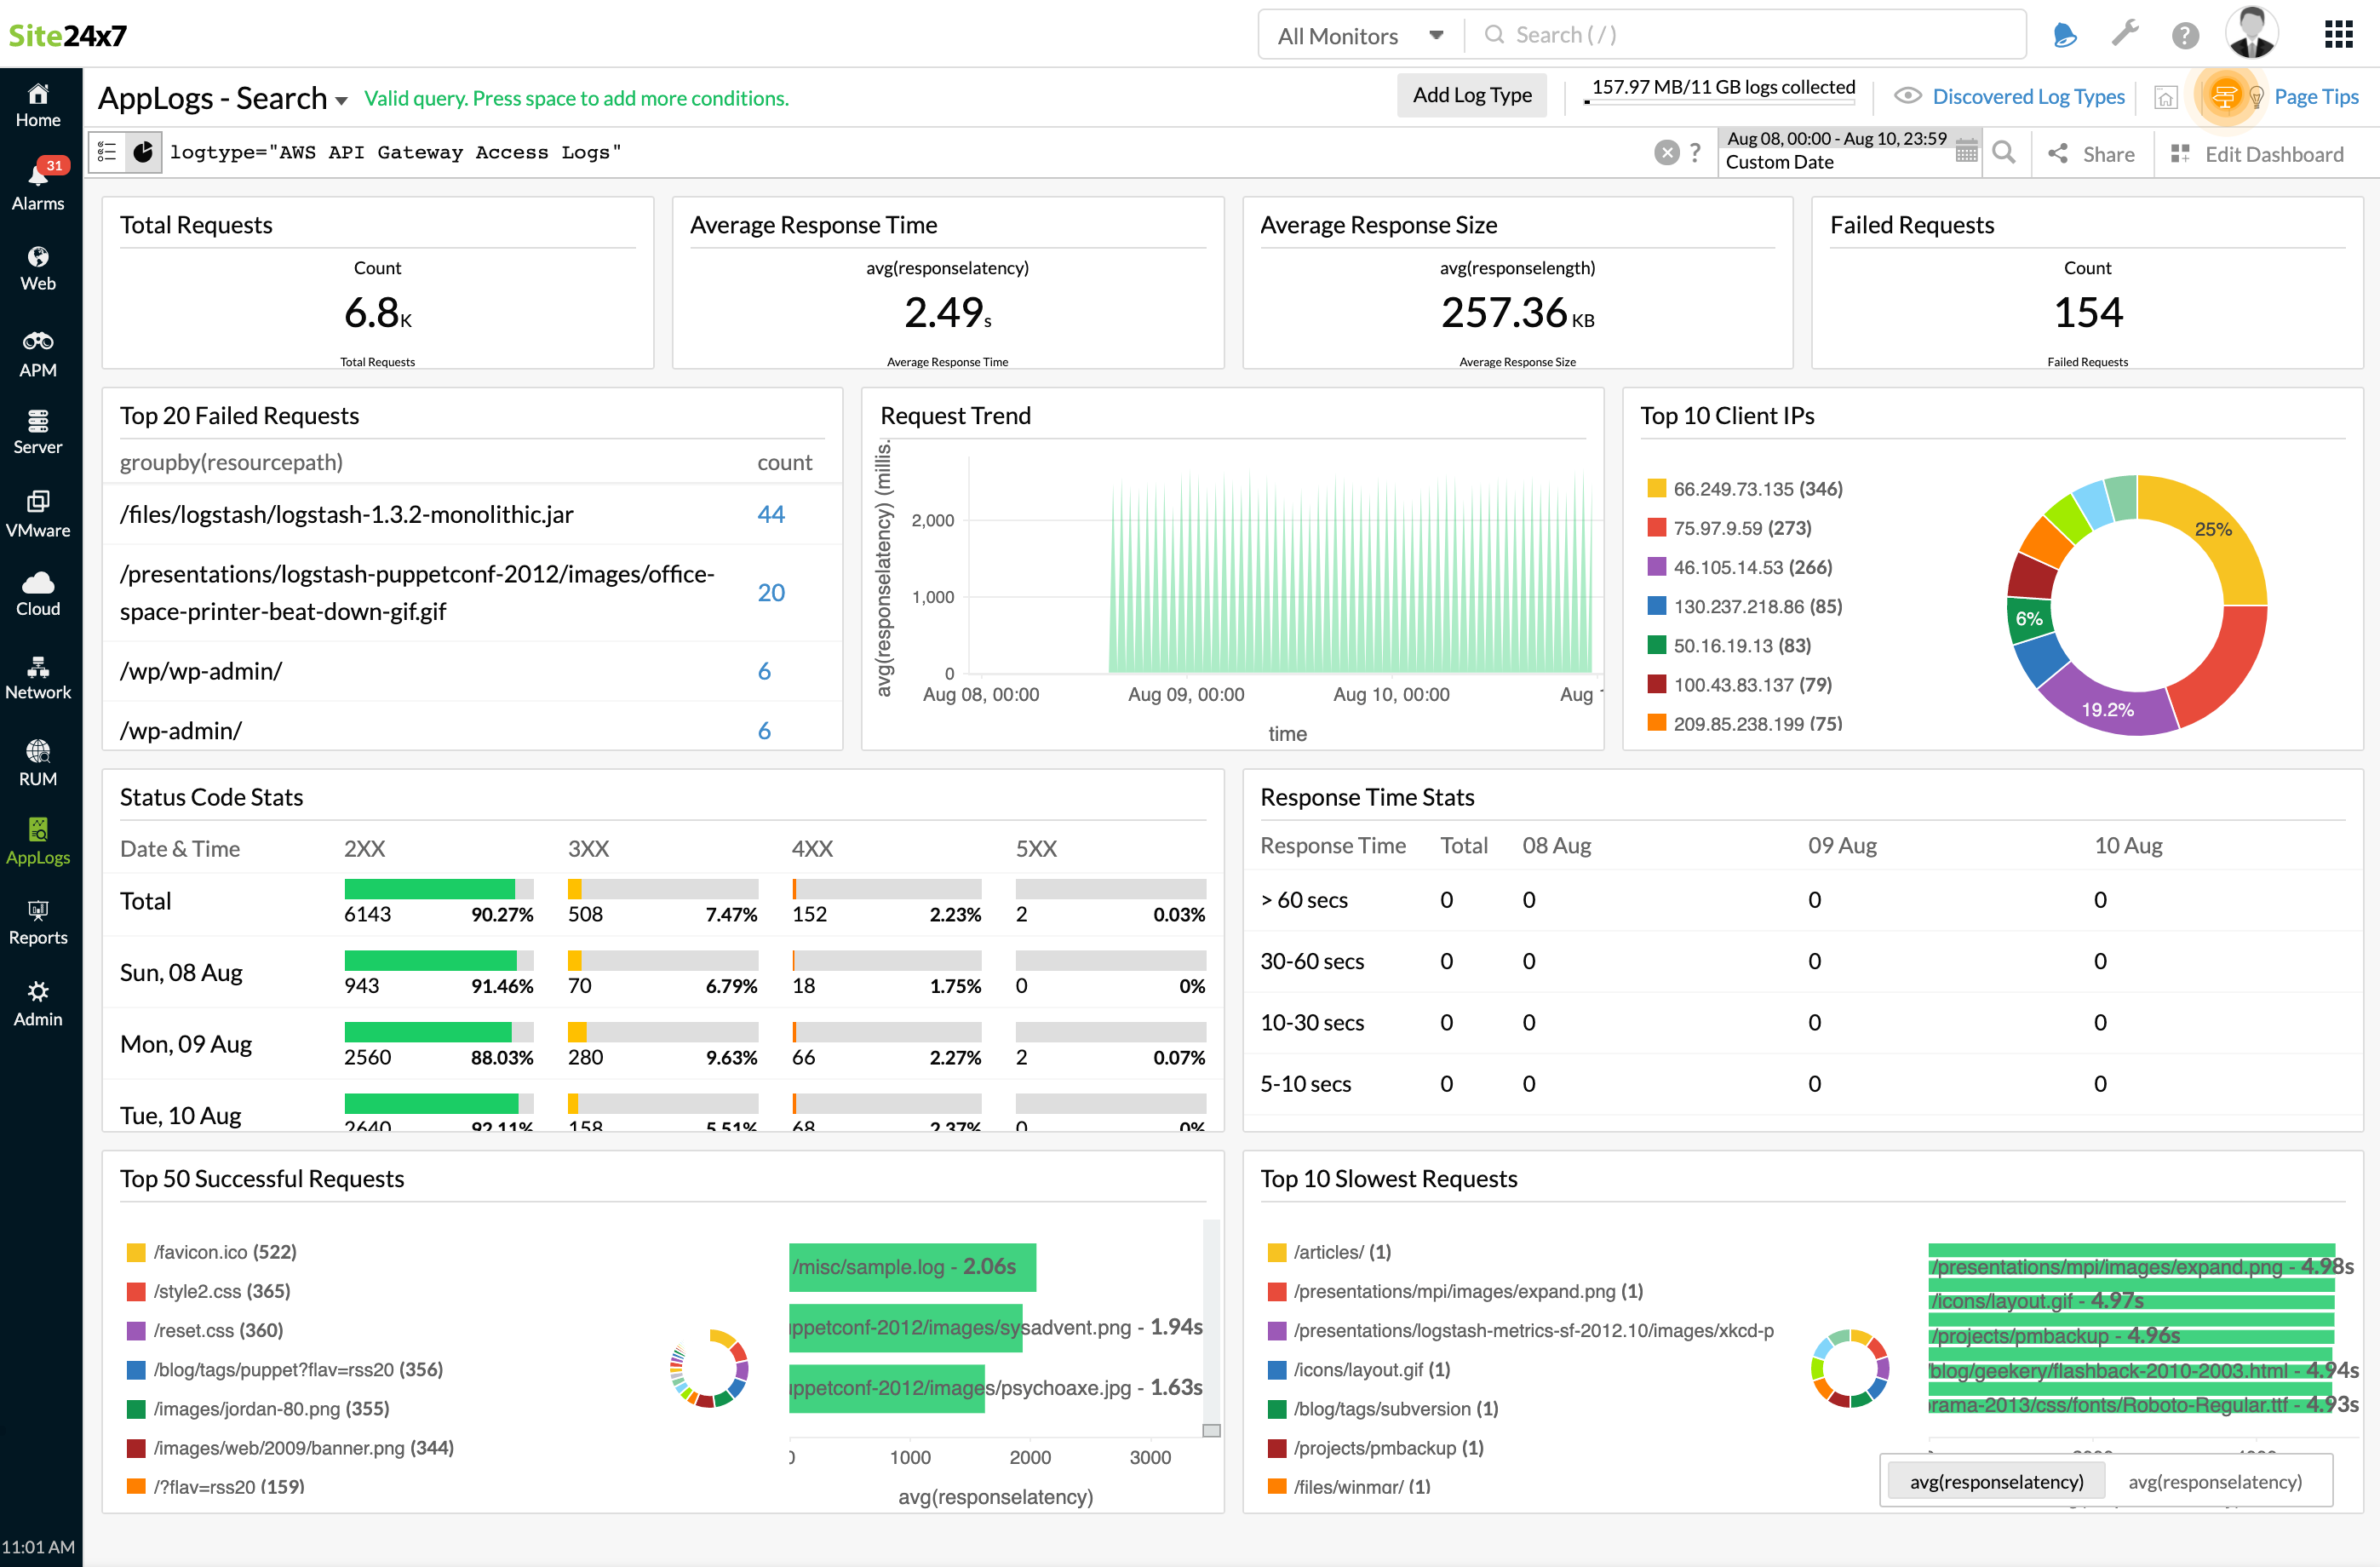
Site24x7 AppLogs creates an exclusive dashboard for every Log Type, and shows a few widgets by default. Here's a list of the widgets available for the AWS API Gateway Access Dashboard:
- Total Requests
- Average Response Time
- Average Response Size
- Failed Requests
- Top 20 Failed Requests
- Request Trend
- Top 10 Client IPs
- Status Code Stats
- Response Time Stats
- Top 50 Successful Requests
- Top 10 Slowest Requests
