Performance Metrics of Zerto Analytics Monitor
Zerto Analytics is a parent-level monitoring solution that provides a consolidated view of collection of Zerto deployments across distributed sites.
The performance metrics provide insights into virtual protection groups (VPGs), replication health, alert counts, availability status, and recovery point objective (RPO) compliance.
Once you have added a Zerto Analytics monitor you can view the configured Zerto monitor in Site24x7:
- Log in to Site24x7 and navigate to Server > Backup Monitoring > Zerto Analytics.
- Select the desired server to view the metrics.
Performance metrics of a Zerto Analytics monitor
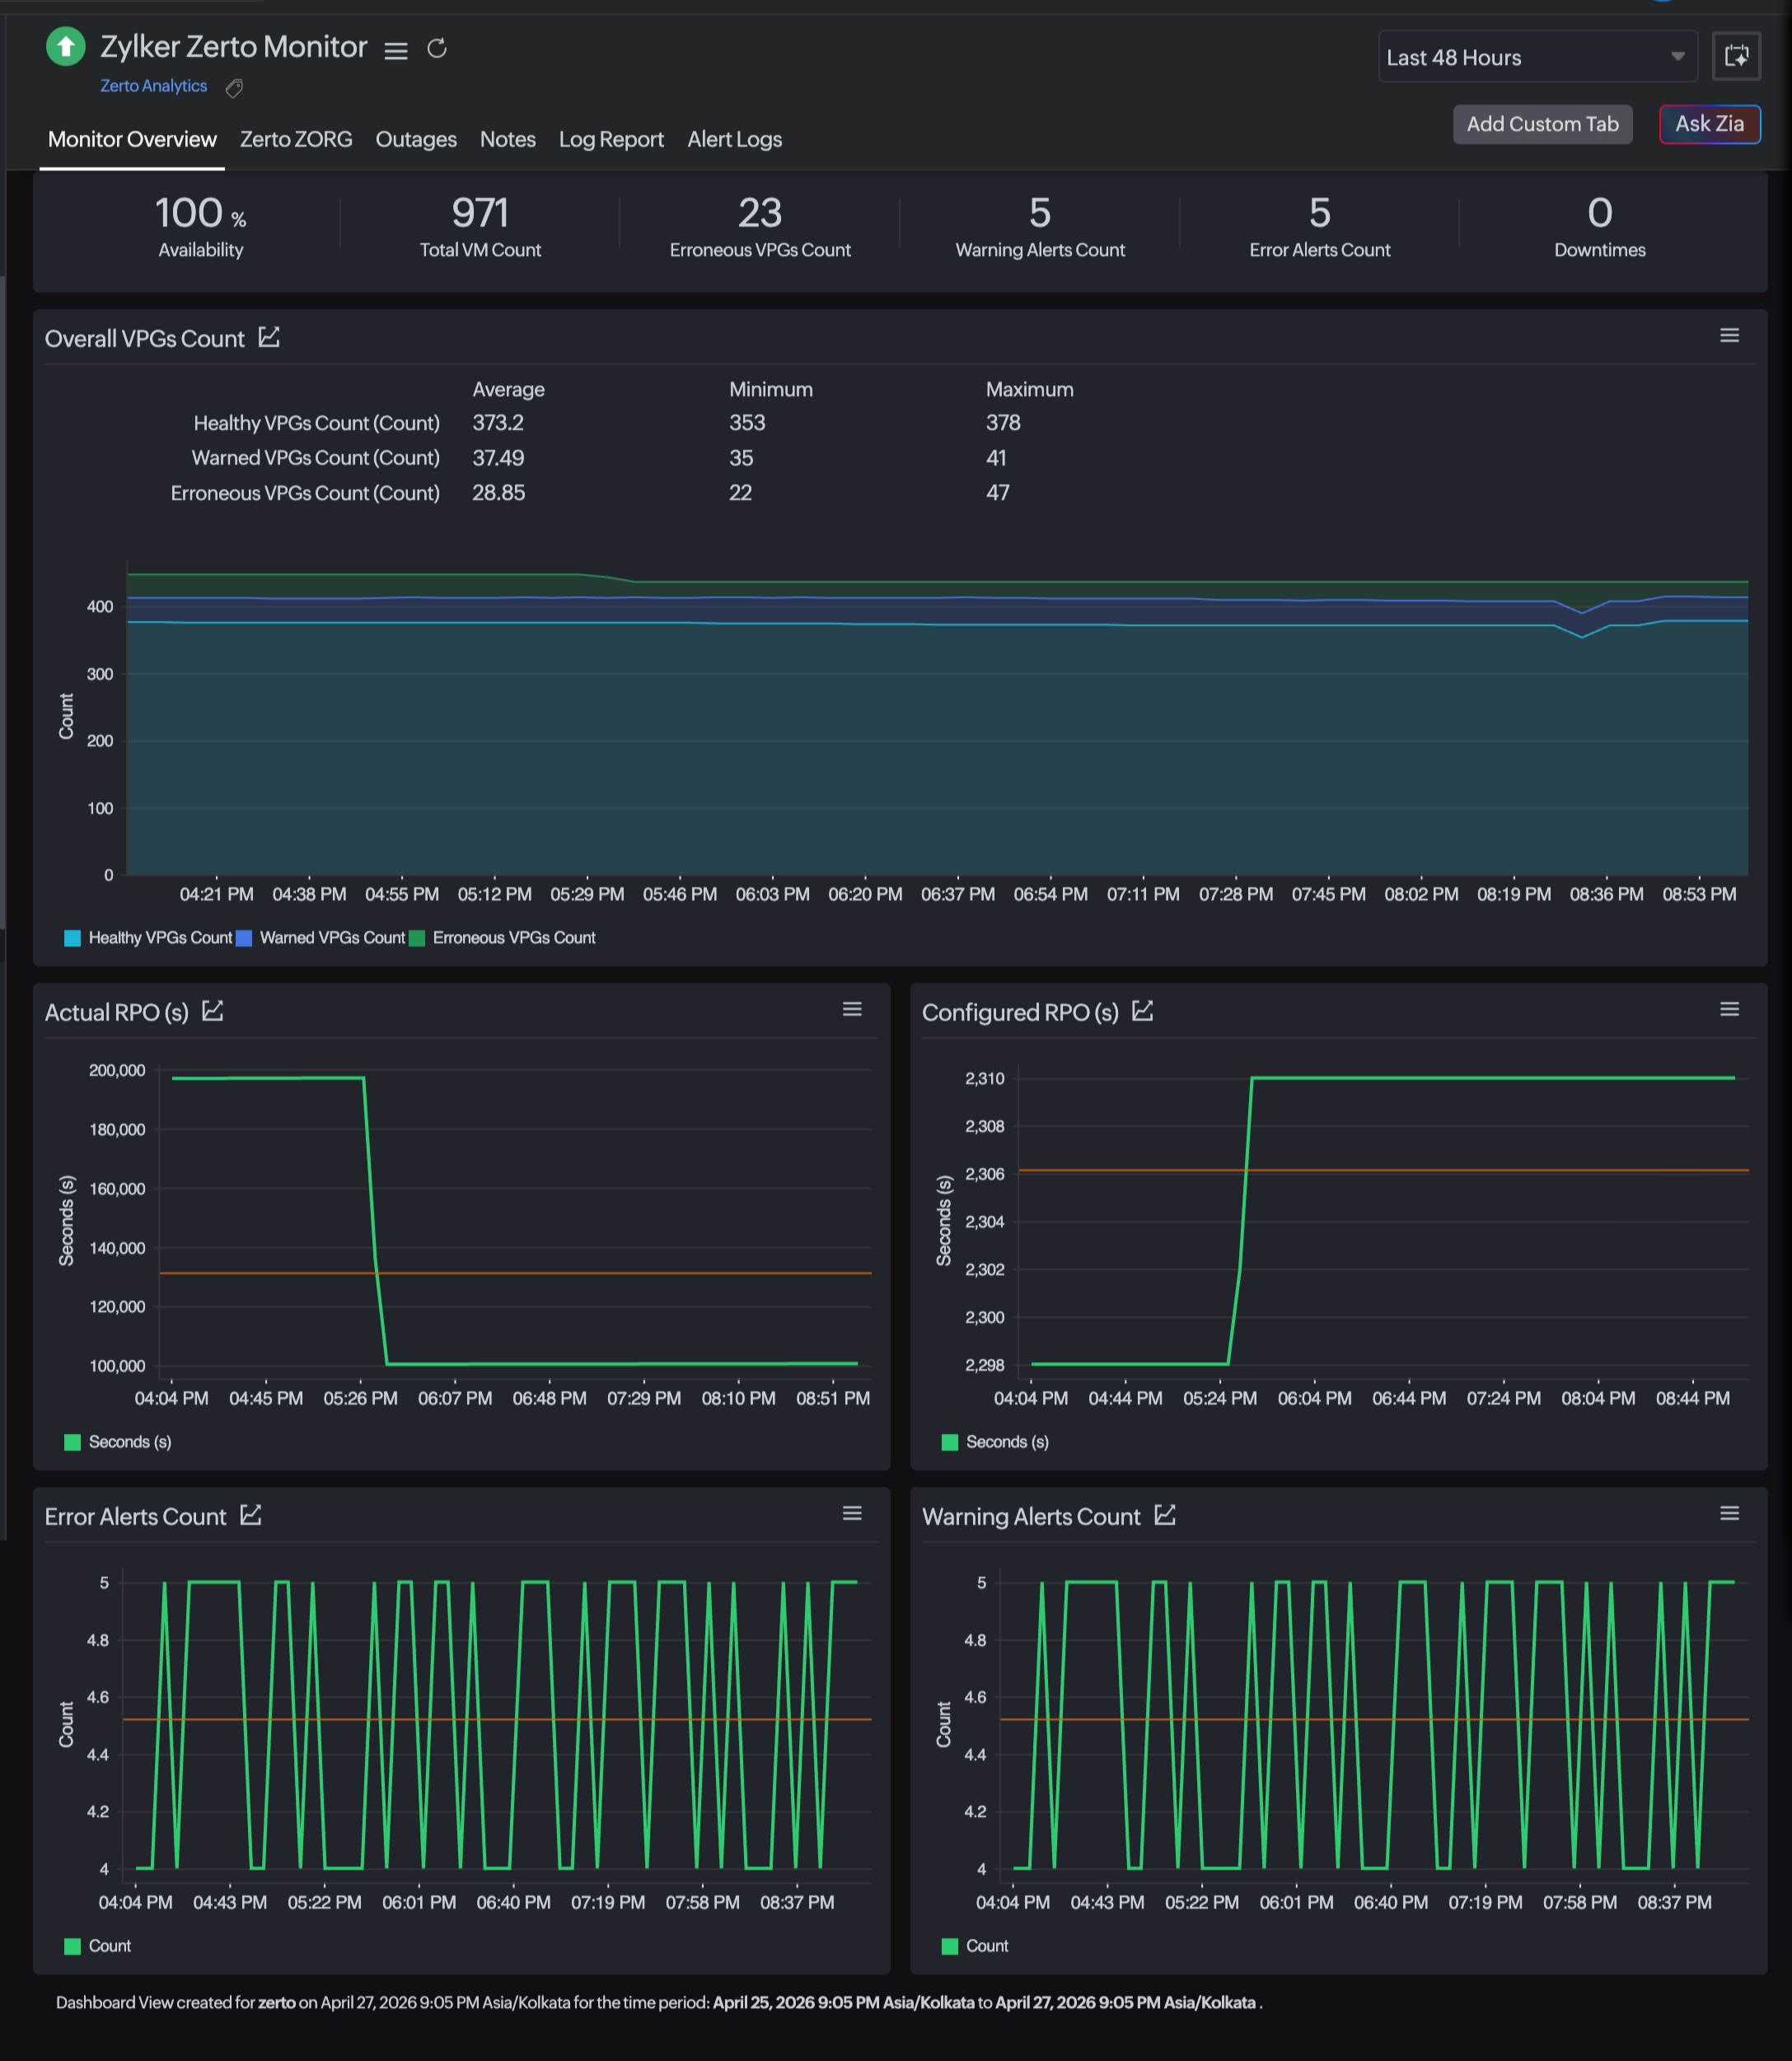
Monitor Overview: This tab provides a birds-eye view into VPGs, alert counts, availability status, and RPO compliance.
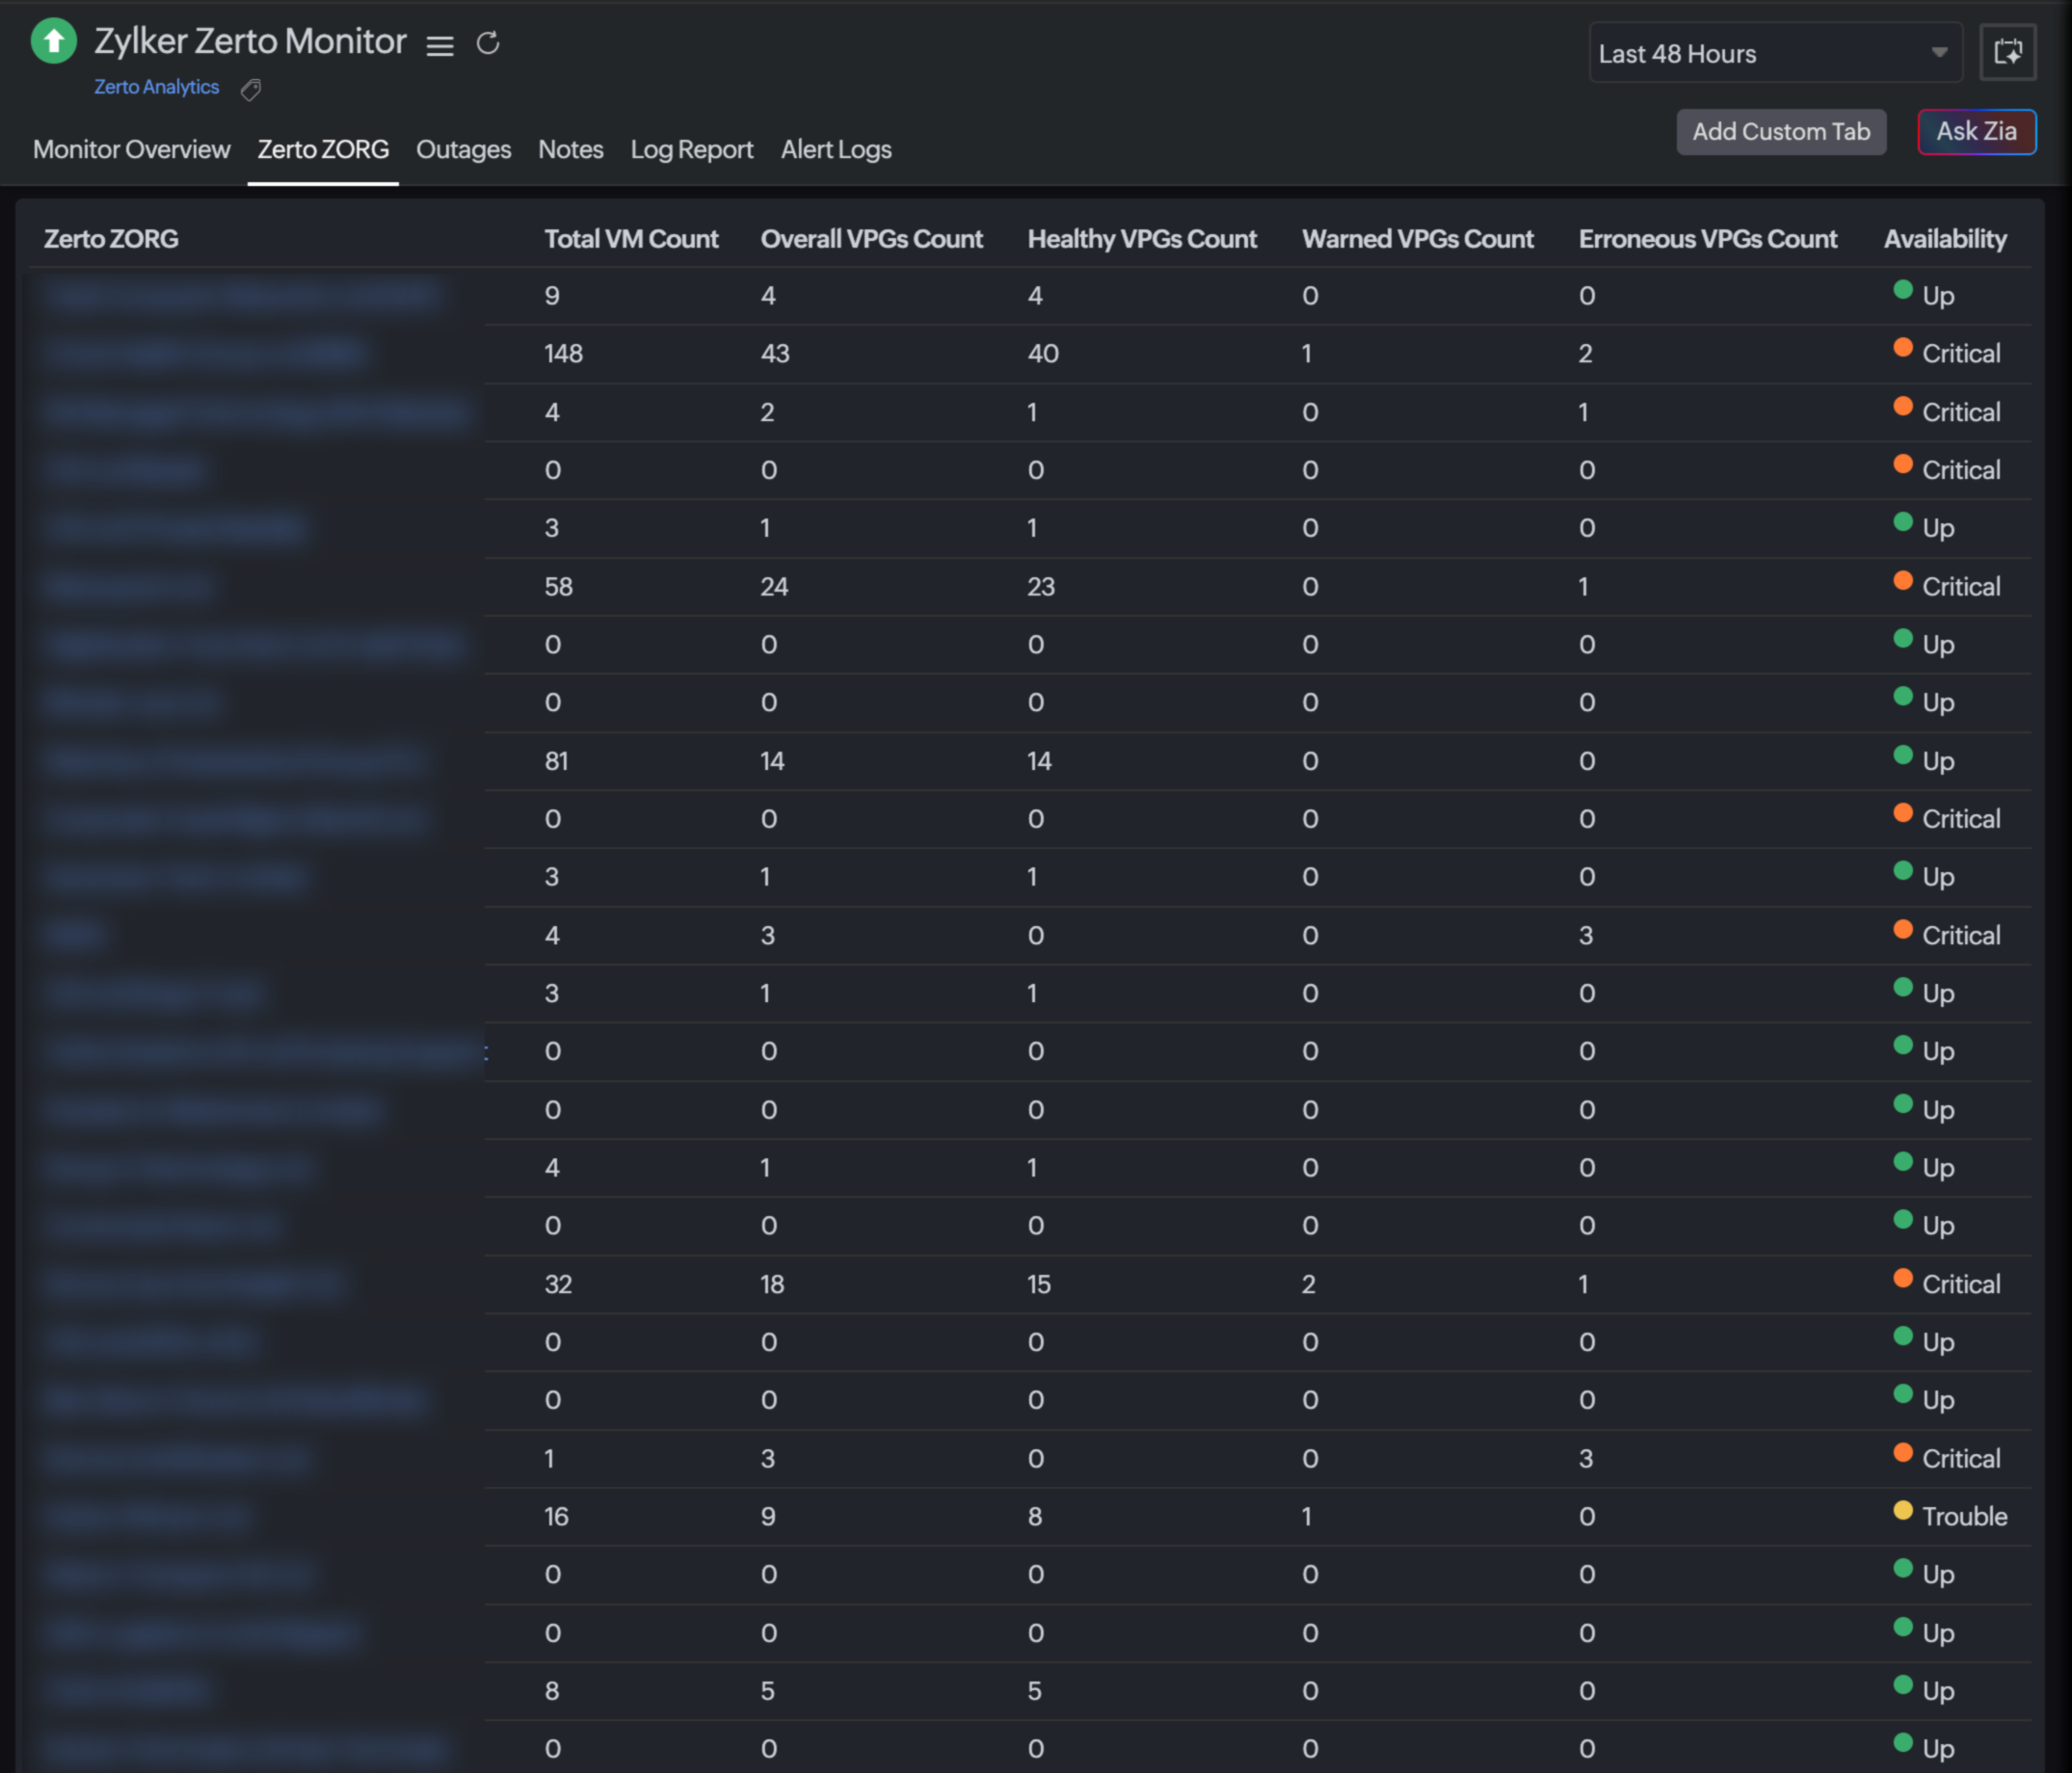
Zerto ZORG: This tab provides organization-level visibility into separate Zerto deployments connected under this single Zerto Analytics monitor.
Monitor overview
| Metrics | Description | Units |
|---|---|---|
| Availability | Displays the current uptime status of the Zerto Analytics monitor. | Percentage |
| Total VM Count | Displays the total number of protected VMs across all monitored Zerto instances. | Count |
| Erroneous VPGs Count | Displays the number of VPGs currently in error state. | Count |
| Warning Alerts Count | Displays the total number of warning-level alerts triggered. | Count |
| Error Alerts Count | Displays the total number of critical or error alerts triggered. | Count |
| Downtimes | Displays the number of detected downtime incidents during the selected time range. | Count |
| Overall VPGs Count | ||
| Healthy VPGs Count | Displays the average, minimum, and maximum number of VPGs operating without replication issues within the selected time period. | Count |
| Warned VPGs Count | Displays the average, minimum and maximum number of VPGs in warning state recorded within the selected time period. | Count |
| Erroneous VPGs Count (Graph) | Displays the average, minimum, and maximum number of VPGs in critical or error state affecting protection within the selected time period. | Count |
| Actual RPO | Displays a graph of the real-time RPO being achieved by replication. Reflects potential data loss window. | Seconds |
| Configured RPO | Displays a graph of the target RPO value configured for the VPGs. Used for compliance comparison. | Seconds |
| Error Alerts Count | Displays a graph of the number of critical error alerts triggered during the selected time period. Used to identify RPO breaches. | Count |
| Warning Alerts Count | Displays a graph of the number of warning level alerts triggered during the selected time period. Used to identify performance degradation. | Count |
Zerto ZORG
| Metrics | Description | Unit |
|---|---|---|
| Zerto ZORG | Displays the name of the assigned Zerto organization. | Text |
| Total VM Count | Displays the total number of VMs protected under the specific Zerto organization. | Count |
| Overall VPGs Count | Displays the total number of VPGs configured in the organization. | Count |
| Healthy VPGs Count | Displays the total number of VPGs currently operating without replication or protection issues. | Count |
| Warned VPGs Count | Displays the total number of VPGs in warning state due to minor issues or resource thresholds. | Count |
| Erroneous VPGs Count | Displays the total number of VPGs in critical or error state. | Count |
| Availability | Displays the overall health status of the Zerto organization monitor (e.g., green: Up, yellow: Trouble, red: Down). |
Performance metrics of a Zerto ZORG monitor
Zerto ZORG provides detailed, organization-level monitoring and delivers a consolidated view of Zerto frameworks and deployments across distributed sites that are connected through Zerto Analytics.
To view the configured Zerto ZORG monitor in Site24x7, follow either step a or step b below, which will lead to the same overview:
- Log in to Site24x7.
- Navigate to Server > Backup Monitoring > Zerto ZORG.
- Alternatively, you can choose Server > Backup Monitoring > Zerto Analytics.
- Select the desired Zerto Analytics monitor.
- Click the Zerto ZORG tab to view the particular Zerto-monitored Zerto organization list.
- Select the desired monitor to view the metrics.
The following metrics will be available for the monitor:
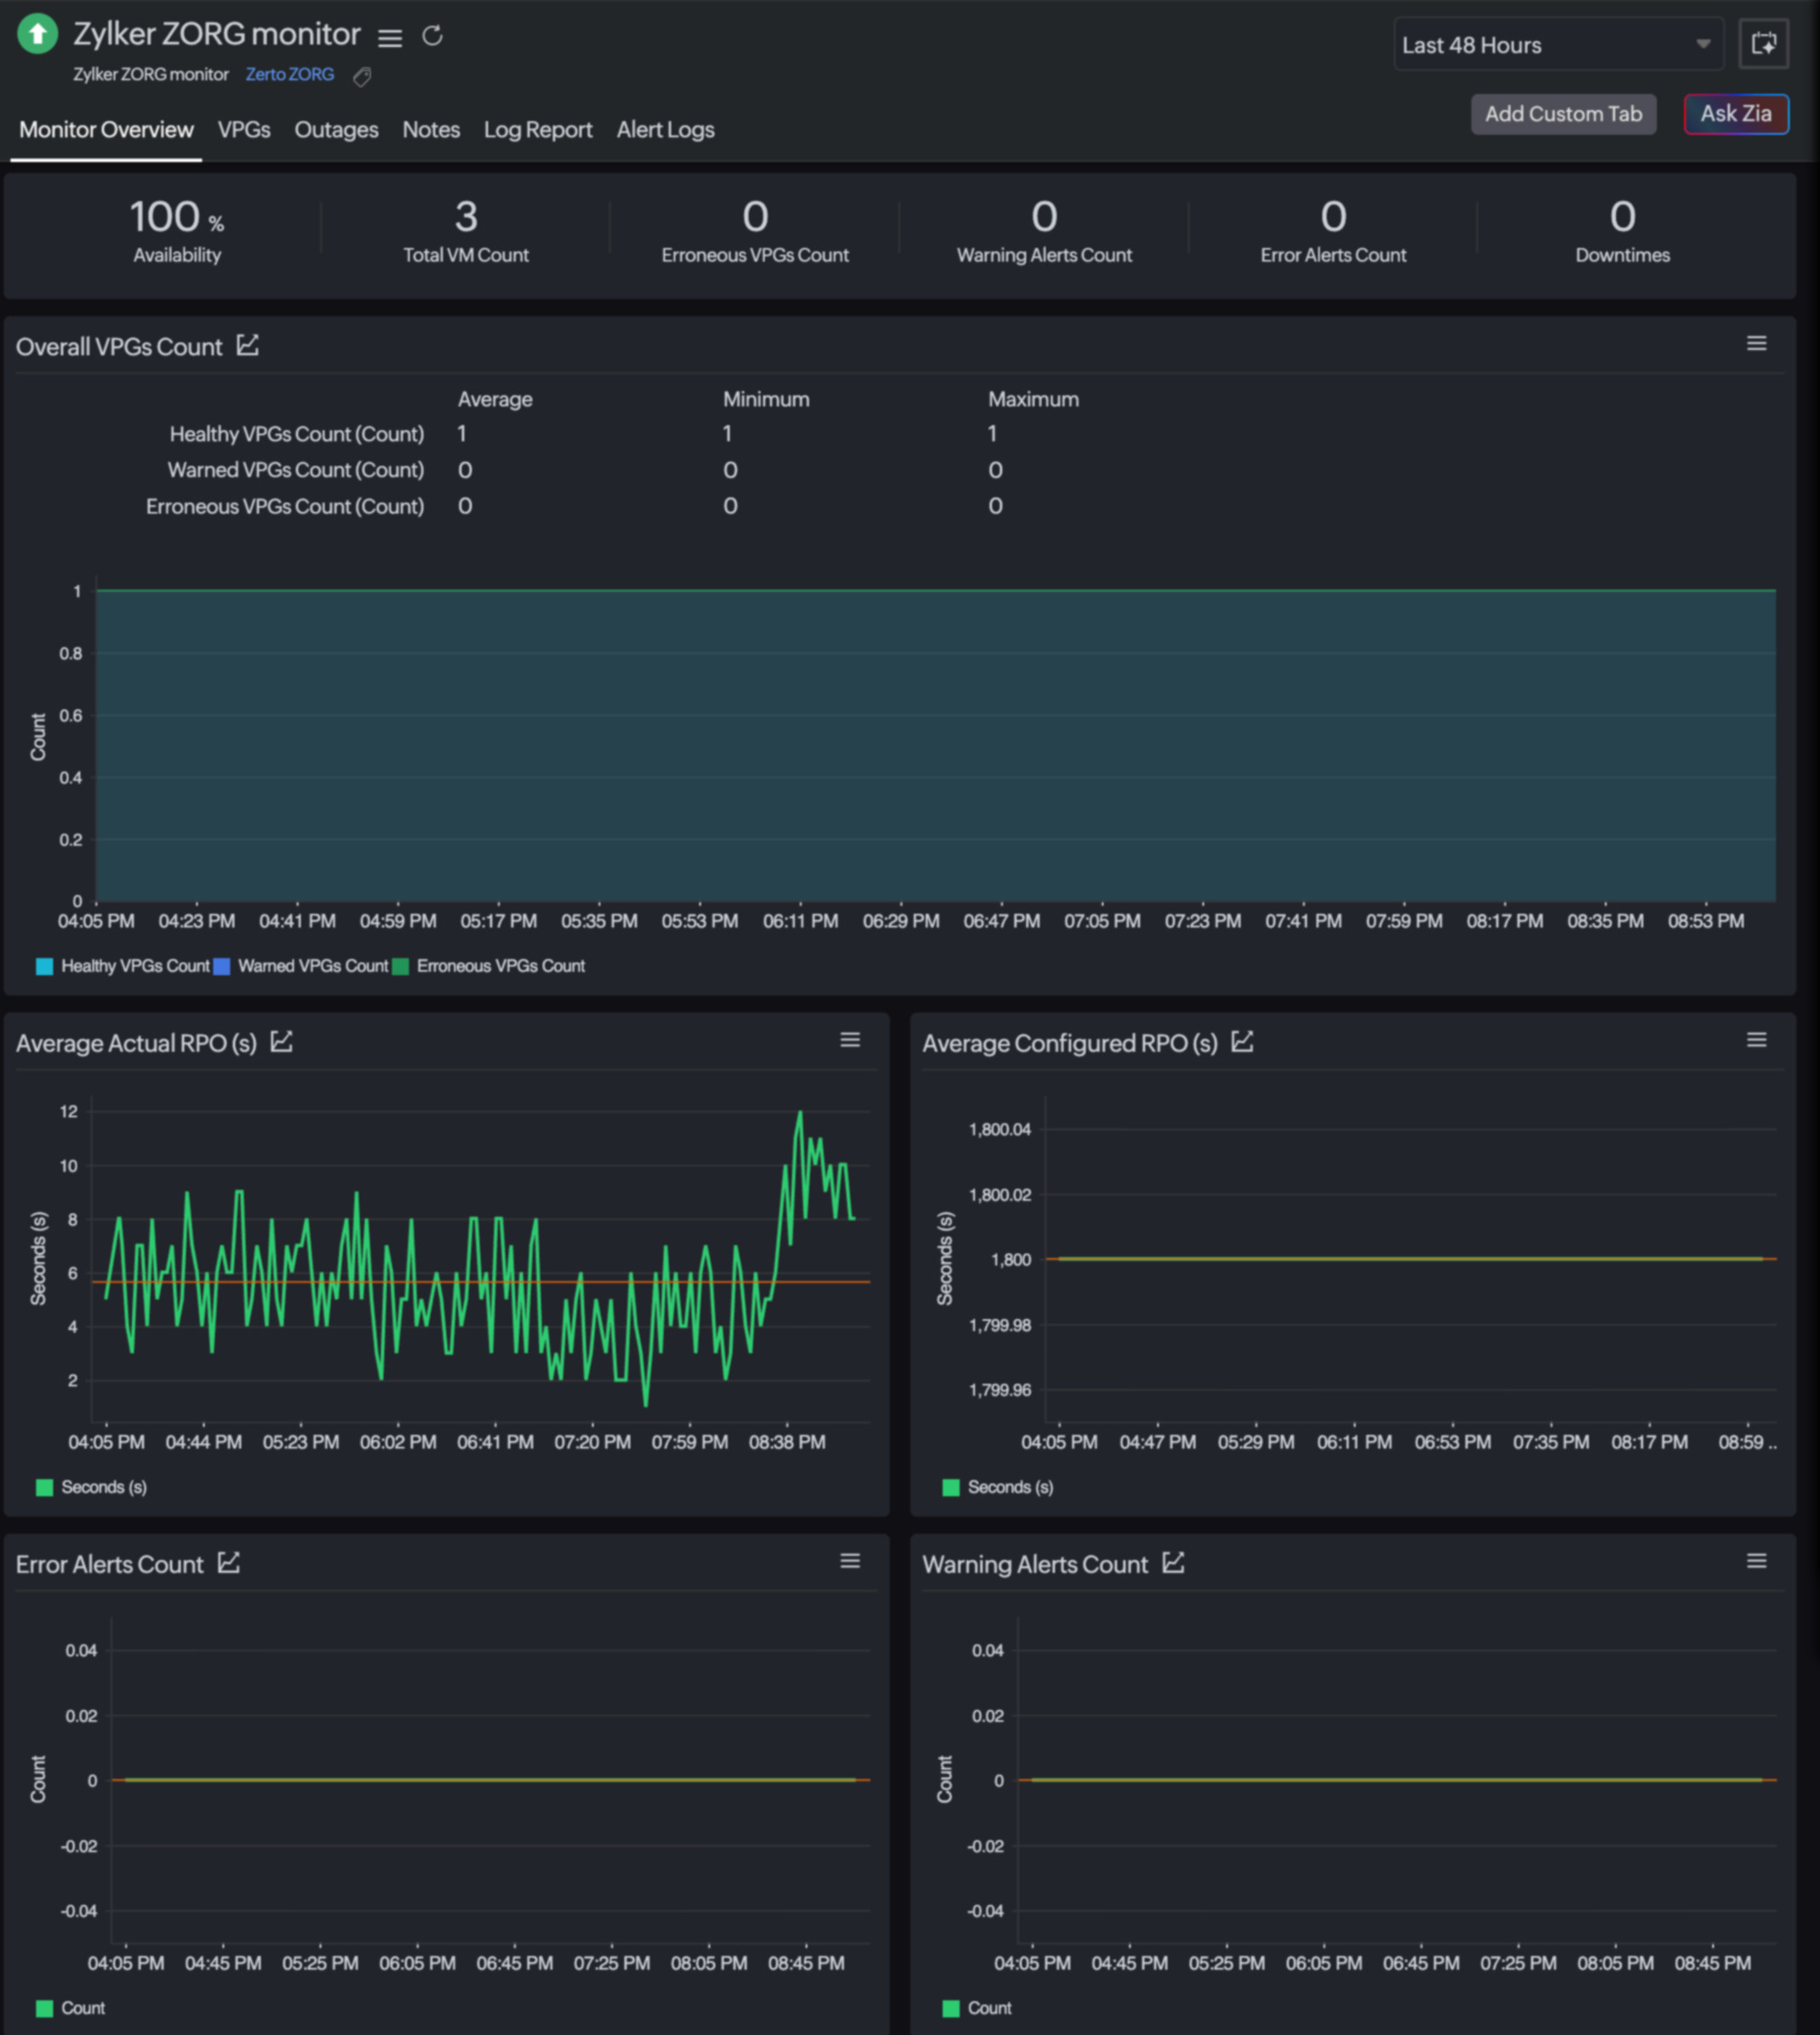
Monitor Overview: This tab provides the organization-level birds-eye view into VPGs, alert counts, availability status, and RPO compliance.
VPGs: This tab provides the health and performance of all protected workloads grouped under Zerto ORG.
VPGs
| Metric | Description | Unit |
|---|---|---|
| Healthy VPGs Count | Displays the number of VPGs operating normally with replication meeting configured RPO thresholds and that have no active issues in a graph. | Count |
| Warned VPGs Count | Displays the number of VPGs experiencing minor issues in a graph. | Count |
| Erroneous VPGs Count | Displays the number of VPGs in error state in a graph. | Count |
| Actual RPO | Displays the amount of potential data loss measured as replication lag in a graph. | Seconds |
| Configured RPO(s) | Displays the top 10 configured RPOs defined in the VPG SLA settings. | Seconds |
| VPGs | ||
| Name | Displays the name of the VPG. | Text |
| ZORG Name | Displays the name of the Zerto organization to which the VPG belongs. | Text |
| Actual RPO(s) | Displays how many seconds could be lost if a failover occurs. | Seconds |
| Configured RPO(s) | Displays how many seconds the configured data loss window set in the SLA policy. | Seconds |
| VPG Health | Displays the overall health state of the VPG. | Status text |
| Status | Displays the status of the SLA compliance, showing whether the VPG is meeting the configured RPO threshold. | Status text |
| Action | Sets the threshold for the specific field names and alerts if it breaches the threshold. | |
Editing the threshold and availability settings
You can edit the threshold profile of your Zerto ZORG monitor either through the configuration profile or by using the steps below:
- Navigate to Server > Backup Monitoring > Zerto ZORG.
- Select the monitor name you want to edit.
- Select the VPGs tab.
- Click the pencil icon in the Action column to open the field-level threshold changes.
- Edit the parameter that needs to change.
- Click Save.