Azure File Storage Monitoring Integration
Azure File Storage provides fully managed cloud File Storages that are accessible via the industry-standard SMB protocol. Azure File Storages can be mounted concurrently by cloud or on-premises deployments of Windows, Linux, and macOS.
You can now monitor your File Storages at a pin-pointed level, obtain accurate metrics, create thresholds, automate tasks, and stay on top of outages with Site24x7's integration.
Setup and configuration
Adding Azure File Storage while configuring a new Azure monitor
If you haven't configured an Azure monitor yet, add one by following the steps below:
- Log in to your Site24x7 account.
- Choose Cloud from the left navigation pane, then select Azure > Add Azure Monitor. You can also follow these steps to add an Azure monitor.
- During Azure monitor configuration, on the Edit Azure Monitor page, select Azure File Storage from the Service/Resource Types drop-down.
If you select Azure File Storage, Azure Storage Account is automatically selected. This is because Azure Storage Account monitoring is a prerequisite for Azure File Storage and Azure File Shares.
Adding Azure File Storage to an existing Azure monitor
If you already have an Azure monitor configured for the tenant, you can add Azure File Storage by following these steps:
- Log in to your Site24x7 account.
- Navigate to the Azure monitor for which you wish to add Azure File Storage.
- Click the hamburger icon
 and then Edit, which will bring you to the Edit Azure Monitor page.
 - On the Edit Azure Monitor page, select the corresponding Subscription and Resource Group from the drop-down menu, select Azure File Storage from the Service/Resource Types drop-down, and click Save.
If you select Azure File Storage, Azure Storage Account is automatically selected. This is because Azure Storage Account monitoring is a prerequisite for Azure File Storage and Azure File Shares.
After successful configuration, go to Cloud > Azure, and select Azure File Storage from the Azure monitor drop-down.
It will take up to 30 minutes to discover new Azure resources. For immediate discovery of the selected configuration, go to the Service View page of the Azure monitor and click Discover Now.
Polling frequency
Site24x7's Azure File Storage monitor collects metric data every minute and the statuses every five minutes.
Azure File Shares
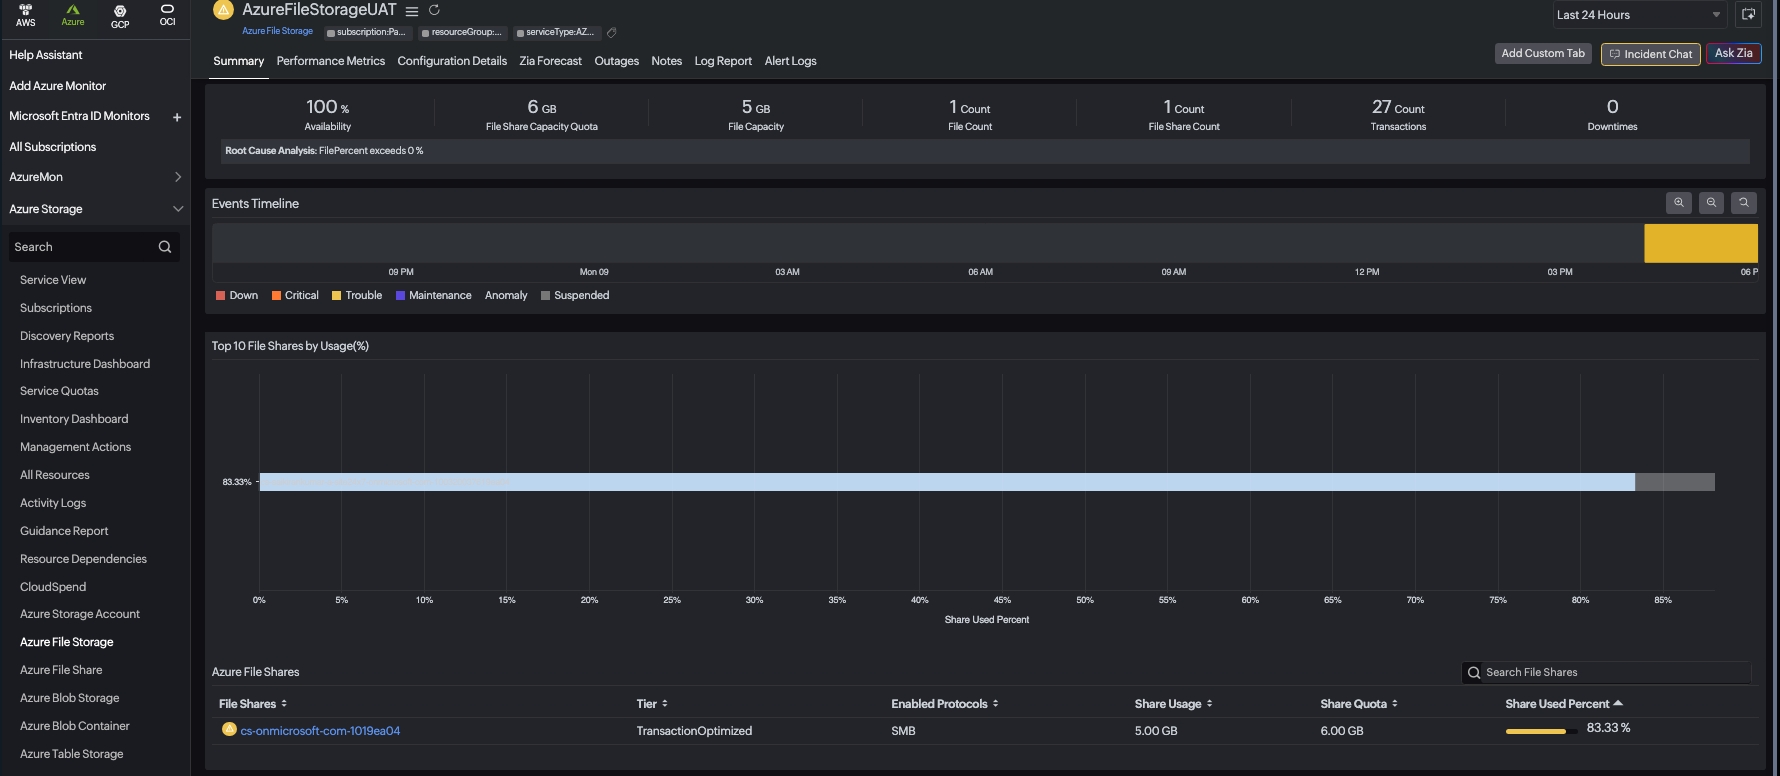
In the summary page of the Azure File Storage Monitor, you can view the following information about your file shares. The Summary tab includes the following key features:
- Top 10 File Storages by Usage chart - Visualizes the most utilized File Storages in your environment
- Azure File Storages section - Provides a comprehensive overview of your File Storage resources like Name, Tier, Enabled Protocols, Share Usage, Share Quota, and Share Used Percentage
You can click on any File Share in the list to navigate to its respective detailed monitor page, where you can view more specific metrics and performance data for that individual file share.
Supported metrics
The following metrics are collected:
| Metric name | Description | Statistic | Unit |
|---|---|---|---|
| File Capacity | The amount of storage used by the storage account's file service. | Average | Bytes |
| File Count | The number of files in the storage account's file service. | Average | Count |
| File Storage Capacity Quota | The upper limit on the amount of storage that can be used by Azure file service. | Average | Bytes |
| File Storage Count | The number of File Storages in the storage account's file service. | Average | Count |
| File Storage Snapshot Count | The number of snapshots present on the share in the storage account's file service. | Average | Count |
| File Storage Snapshot Size | The amount of storage used by the snapshots in the storage account's file service. | Average | Bytes |
| Availability | The availability for the storage service or the specified API operation. | Average | Percentage (%) |
| Transactions | The number of requests made to a storage service or the specified API operation: this number includes successful and failed requests, as well as requests that produced errors. | Average | Count |
| Egress | The amount of egress data: this number includes egress from an external client into Azure Storage as well as egress within Azure. | Average | Bytes |
| Ingress | The amount of ingress data: this number includes ingress from an external client into Azure Storage as well as ingress within Azure. | Average | Bytes |
| Success E2E Latency | The end-to-end latency of successful requests made to a storage service or the specified API operation. | Average | Milliseconds |
| Success Server Latency | The latency used by Azure Storage to process a successful request. | Average | Milliseconds |
Threshold configuration
Global configuration
- Go to the Admin section on the left navigation pane.
- Select Configuration Profiles from the left pane and choose the Threshold and Availability (+) tab from the drop-down menu. Click Add Threshold Profile from the top-right corner.
- Set the monitor type as Azure File Storage. Now you can set the threshold values for all the metrics mentioned above.
Monitor-level configuration
- Go to Cloud > Azure and select Azure File Storage from the drop-down menu.
- Choose a resource for which you would like to set a threshold, then click the hamburger icon . Select Edit, which directs you to the Edit Azure File Storage Monitor page.
You can set the threshold values for the metrics by selecting Threshold and Availability. You can also configure IT Automation at the attribute level.
Configuration Details
The Configuration Details of an application instance are provided under this tab.
- To get the configuration details, go to Cloud > Azure and click the Azure monitor > Azure File Storage.
- Click a resource and select the Configuration Details tab.
Outages
The Outages tab provides the history of the File Storage statuses, including Down, Trouble, and Critical.
Log Report
The Log Report tab lists all the logs collected during every data collection, along with their statuses.
Azure Uptime monitoring
Site24x7's Azure Uptime monitoring enables proactive tracking of your Azure resources' availability and uptime, along with their configuration and inventory details. Note that uptime monitoring will disable performance metric data collection.
IT Automation
IT Automation in Site24x7 aids in automatically resolving performance degradation issues. When a breach occurs, the alarm engine continuously examines the system events for which thresholds have been defined and executes the mapped automation.
How to configure IT Automation for a monitor.
Configuration Rules
Configure parameters for multiple monitors using Site24x7's Configuration Rules, such as Threshold Profile, Notification Profile, Tags, Monitor Group, and other parameters. While adding new monitors, you can run a scan and associate any of the previously generated rules that suit the monitor configurations.
In Azure File Storage, you can add configuration rules for:
- Add File Shares - Monitor specific File Storages in your storage account
The first 100 File Shares will be monitored by default. The configuration rule enabled for discovery and monitoring File Shares takes higher priority over default monitor discovery.
Regular expressions (RegEx) are supported for configuration, allowing you to define patterns for monitoring multiple resources that match specific naming conventions.
How to add a configuration rule.
License details
The following licensing applies to Azure File Storage monitoring:
- One Basic Monitor License for each Storage Account
- One Basic Monitor License for every 25 File Share monitors
Reports
Gain in-depth data about the various parameters of your monitored resources and highlight your service performance using our insightful reports.
To view reports for Azure File Storage:
- Navigate to the Reports section on the left navigation pane.
- Select Azure File Storage from the menu on the left.
You can find the Availability Summary Report and the Performance Report for one selected monitor, or you can get the Inventory Report, Summary Report, Availability Summary Report, Health Trend Report, and the Performance Report for all the Azure File Storage monitors.
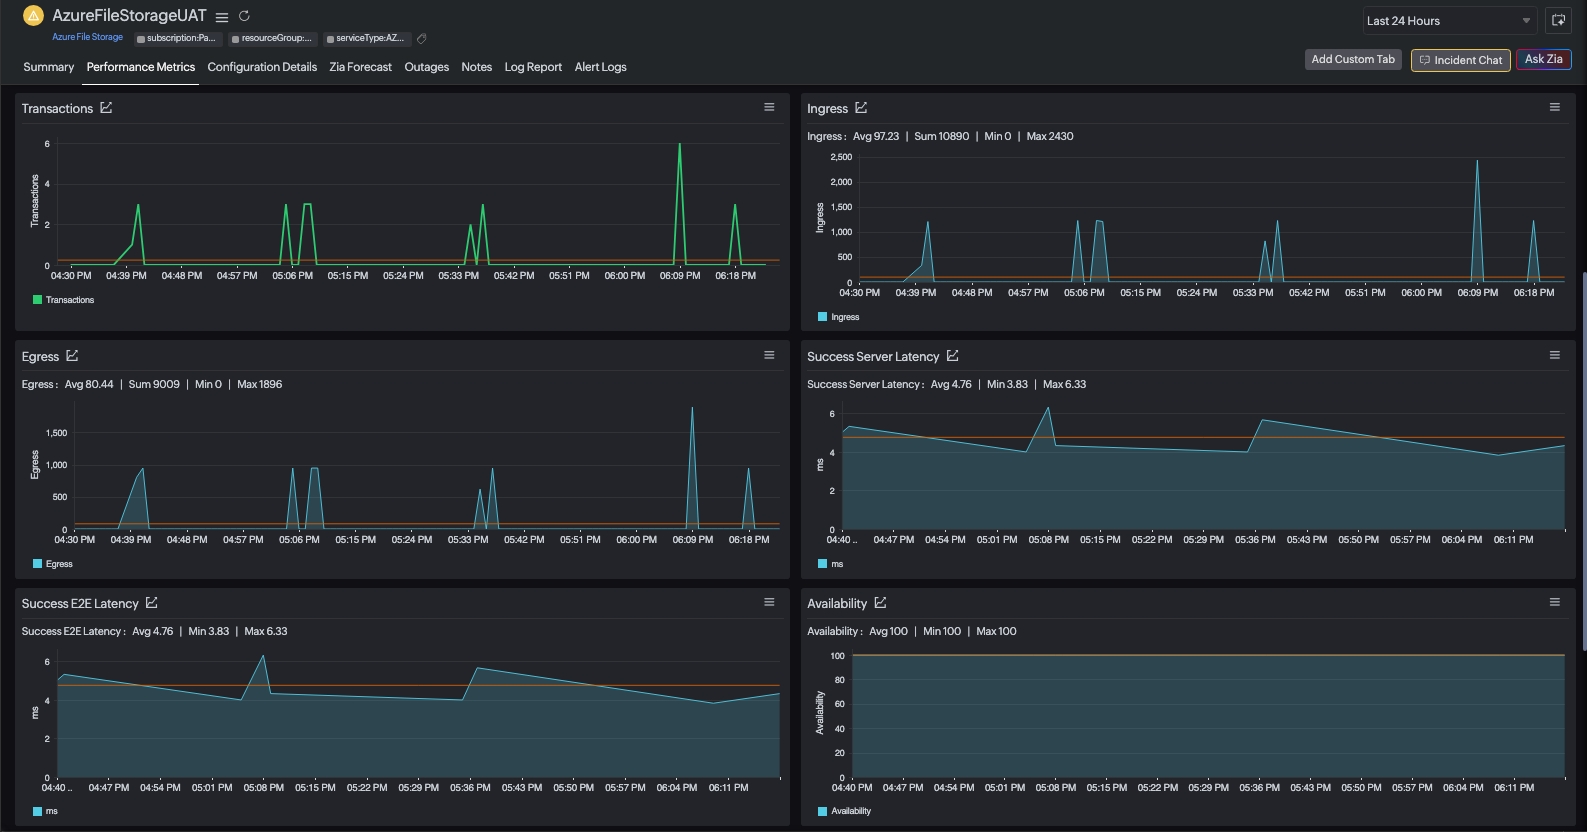
You can also get reports from the Performance Metrics tab of the Azure File Storage monitor.
- Go to the Performance Metrics tab of the Azure File Storage monitor, and get the Availability Summary Report of the monitor by clicking Availability or Downtime.
- You can also find the Performance Report of the monitor by clicking any chart title.