Azure Data Explorer Cluster monitoring integration
Azure Data Explorer Cluster is a fully-managed big data analytics service that is scalable and secure. It enables you to analyze large volumes of structured or unstructured data in real time and gain insights on critical trends and forecasting patterns.
With Site24x7's integration, you can now monitor your Data Explorer Cluster to obtain reliable metrics, define thresholds, and get alerts when there is a breach.
Setup and configuration
- Adding Azure Data Explorer Cluster while configuring a new Azure monitor
If you haven't configured an Azure monitor yet, add one by following the steps below:
- Log in to your Site24x7 account.
- Click Cloud from the left navigation pane, select Azure > Add Azure Monitor. You can also follow these steps to add an Azure monitor.
- Select Azure Data Explorer Cluster from the Service/Resource Types drop-down in Add Azure Monitor page.
- Adding Azure Data Explorer Cluster to an existing Azure monitor
If you already have an Azure monitor configured for the tenant, you can add Azure Data Explorer Cluster by using the following steps:
- Log in to your Site24x7 account.
- Go to Cloud > Azure > your Azure monitor > and then navigate to any of the dashboards from the left pane of your Azure monitor.
- Click the hamburger
 icon and then Edit, which will bring you to the Edit Azure Monitor page.
 - In the Edit Azure Monitor page, select the corresponding Subscription and Resource Group from the drop-down menu, select Azure Data Explorer Cluster from the Service/Resource Types drop-down, and click Save.
After successful configuration, go to Cloud > Azure, select Azure Data Explorer Cluster from the Azure Monitor drop-down. Now you can view the discovered Azure Data Explorer Cluster.
New Azure resources will be auto-discovered in the next discovery cycle. For immediate discovery of the selected configuration, go to the Infrastructure Dashboard of the Azure monitor and click hamburger ![]() icon and then click Discover Now.
icon and then click Discover Now.
Polling frequency
Site24x7's Azure Data Explorer Cluster monitor collects minute-wise metric data every five minutes and displays the minute by minute status from your Data Explorer Cluster.
Supported metrics
| Metric name | Description | Statistic | Unit |
|---|---|---|---|
| Batch Blob Count | The average number of data sources in an aggregated batch for ingestion | Average | Count |
| Batch Duration | The duration of the aggregation phase in the ingestion flow | Average | Seconds |
| Batches Processed | The total number of batches aggregated for ingestion. | Total | Count |
| Batch Size | The uncompressed expected data size in an aggregated batch for ingestion | Average | Bytes |
| Blobs Dropped | The total number of blobs permanently rejected by a component | Total | Count |
| Blobs Processed | The total number of blobs processed by a component | Total | Count |
| Blobs Received | The total number of blobs received from the input stream by a component | Total | Count |
| Cache Utilization | The utilization level in the cluster scope | Average | Percent |
| Cache Utilization Factor | The percentage difference between the current number of instances and the optimal number of instances (per cache utilization) | Average | Percent |
| Continuous Export Max Lateness | The lateness (in minutes) reported by the continuous export jobs in the cluster | Maximum | Count |
| Continuous Export - Num of Exported Records | The total number of records exported, fired for every storage artifact written during the export operation | Total | Count |
| Continuous Export Pending Count | The number of pending continuous export jobs ready for execution | Maximum | Count |
| Continuous Export Result | Indicates whether the continuous export succeeded or failed | Count | Count |
| CPU | The average CPU utilization level | Average | Percent |
| Discovery Latency | Reported by data connections (if it exists). Time from when a message is added to the queue or an event is created until it is discovered by the data connection. This time is not included in the Azure Data Explorer total ingestion duration | Average | Seconds |
| Events Dropped | The total number of events dropped permanently by data connection. An ingestion result metric with a failure reason will be sent | Total | Count |
| Events Processed | The total number of events processed by the cluster | Total | Count |
| Events Processed (for Event/IoT Hubs) | The total number of events processed by the cluster when ingesting from the Event/IoT Hub | Total | Count |
| Events Received | The total number of events received by data connection | Total | Count |
| Export Utilization | The maximum export utilization | Maximum | Percent |
| Ingestion Latency | The latency of data ingested, from the time the data was received in the cluster until it's ready for query. The ingestion latency period depends on the ingestion scenario | Average | Seconds |
| Ingestion Result | The total number of sources that either failed or succeeded for ingestion. Splitting the metric by status, you can get detailed information about the status of the ingestion operations | Total | Count |
| Ingestion Utilization | The ratio of used ingestion slots in the cluster | Average | Percent |
| Ingestion Volume | The overall volume of ingested data to the cluster | Total | Bytes |
| Instance Count | The total instance count | Average | Count |
| Keep Alive | The sanity check that indicates whether the cluster responds to queries or not | Average | Count |
| Materialized View Age | The materialized view age in minutes | Average | Minutes |
| Materialized View Data Loss | The potential data loss in materialized view | Maximum | Count |
| Materialized View Extents Rebuild | The average number of extents rebuild | Average | Count |
| Materialized View Health | The health of the materialized view (1 for healthy, 0 for non-healthy) | Average | Count |
| Materialized View Records in Delta | The number of records in the non-materialized part of the view | Average | Count |
| Materialized View Result | The result of the materialization process | Average | Count |
| Query Duration | The duration of the queries | Average | Milliseconds |
| Query Result | The total number of queries | Count | Count |
| Queue Length | The number of pending messages in a component's queue | Average | Count |
| Queue Oldest Message | The time in seconds from when the oldest message in queue was inserted | Average | Seconds |
| Received Data Size Bytes | The size of data received during data connection. This is the size of the data stream, or of raw data size if provided | Average | Bytes |
| Stage Latency | The cumulative time from when a message is discovered until it is received by the reporting component for processing. (The discovery time is set when the message is added to the queue for the ingestion queue, or when discovered by the data connection) | Average | Seconds |
| Follower Latency | Represents the latency of the process | Average | Seconds |
| Streaming Ingest Data Rate | The streaming ingest data rate (MB per second) | Average | Count |
| Streaming Ingest Duration | The streaming ingest duration in milliseconds | Average | Milliseconds |
| Streaming Ingest Result | The streaming ingest result | Count | Count |
| Total Number of Concurrent Queries | The total number of concurrent queries | Maximum | Count |
| Total Number of Extents | The total number of data extents | Average | Count |
| Total Number of Throttled Commands | The total number of throttled commands | Total | Count |
| Total Number of Throttled Queries | The total number of throttled queries | Maximum | Count |
| Weak Consistency Latency | The maximum latency between the previous metadata sync and the next one (in DB or node scope) | Average | Seconds |
Threshold configuration
- Global configuration
- Click Admin in the left navigation pane.
- Select Configuration Profiles from the left pane and click Threshold and Availability (+) from the drop-down menu. Click Add Threshold Profile in the top-right corner.
- Choose the monitor type as Azure Data Explorer Cluster. Now you can set the threshold values for all the metrics mentioned above.
- Monitor-level configuration
- Go to Cloud > Azure and select Azure Data Explorer Cluster from the drop-down menu.
- Choose the resource for which you would like to set threshold and then click the hamburger
 icon . Choose the Edit option, which will direct you to the Edit Azure Data Explorer Cluster Monitor page.
 - You can set the threshold values for the metrics by selecting the Threshold and Availability option. You can also configure IT Automation at the attribute level.
IT Automation
Site24x7's IT Automation tools help auto-resolve performance degradation issues. The alarm engine continually evaluates the system events for which thresholds are set, and executes the mapped automation when there is a breach.
How to configure IT Automation for a monitor
Configuration Rules
Configure parameters like Threshold Profile, Notification Profile, Tags, Monitor Group, and others for multiple monitors with Site24x7's Configuration Rules. You can run a scan and associate any of the previously generated rules that suit the monitor configurations while adding new monitors.
How to add a configuration rule
Summary
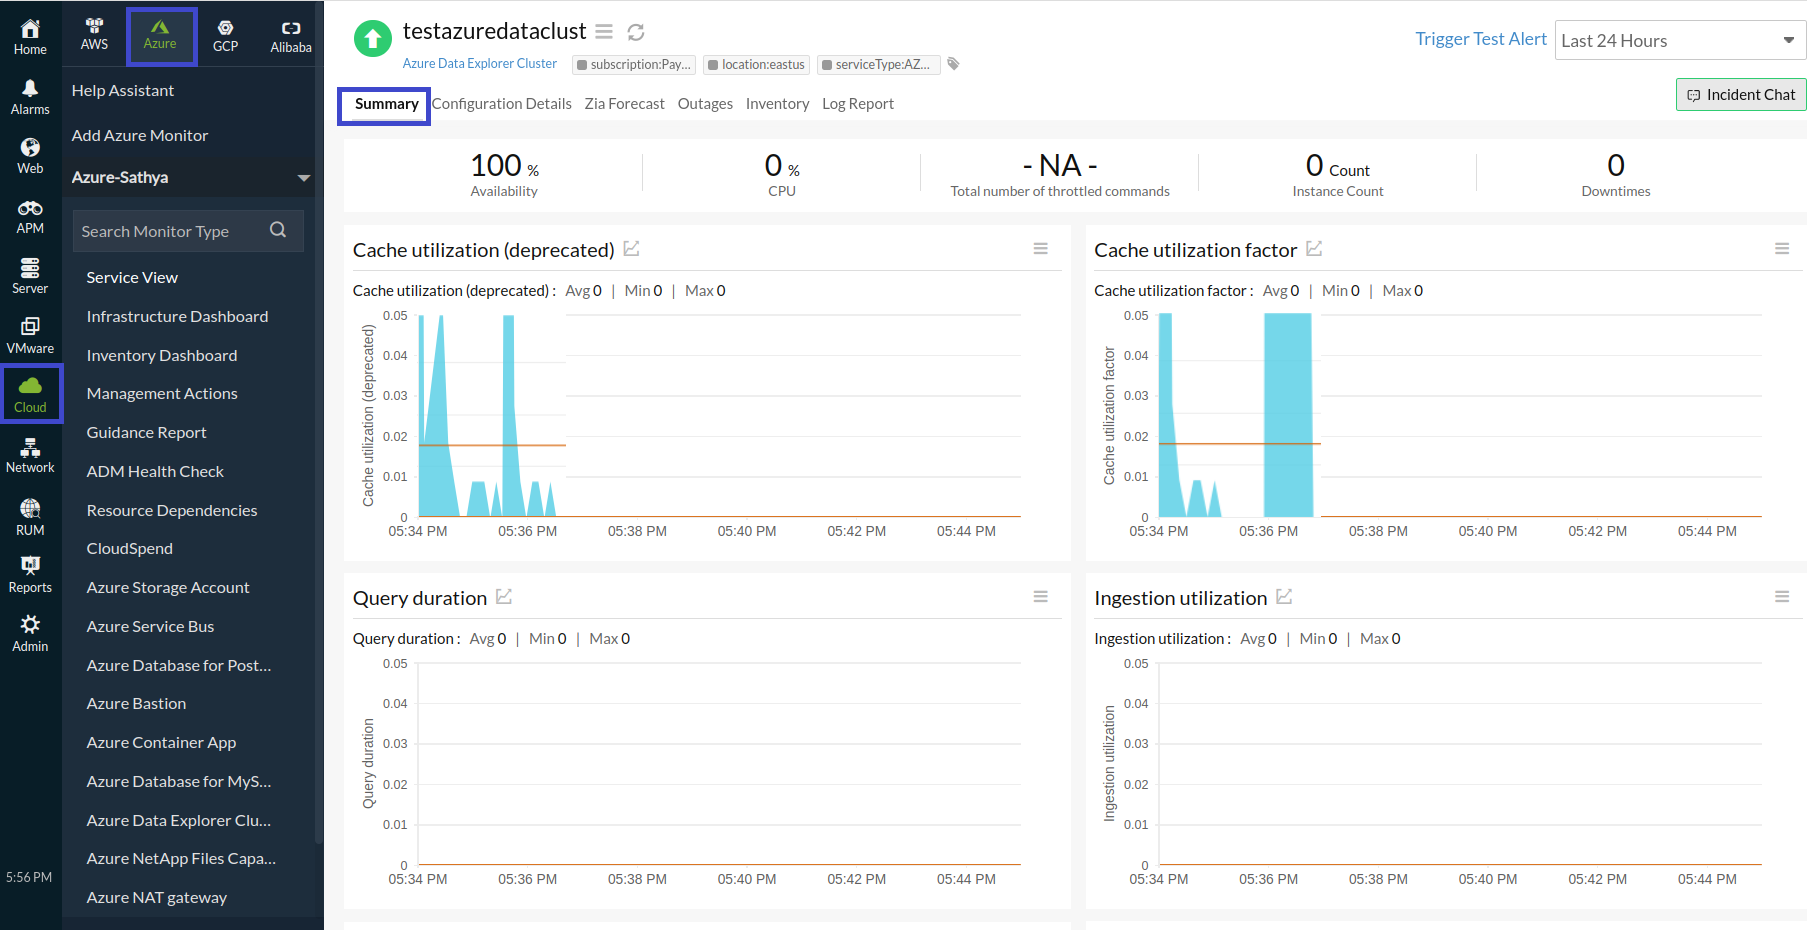
The Summary tab will give you the performance data organized by time for the above mentioned metrics.
- To view the summary, go to Cloud > Azure and click the Azure monitor > Azure Data Explorer Cluster.
- Click a resource and click Summary.
By doing so, you can view the Batch Blob Count, Batch Duration, Batches Processed, and much more.
Configuration Details
The Configuration Details of an application instance are provided under this tab. Here, you'll find the State, Data Ingestion URI, Enable Purge, and so on.
- To get the configuration details, go to Cloud > Azure and click the Azure monitor > Azure Data Explorer Cluster.
- Click a resource and select the Configuration Details tab.
Reports
Gain in-depth data about the various parameters of your monitored resources and highlight your service performance using our insightful reports.
To view reports for Azure Data Explorer Cluster:
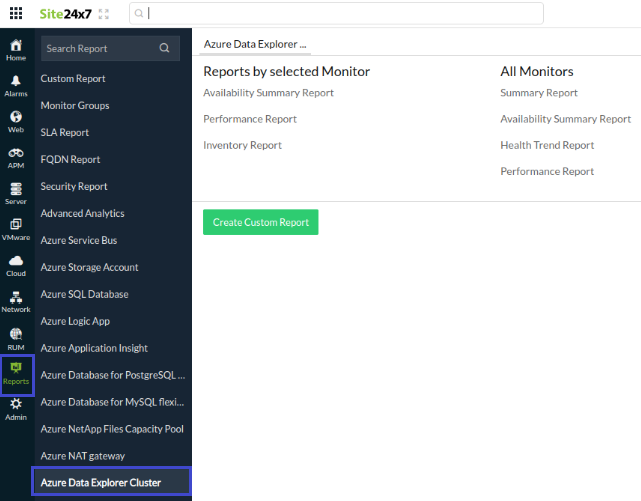
- Navigate to the Reports section on the left navigation pane.
- Select Azure Data Explorer Cluster from the menu on the left.
You can find the Availability Summary Report and the Performance Report for one selected monitor, or you can get the Inventory Report, Summary Report, Availability Summary Report, Health Trend Report, and the Performance Report for all the Azure Data Explorer Cluster monitors.

You can also get reports from the Summary tab of the Azure Data Explorer Cluster monitor.
- Go to the Summary tab of the Azure Data Explorer Cluster Monitor, and get the Availability Summary Report of the monitor by clicking on Availability or Downtime.
- You can also find the Performance Report of the monitor by clicking on any chart title.

