Azure Disk Monitoring Integration
Azure disks are block-level storage volumes that are used with Azure Virtual Machines. Azure provides exclusive disk storage that can be attached to a virtual machine (VM) and can be used as a primary operating system (OS) disk, data disk, or both. These disks are virtualized versions of real disks on the on-premises servers.
With Site24x7's integration, you can now monitor your OS and data disks with accurate metrics, configure thresholds, and get instant alerts if there is a breach.
Setup and configuration
Adding an Azure disk while configuring a new Azure monitor
If you haven't configured an Azure Monitor yet, add one by following the steps below:
- Log in to your Site24x7 account.
- Choose Cloud from the left navigation pane, and select Azure > Add Azure Monitor. You can also follow these steps to add an Azure Monitor.
- During Azure monitor configuration, in the Edit Azure Monitor page, select Azure Disk from the Service/Resource Types drop-down.
Adding an Azure disk to an existing Azure monitor
If you already have an Azure monitor configured for the tenant, you can add the Azure disk using the following steps:
- Log in to your Site24x7 account.
- Navigate to Cloud > Azure > select the Azure monitor from the left pane for which you wish to add an Azure disk.
- In the Service View page, click the Enable Monitoring button on the Service type that you would like to add. In this case, click the Enable Monitoring button in the Azure Disk Service type.
It will take 15-30 minutes to discover new Azure resources. To immediately discover the selected configuration, click Discover Now in the top-right corner.
After successful addition, go to Cloud > Azure and select Azure Disk from the Azure monitor drop-down. Now, you can view the discovered disks.
Polling frequency
Site24x7's Azure Disk monitor collects metric data every minute and the statuses from your disks every five minutes.
Supported metrics
Site24x7 supports metric monitoring for Azure's basic metrics, as well as in-depth metrics of data disks and OS disks by tracking the VM that manages the disk.
Azure Preview metrics
| Metric | Description | Statistic | Unit |
| Disk Read Bytes/Sec (Preview) | The amount of bytes read from the disk during the monitoring period. | Average | Bytes per second |
| Disk Read Operations/Sec (Preview) | The number of read IOs (input-outputs) performed on a disk during the monitoring period. | Average | Count per second |
| Disk Write Bytes/Sec (Preview) | The amount of bytes written to disk during the monitoring period. | Average | Bytes per second |
| Disk Write Operations/Sec (Preview) | The number of write IOs performed on a disk during the monitoring period. | Average | Count per second |
| Disk Paid Burst IOPS (Preview) | The number of accumulated operations of burst transactions used for disks with on-demand burst enabled. This is emitted in an hourly interval. | Average | Count |
Performance metrics of data disks
| Metric name | Description | Statistic | Unit |
| Data Disk Read Bytes/Sec | The amount of data read from a single disk during the monitoring period. | Average | Bytes per second |
| Data Disk Write Bytes/Sec | The amount of data written to a single disk during the monitoring period. | Average | Bytes per second |
| Data Disk Read Operations/Sec | The amount of read operations data from a single disk during the monitoring period. | Average | Count per second |
| Data Disk Write Operations/Sec | The amount of write operations data from a single disk during the monitoring period. | Average | Count per second |
| Data Disk Bandwidth Consumed Percentage | The percentage of data disk bandwidth consumed per minute. | Average | Percent |
| Data Disk IOPS Consumed Percentage | The amount of data disk IOs consumed per minute. | Average | Count |
| Data Disk Bandwidth Consumed | The amount of data disk bandwidth consumed per minute. | Average | Count |
| Data Disk IOPS Consumed | The amount of data disk IOs consumed per minute. | Average | Count |
| Data Disk Target Bandwidth | The amount of throughput the data disk can achieve without bursting. | Average | Count |
| Data Disk Target IOPS | The amount of baseline IOPS the data disk can achieve without bursting. | Average | Count |
| Data Disk Max Burst Bandwidth | The maximum bytes throughput the data disk can achieve with bursting. | Average | Count |
| Data Disk Max Burst IOPS | The maximum IOPS the data disk can achieve with bursting. | Average | Count |
| Data Disk Used Burst BPS Credits Percentage | The percentage of data disk burst bandwidth credits used so far. | Average | Percent |
| Data Disk Used Burst IO Credits Percentage | The percentage of data disk burst IO credits used so far. | Average | Percent |
| Data Disk Used Burst BPS Credits | The amount of data disk burst bandwidth credits used so far. | Average | Count |
| Data Disk Used Burst IO Credits | The percentage of data disk burst IO credits used so far. | Average | Count |
| Data Disk Queue Depth | The amount of data disk queue depth or the length of the queue. | Average | Count |
Performance metrics of OS disks
| Metric name | Description | Statistic | Unit |
| OS Disk Read Bytes/Sec | The amount of data read from a single disk during the monitoring period for the OS disk. | Average | Bytes per second |
| OS Disk Write Bytes/Sec | The amount of data written to a single disk during the monitoring period for OS disk. | Average | Bytes per second |
| OS Disk Read Operations/Sec | The number of read operations from a single disk during the monitoring period for the OS disk. | Average | Count per second |
| OS Disk Write Operations/Sec | The number of write operations from a single disk during the monitoring period for the OS disk. | Average | Count per second |
| OS Disk Bandwidth Consumed Percentage | The percentage of OS disk bandwidth consumed per minute. | Average | Percent |
| OS Disk IOPS Consumed Percentage | The percentage of OS disk IOs consumed per minute. | Average | Percent |
| OS Disk Bandwidth Consumed | The amount of OS disk bandwidth consumed per minute. | Average | Count |
| OS Disk IOPS Consumed | The amount of OS disk IOs consumed per minute. | Average | Count |
| OS Disk Target Bandwidth | The amount of baseline bytes throughput the OS disk can achieve without bursting. | Average | Count |
| OS Disk Target IOPS | The amount of baseline IOPS that the OS disk can achieve without bursting. | Average | Count |
| OS Disk Max Burst Bandwidth | The maximum bytes throughput that the OS disk can achieve with bursting. | Average | Count |
| OS Disk Max Burst IOPS | The maximum IOPS that the OS disk can achieve with bursting | Average | Count |
| OS Disk Used Burst BPS Credits Percentage | The percentage of OS disk burst bandwidth credits used so far. | Average | Percent |
| OS Disk Used Burst IO Credits Percentage | The percentage of OS disk burst IO credits used so far. | Average | Percent |
| OS Disk Used Burst BPS Credits | The amount of OS disk burst bandwidth credits used so far. | Average | Count |
| OS Disk Used Burst IO Credits | The amount of OS disk burst IO credits used so far. | Average | Count |
| OS Disk Queue Depth | The amount of OS disk queue depth or the length of the queue. | Average | Count |

Threshold configuration
Global configuration
- Go to the Admin section on the left navigation pane.
- Select Configuration Profiles from the left pane and choose Threshold and Availability (+) from the drop-down menu. Click Add Threshold Profile from the top right corner.
- Choose Azure Disk as the monitor type.
You can also set the threshold values for all the metrics mentioned above.
Monitor-level configuration
- Go to Cloud > Azure and select Azure Disk from the drop-down menu.
- Choose a resource for which you would like to set a threshold and then click the hamburger icon
 on the top. Choose the Edit option, which will direct you to the Edit Azure Disk Monitor page.
You can set the threshold values for the metrics by selecting the Threshold and Availability option. You can also configure IT automation at the attribute level.
Default threshold for disk optimization
Site24x7 alerts you based on a set of default thresholds. These default thresholds ensure that your disk capacity is not overutilized, thus maintaining optimal storage and performance. This also helps in reducing costs by getting alerts for unusual changes in your disks. The default thresholds are as follows:
- Alert if Disk is not attached (Idle Disk)
- Alert if Storage Type is Changed
- Alert if Disk Size is Changed
- Alert if Disk IOPS Size is Changed
- Alert if Disk throughput is Changed
- Alert if Public Network Access is Changed
- Alert if Performance Tier is Changed
- Alert if Connected VM is Changed
- Data Disk Bandwidth Consumed Percentage
- Data Disk IOPS Consumed Percentage
- Data Disk Used Burst BPS Credits Percentage
- Data Disk Used Burst IO Credits Percentage
- OS Disk Bandwidth Consumed Percentage
- OS Disk IOPS Consumed Percentage
- OS Disk Used Burst BPS Credits Percentage
- OS Disk Used Burst IO Credits Percentage
IT Automation
Site24x7 offers a set of exclusive IT Automation tools to auto-resolve performance degradation issues. These tools react to events proactively rather than waiting for manual intervention. IT Automation tools help automate repetitive tasks and automatically remediate threshold breaches. The alarms engine continually evaluates system events for which thresholds are set and executes the mapped automation when there is a breach.
How to configure IT Automation for a monitor.
Configuration Rules
Editing multiple monitors to associate different monitor groups or adding a different tag can be a tedious process. With Site24x7's Configuration Rules, you can automate the configuration settings of your monitoring resources. Also, Site24x7 allows you to create custom rules to continuously track configuration changes and achieve the ideal configuration settings.
How to add a configuration rule.
Performance
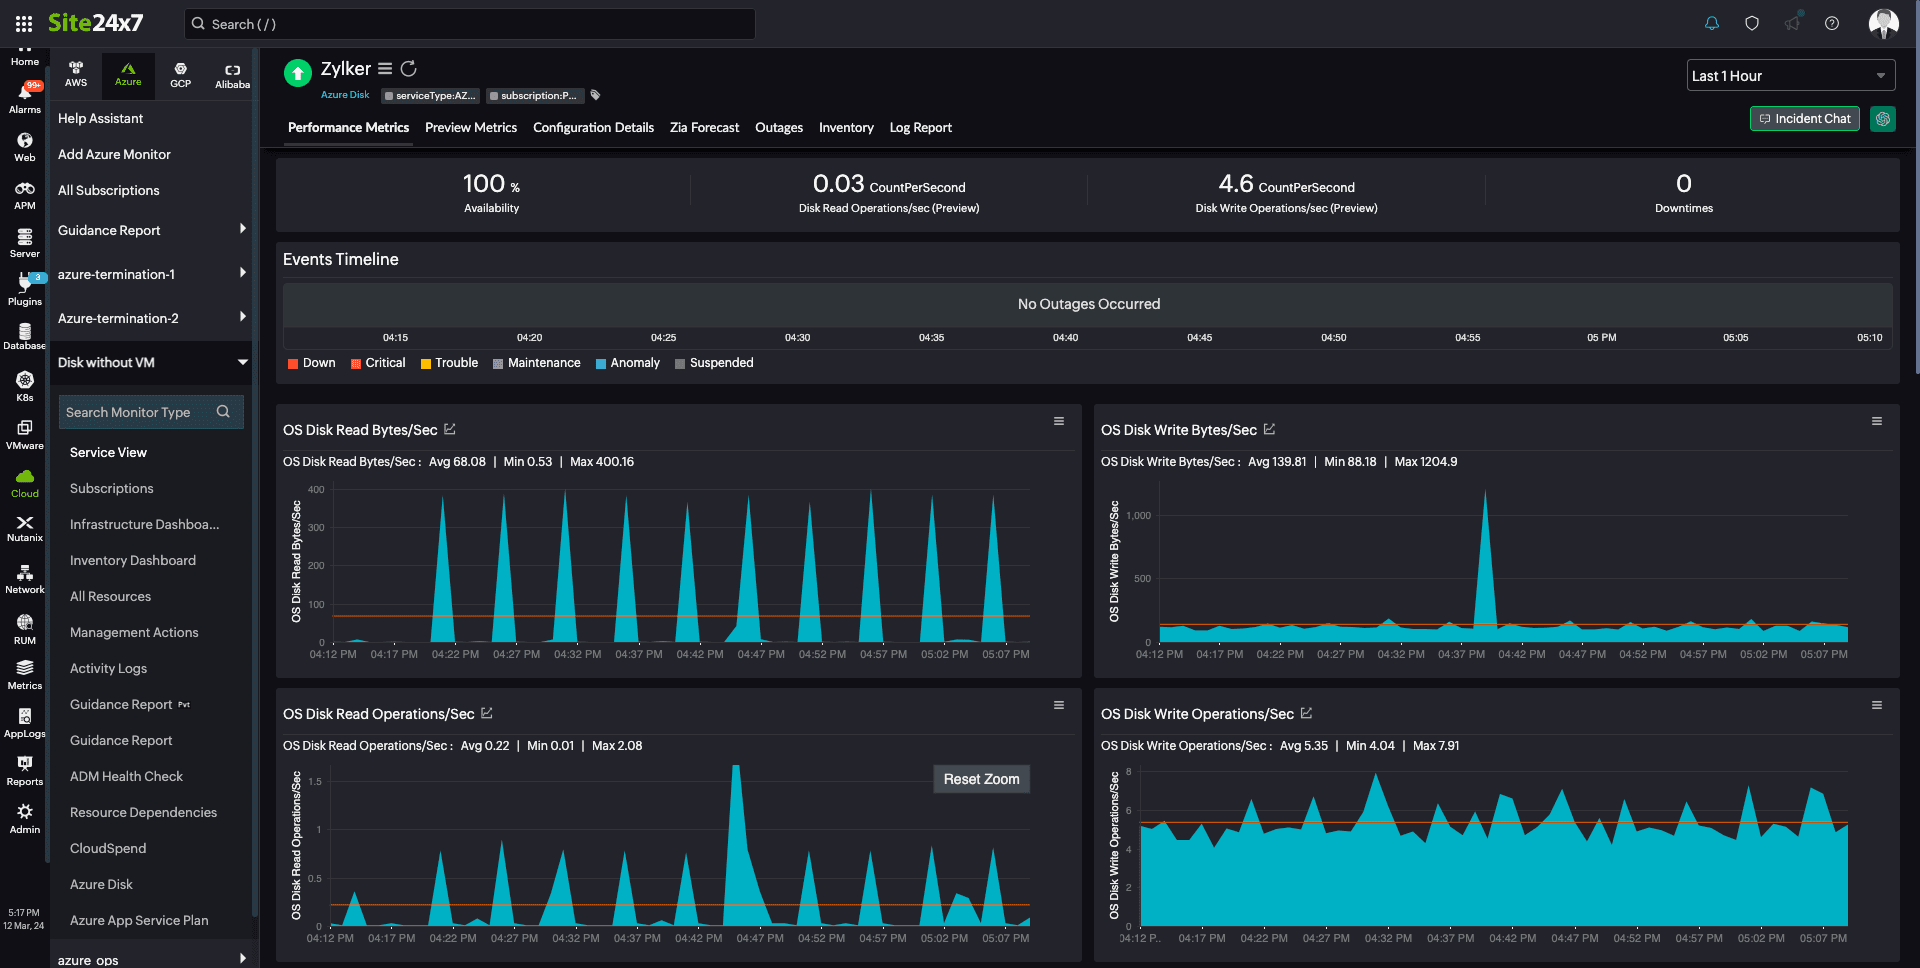
The Performance tab will give you the performance data organized by time for the above-mentioned metrics.
- To view the summary, go to Cloud > Azure and click the Azure monitor > Azure Disk.
- Click a resource and select the Performance tab.
By doing so, you can view metrics like Queue Depth, Read Bytes, Write Bytes, and many more.
Configuration Details
The Configuration Details tab provides details on configurations for application instances. Here, you'll find the Managed By field, Disk Size, Disk State, Disk Tier, Network Access Policy, and so on.
- To get the configuration details, go to Cloud > Azure and click the Azure monitor > Azure Disk.
- Click a resource and select the Configuration Details tab.
Reports
Gain in-depth data about the various parameters of your monitored resources and accentuate your service performance using our insightful reports.
To view reports for an Azure disk:
- Navigate to the Reports section on the left navigation pane.
- Select Azure Disk from the menu on the left.
You can find the Availability Summary Report, Inventory Report, and Performance Report for one selected monitor, or you can get the Summary Report, Availability Summary Report, Health Trend Report, and Performance Report for all the disk monitors.
Schedule reports
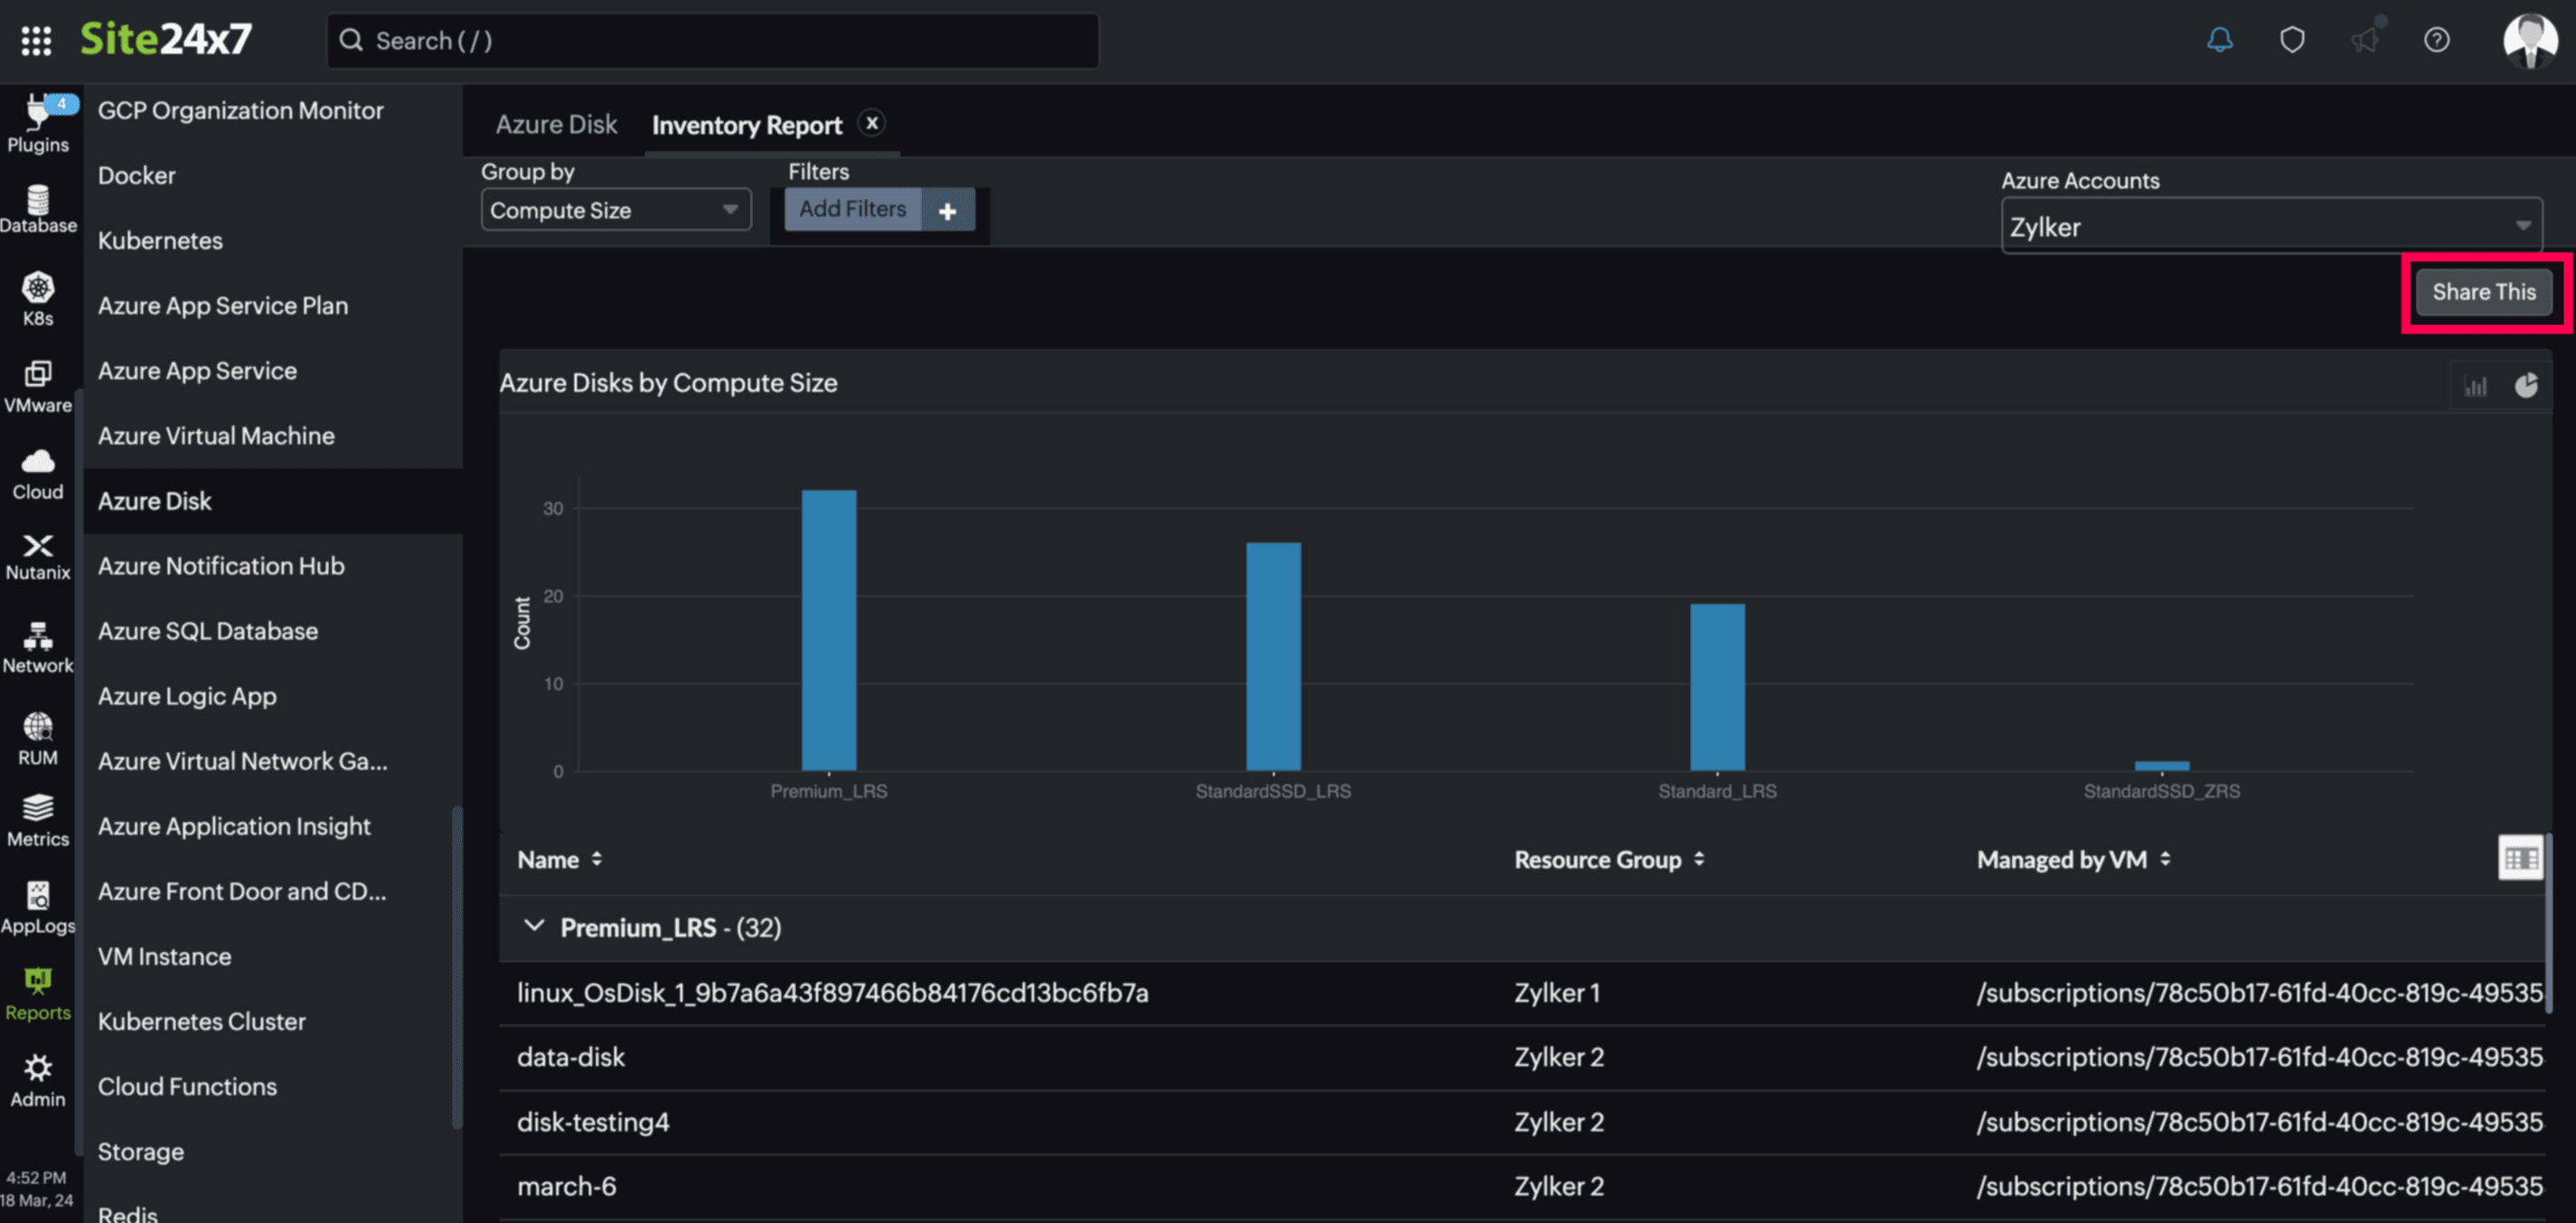
You can also schedule the Inventory Report by navigating to Reports > Azure Disk > Inventory Report and clicking the Share This button at the top-right corner. In the Schedule Report pop-up, choose the monitor, assign the desired frequency—daily, weekly, monthly, or quarterly—and receive the regular reports of your inventory details to the groups that you desire.

Site24x7 Azure Disk monitoring also provides an exclusive set of reports that will enable you to gain deeper insight into your resources.
These reports include:
- Disks by State
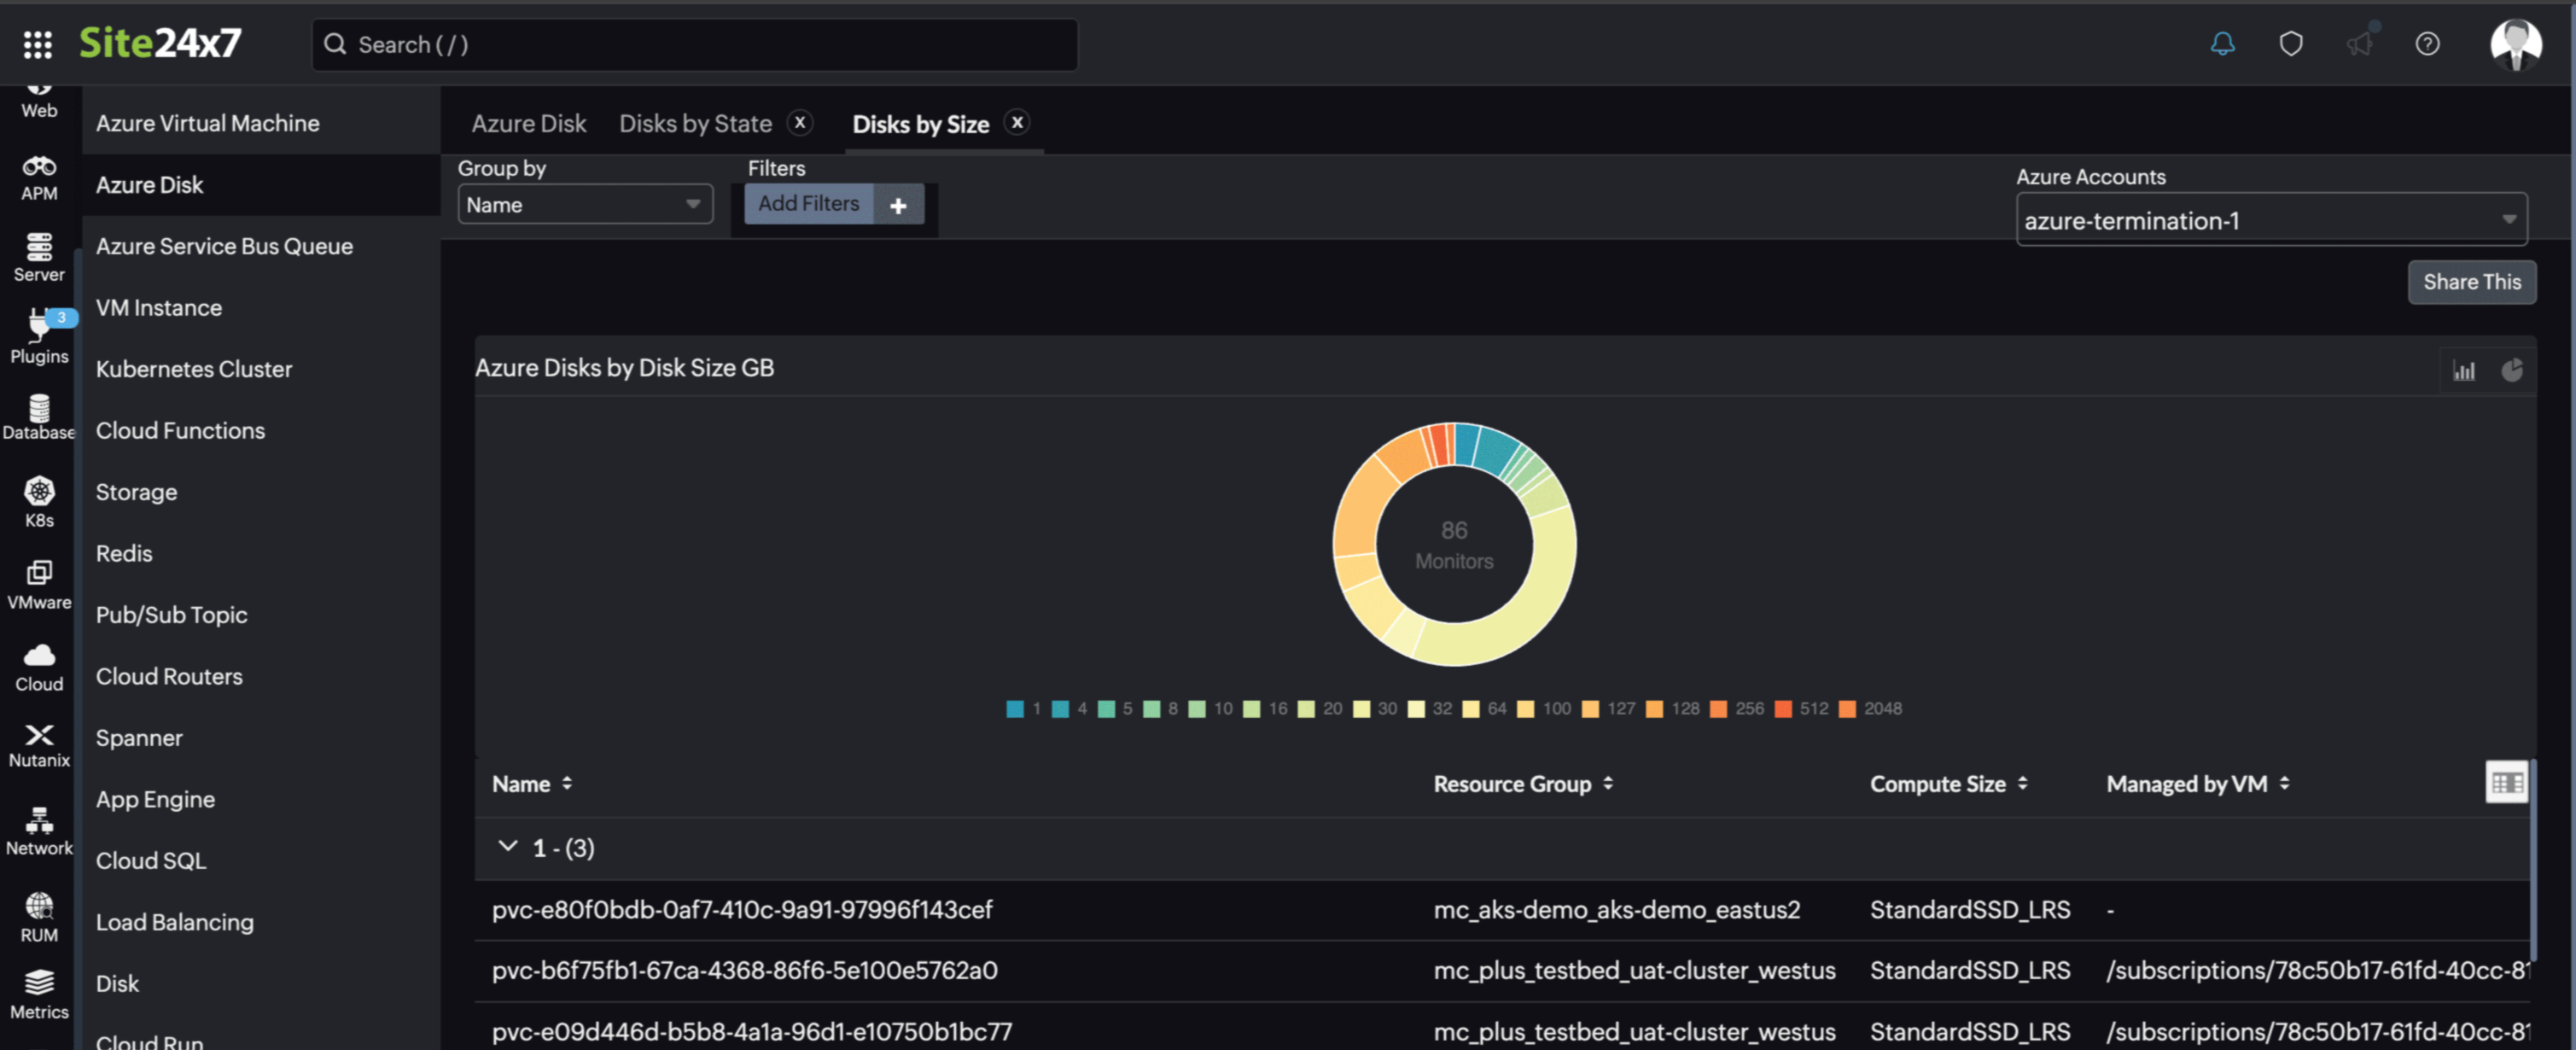
- Disks by Size
- Disks by Storage Type
- Disks by Tier
- Disks by Pricing Tier
- Disks by Max IOPS
- Disks by Max Throughput

Top N and bottom N reports
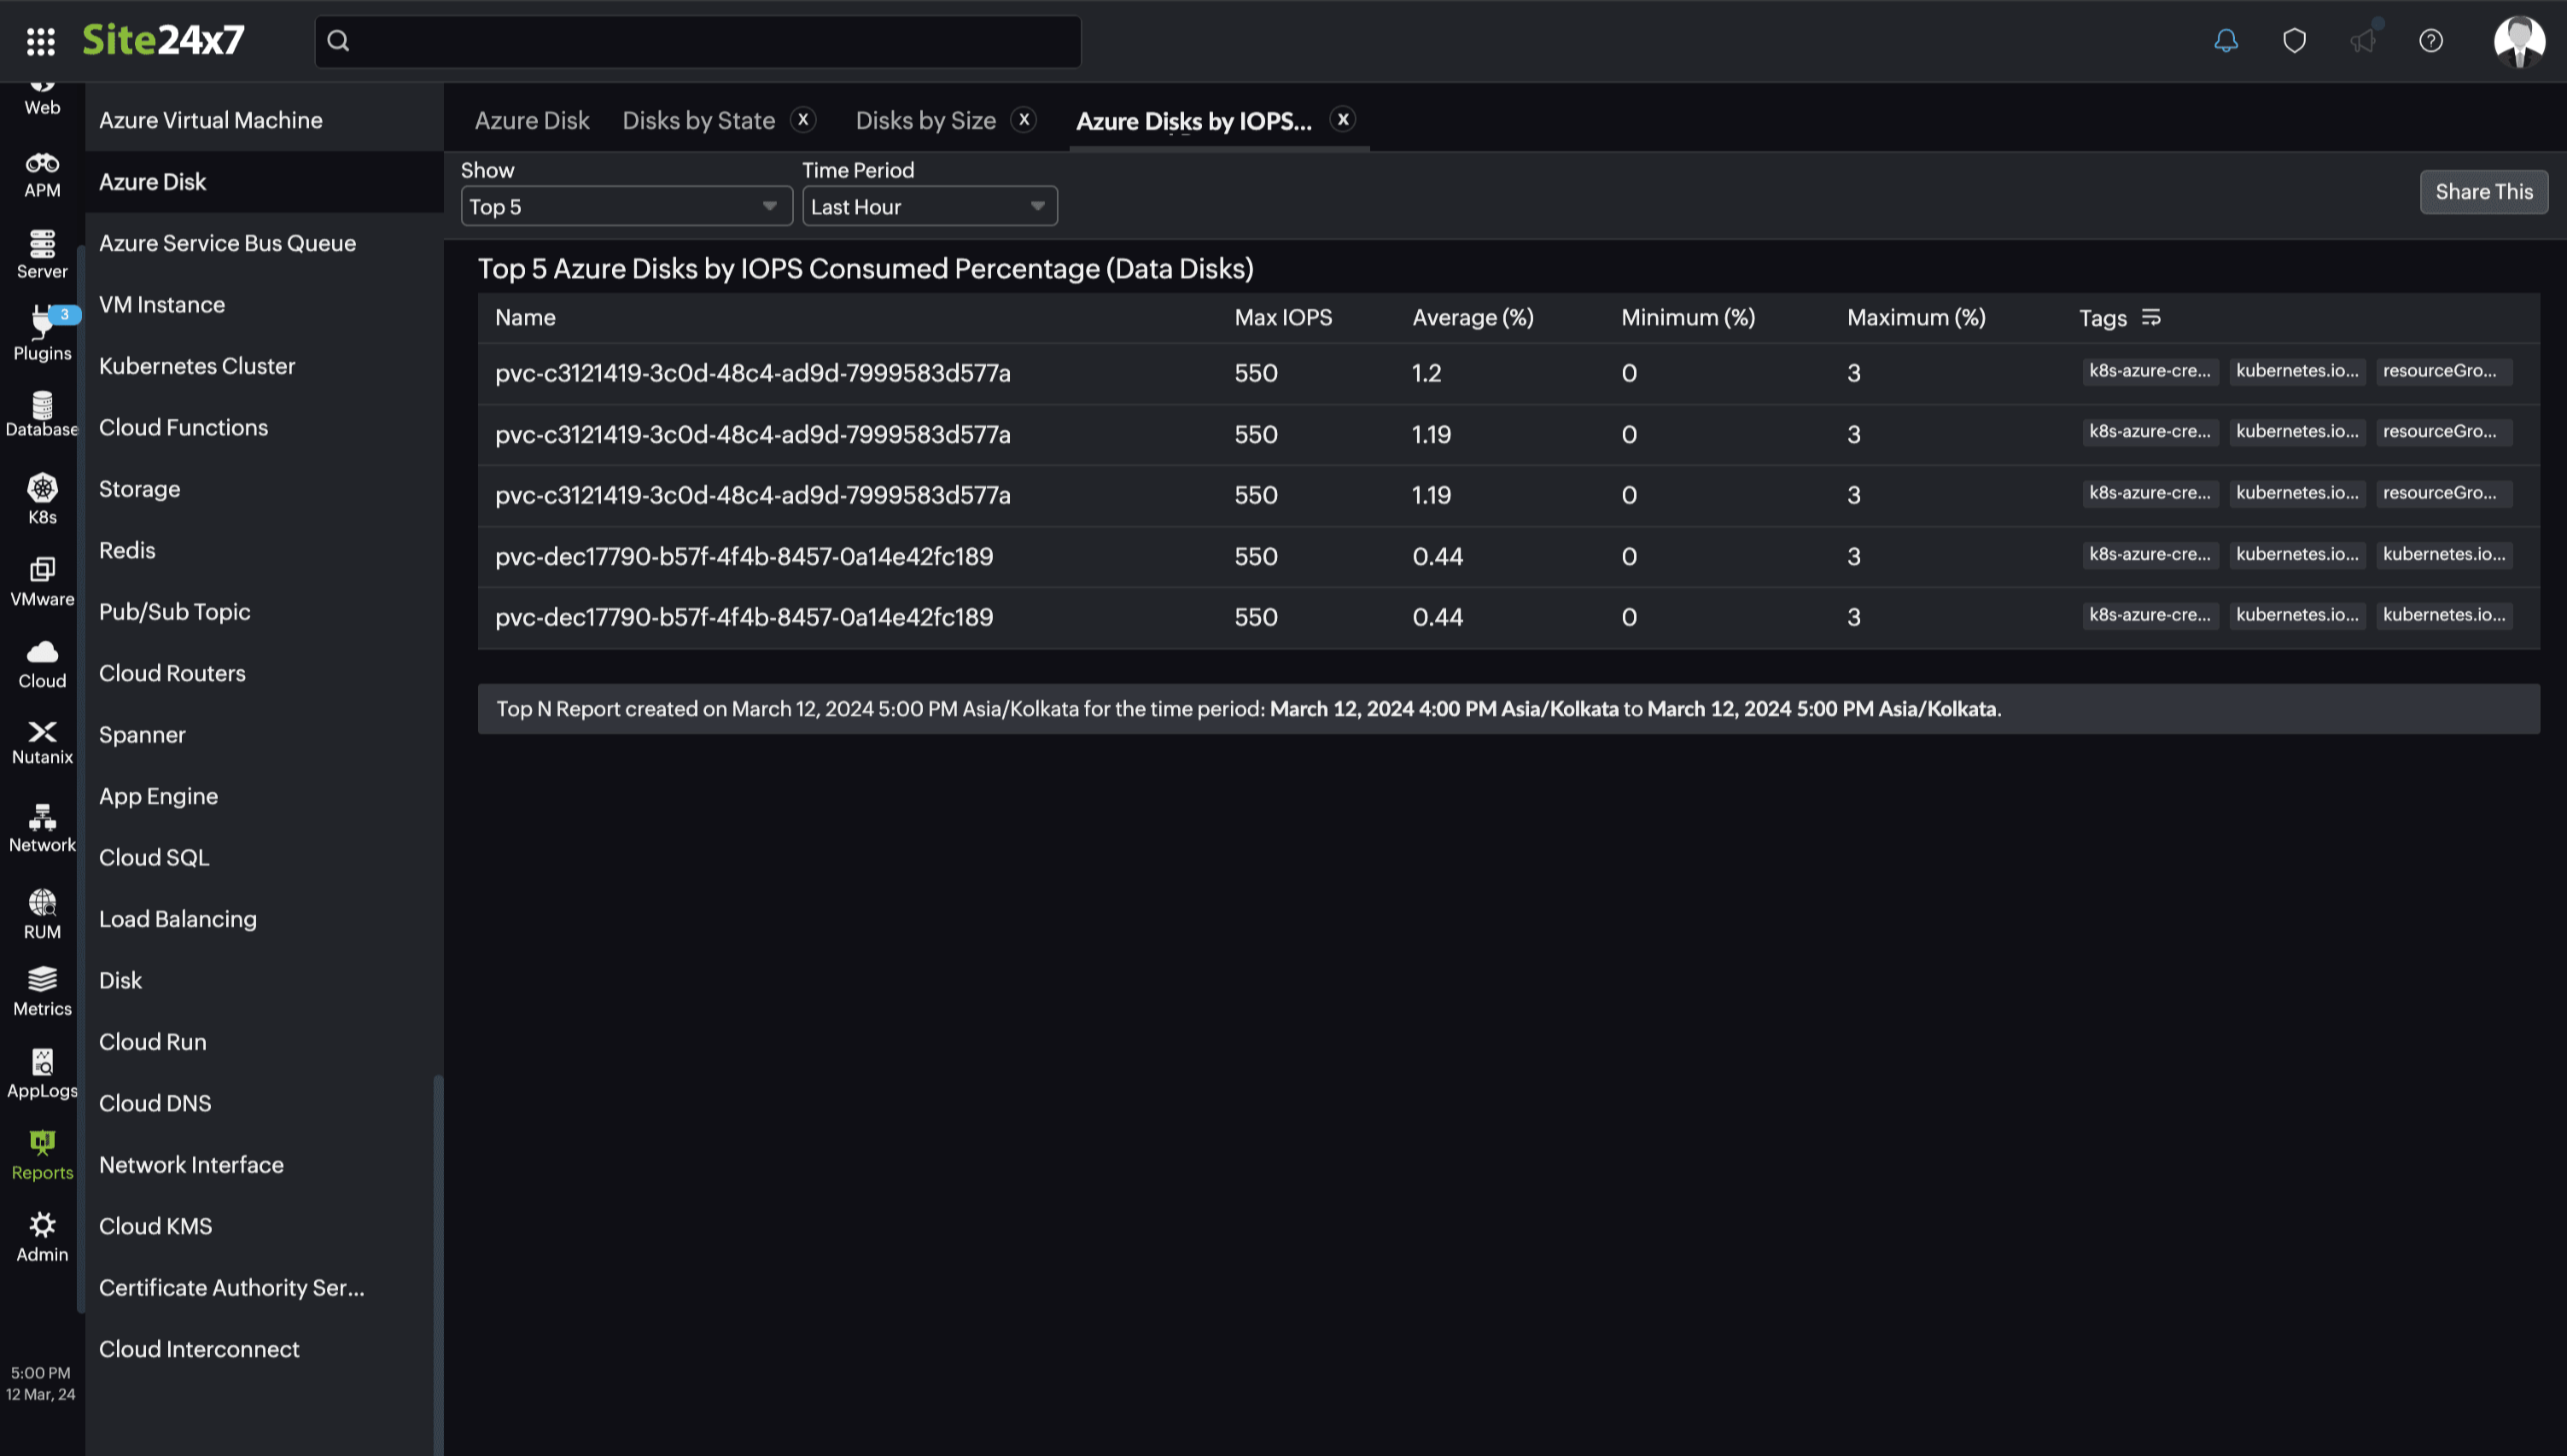
- Azure Disks by IOPS Consumed Percentage (Data Disks)
- Azure Disks by Bandwidth Consumed Percentage (Data Disks)
- Azure Disks by Used Burst IO Credits Percentage (Data Disks)
- Azure Disks by Used Burst BPS Credits Percentage (Data Disks)
- Azure Disks by IOPS Consumed Percentage (OS Disks)
- Azure Disks by Bandwidth Consumed Percentage (OS Disks)
- Azure Disks by Used Burst IO Credits Percentage (OS Disks)
- Azure Disks by Used Burst BPS Credits Percentage (OS Disks)
- Azure Disks by Disk On-demand Burst Operations (Preview)

You can also view the reports from the Performance tab of the Azure Disk Monitor.
Go to the Performance tab of the Azure Disk Monitor, and get the Availability Summary Report of the monitor by clicking on Availability.
You can also find the Performance Report of the monitor by clicking on any chart title.
Related links
How to add an Azure monitor.
How to integrate Azure Virtual Machine monitor.
How to integrate Azure Network Interface monitor.
How to integrate an Azure App Service monitor.
How to configure IT automations for a monitor.
