Thread Dump Analysis
Simplify performance issue troubleshooting with our Thread Dump Analysis feature, which offers insights such as thread states, stack traces, and resource usage into your multi-threaded applications. This allows developers to identify and resolve bottlenecks and deadlocks efficiently.
Use case: Proactive production performance management
Utilize the Thread Dump Analysis feature in Site24x7 to proactively manage the performance of your production environment. Regularly capture thread dumps and examine the data to identify bottlenecks, resolve deadlocks, monitor garbage collection, and investigate exceptions. By leveraging comprehensive analysis tools, like Flame Graphs and Call Stack Trees, you can take preventive actions before performance issues impact end users. Address any performance issues promptly and optimize your application's code and resource usage to ensure a smooth user experience.
Thread dump metrics
To obtain thread dump metrics:
- Log in to your Site24x7 web client.
- Navigate to APM > Select your application > Thread Profiles.
Note- You need to perform Thread Profiling to get the thread dump summary.
- You can also implement automated thread profiling using IT automation.
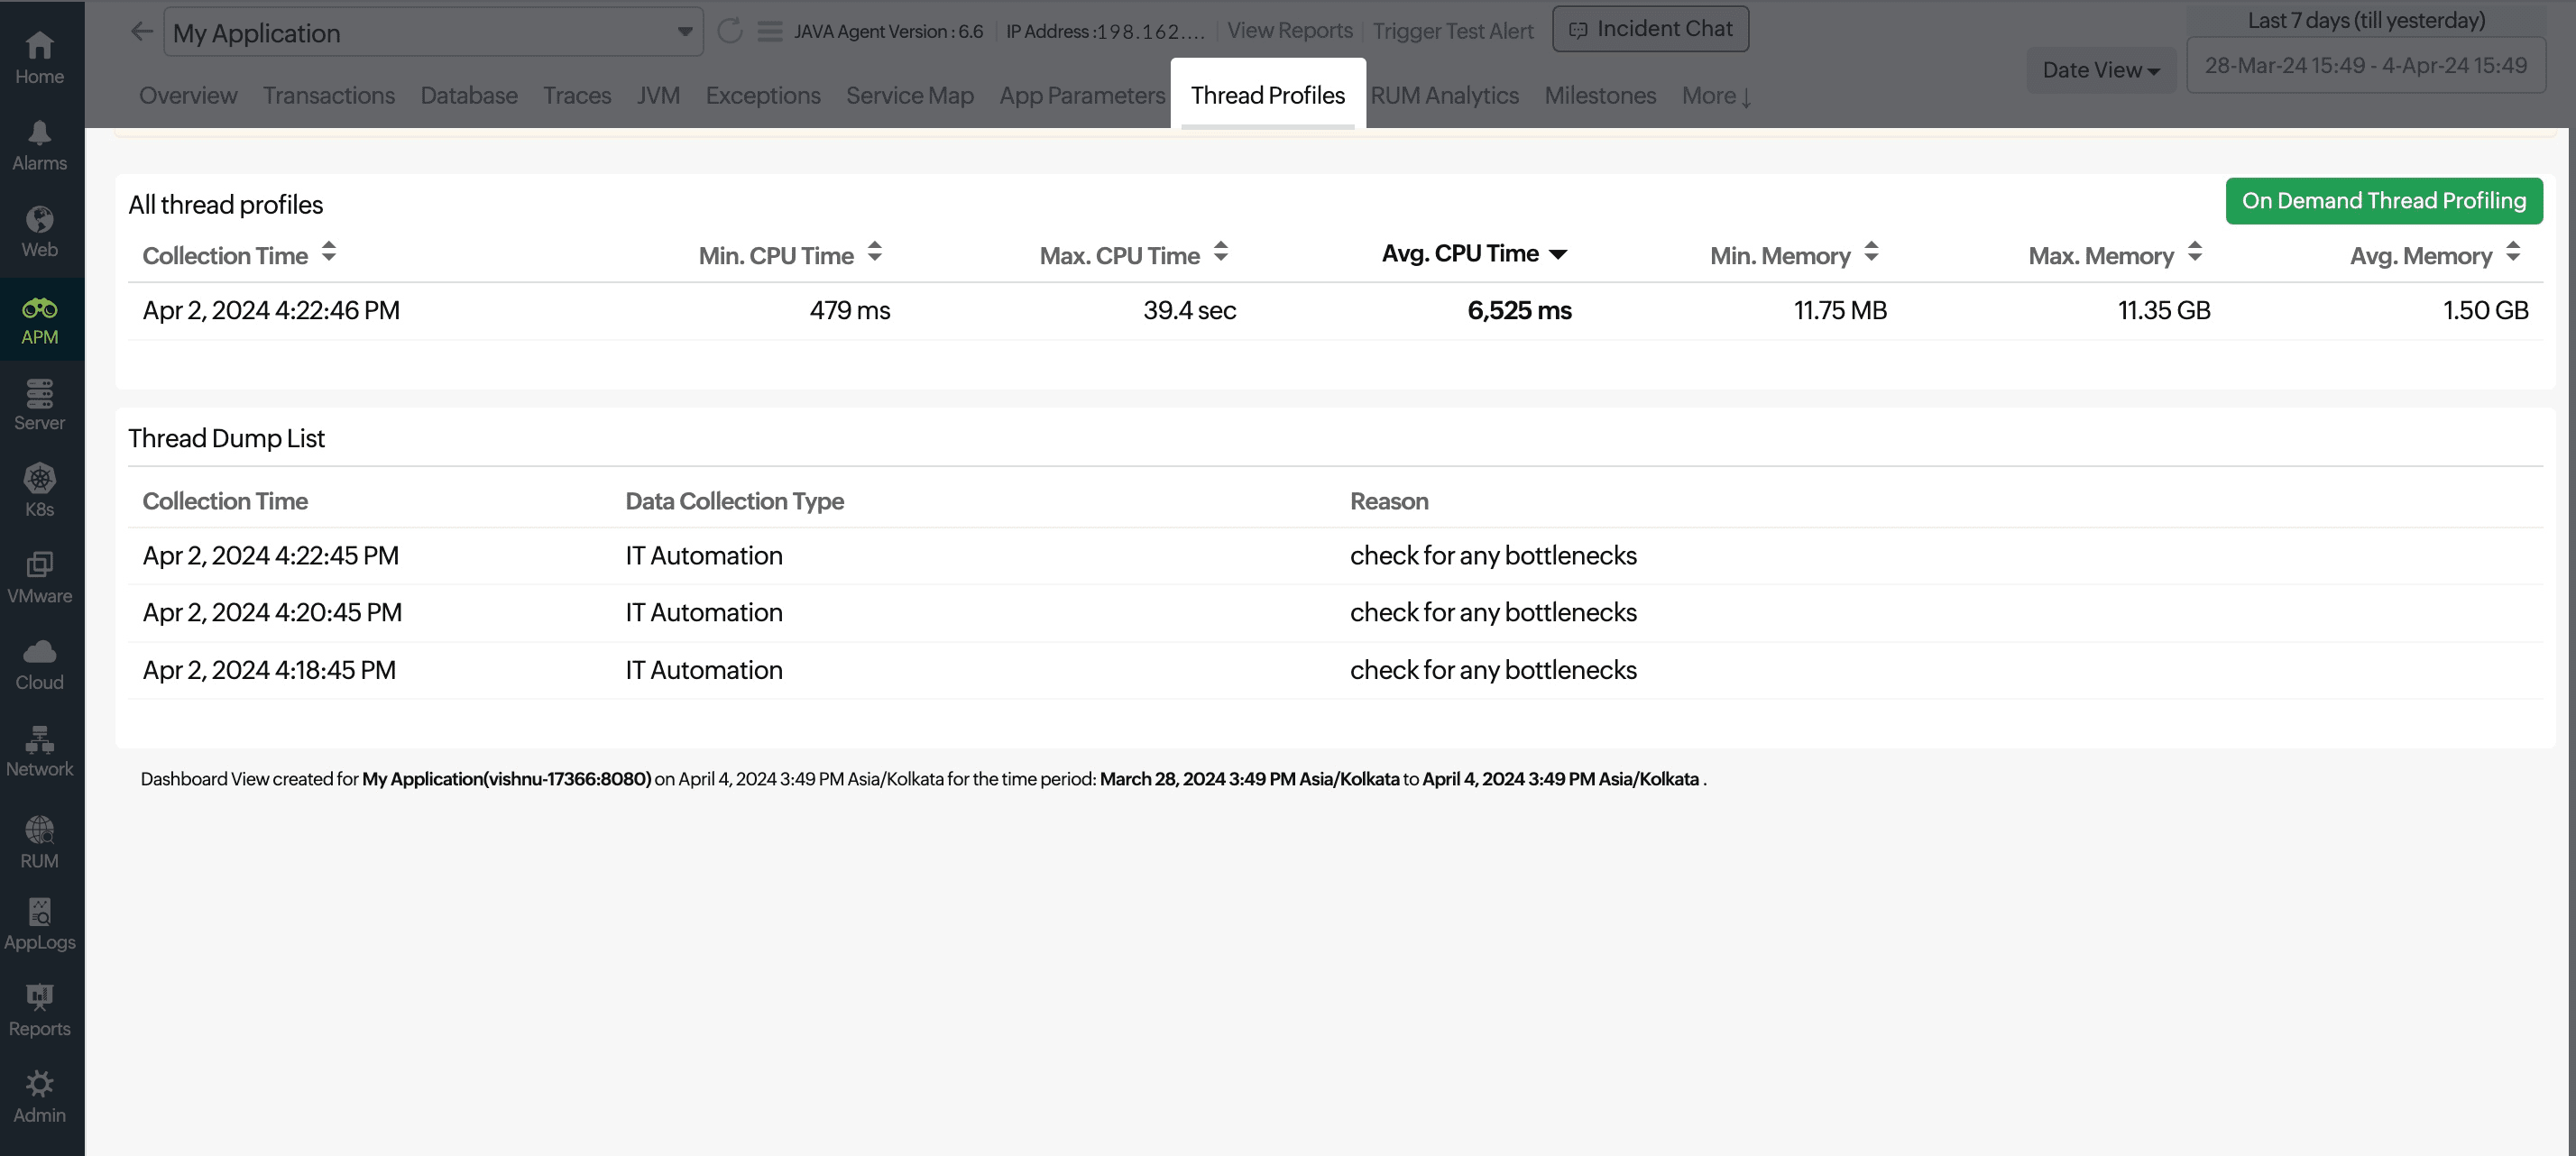
- Click the desired thread dump from the Thread Dump List.
Various parameters and metrics can be obtained by accessing the following tabs:
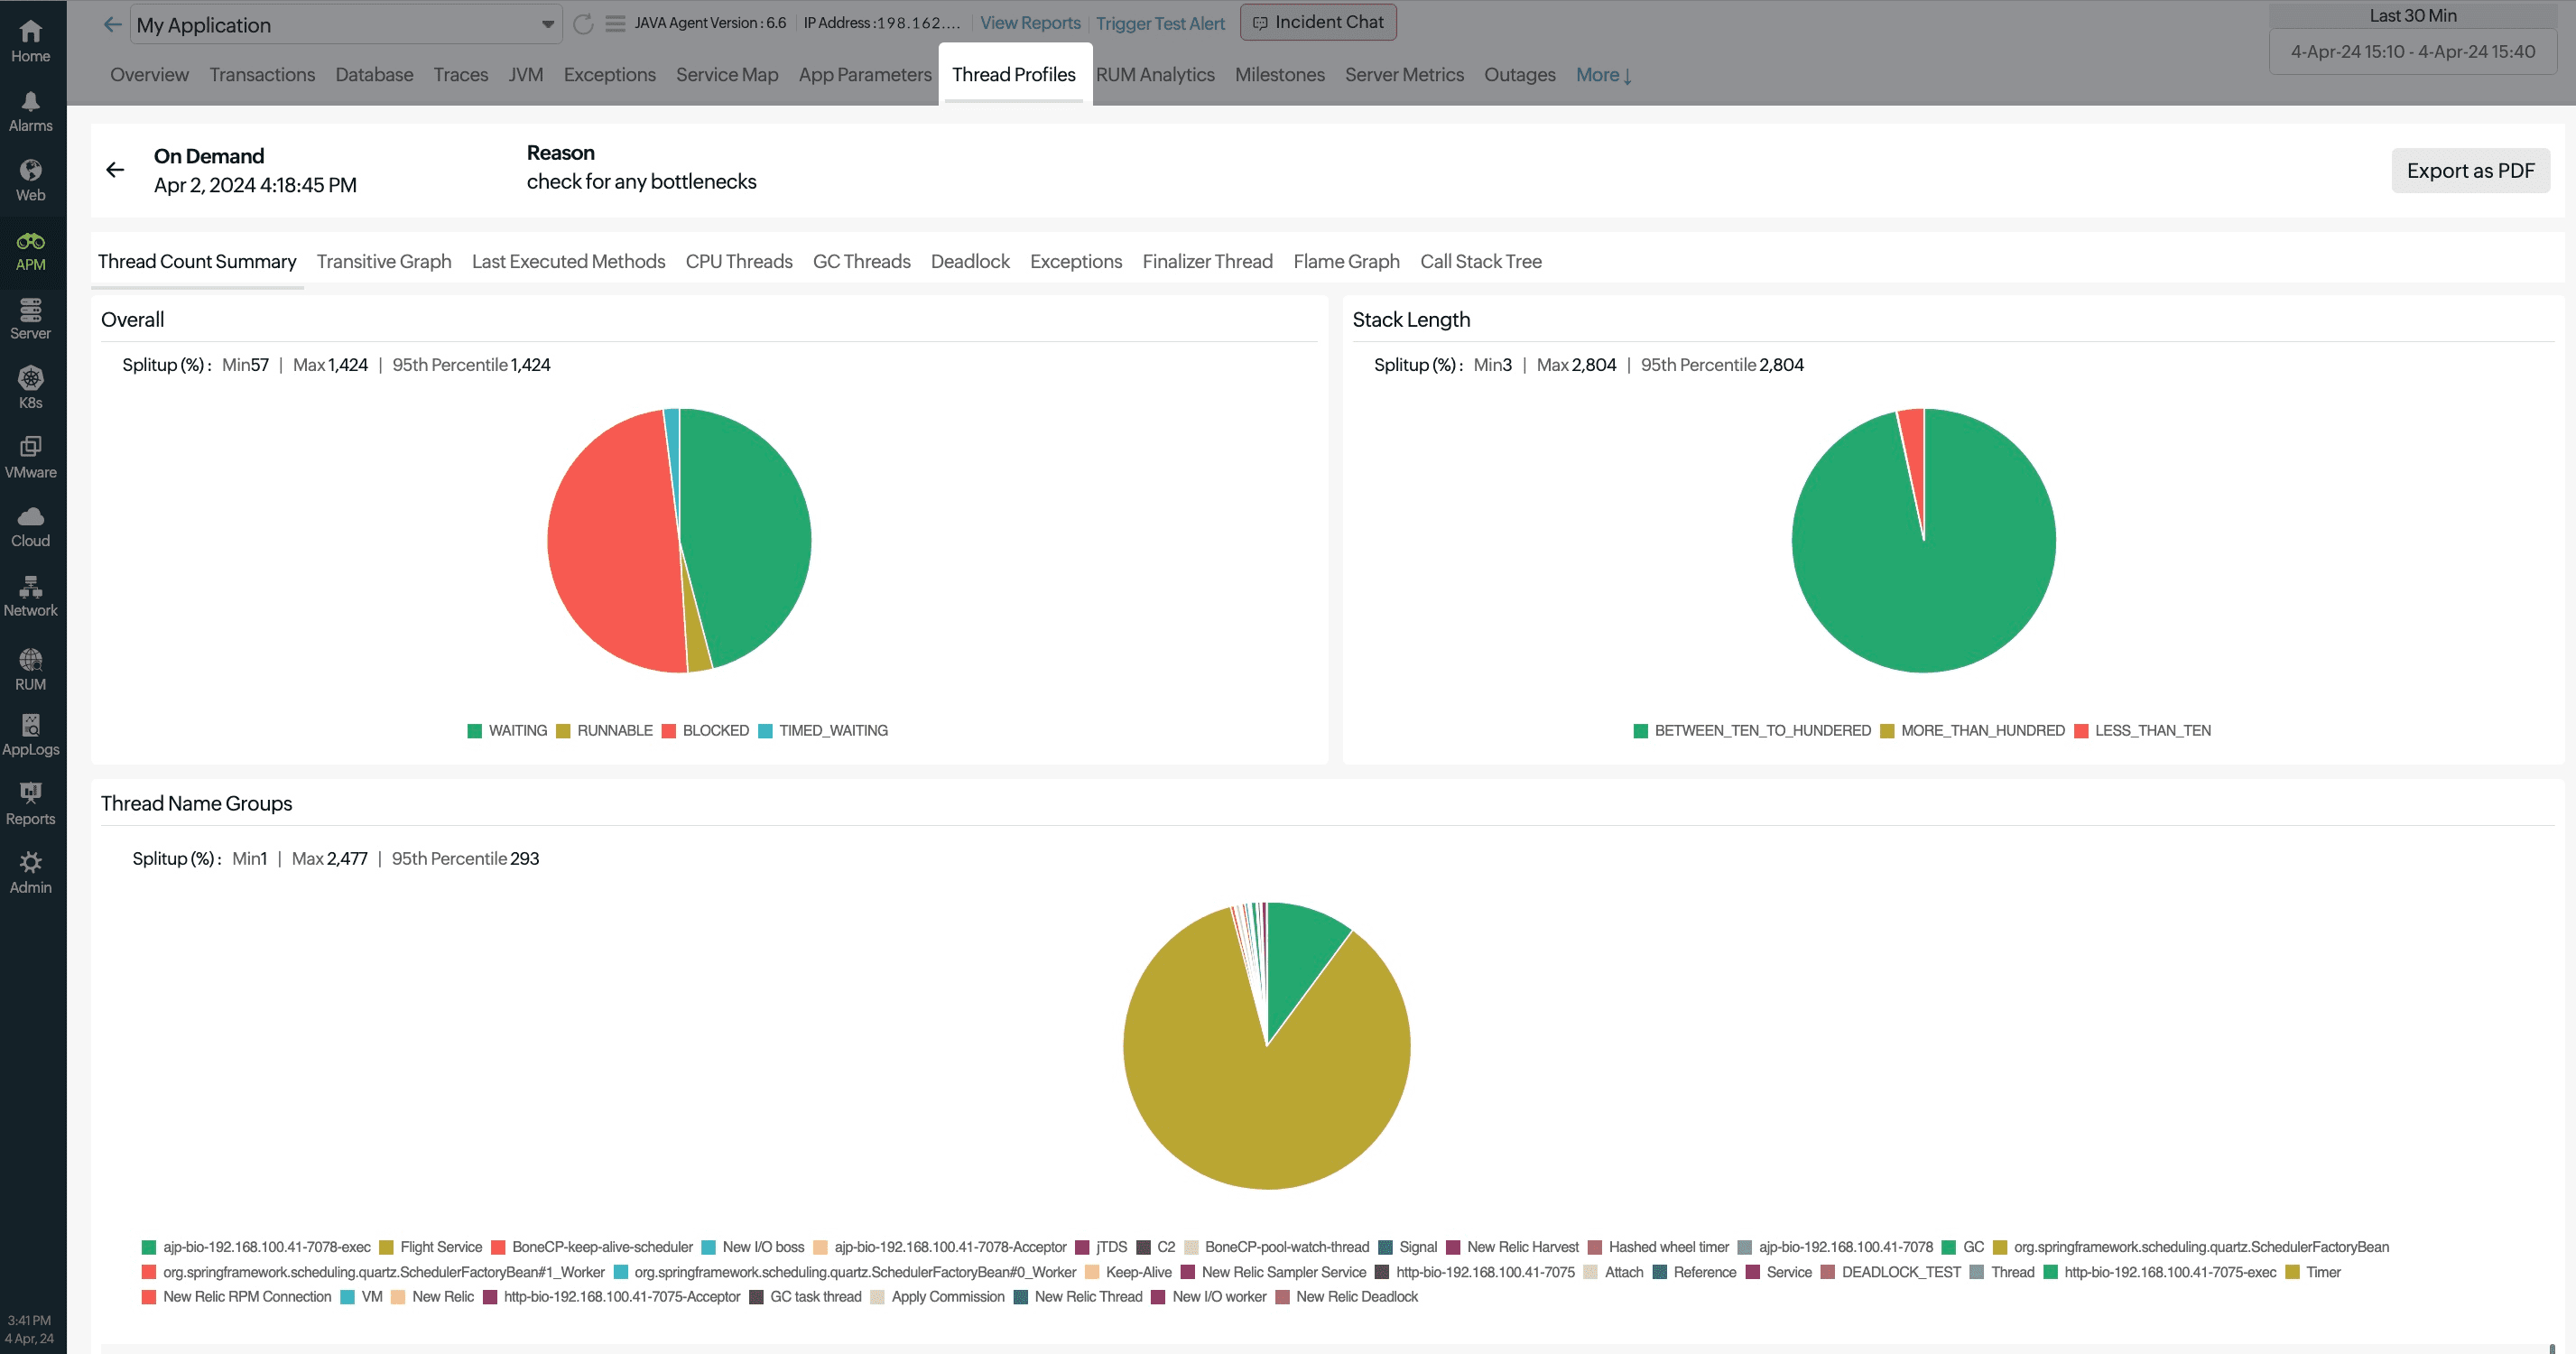
Thread Count Summary
This metric gives an overall summary of the threads involved in the given thread dump.
The Overall section presents the percentage breakdown of threads based on their states, including TIMED_WAITING, BLOCKED, RUNNABLE, and WAITING.
The Stack Length chart gives the percentage breakdown of threads based on their length, like LESS_THAN_TEN, BETWEEN_TEN_TO_HUNDRED, and MORE_THAN_HUNDRED.
The Thread Name Groups chart displays the distribution of various thread groups in the thread dump, with threads categorized according to their names.
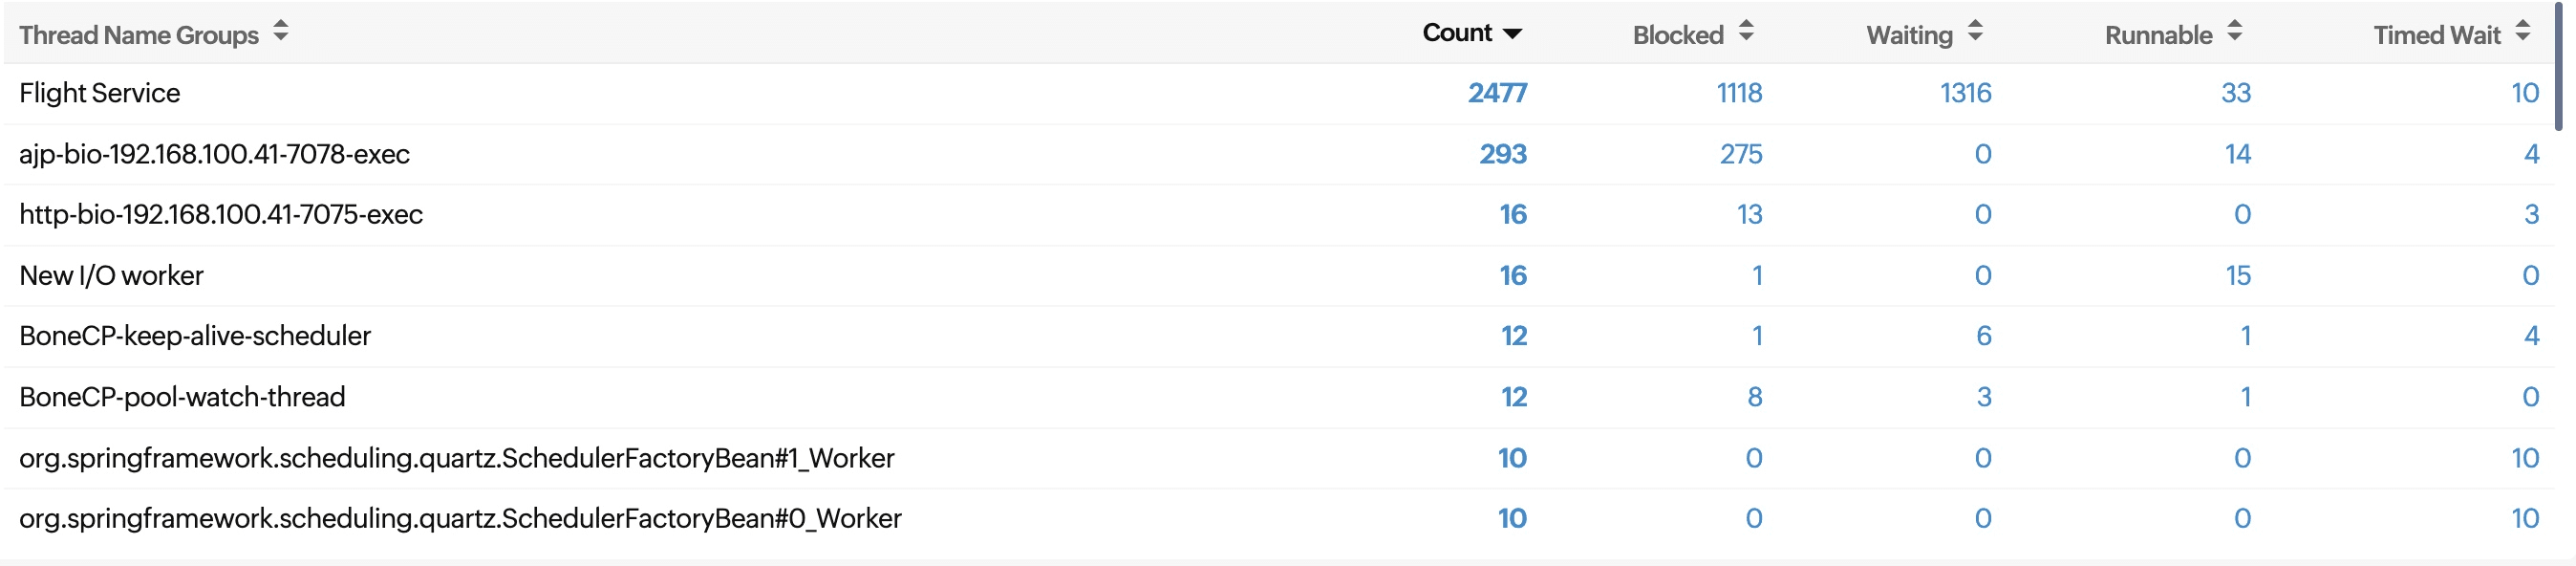
In the following section, the total thread count and the number of threads in various states (Blocked, Waiting, Runnable, and Timed Wait) are presented for each group. You can click any count to analyze it further.
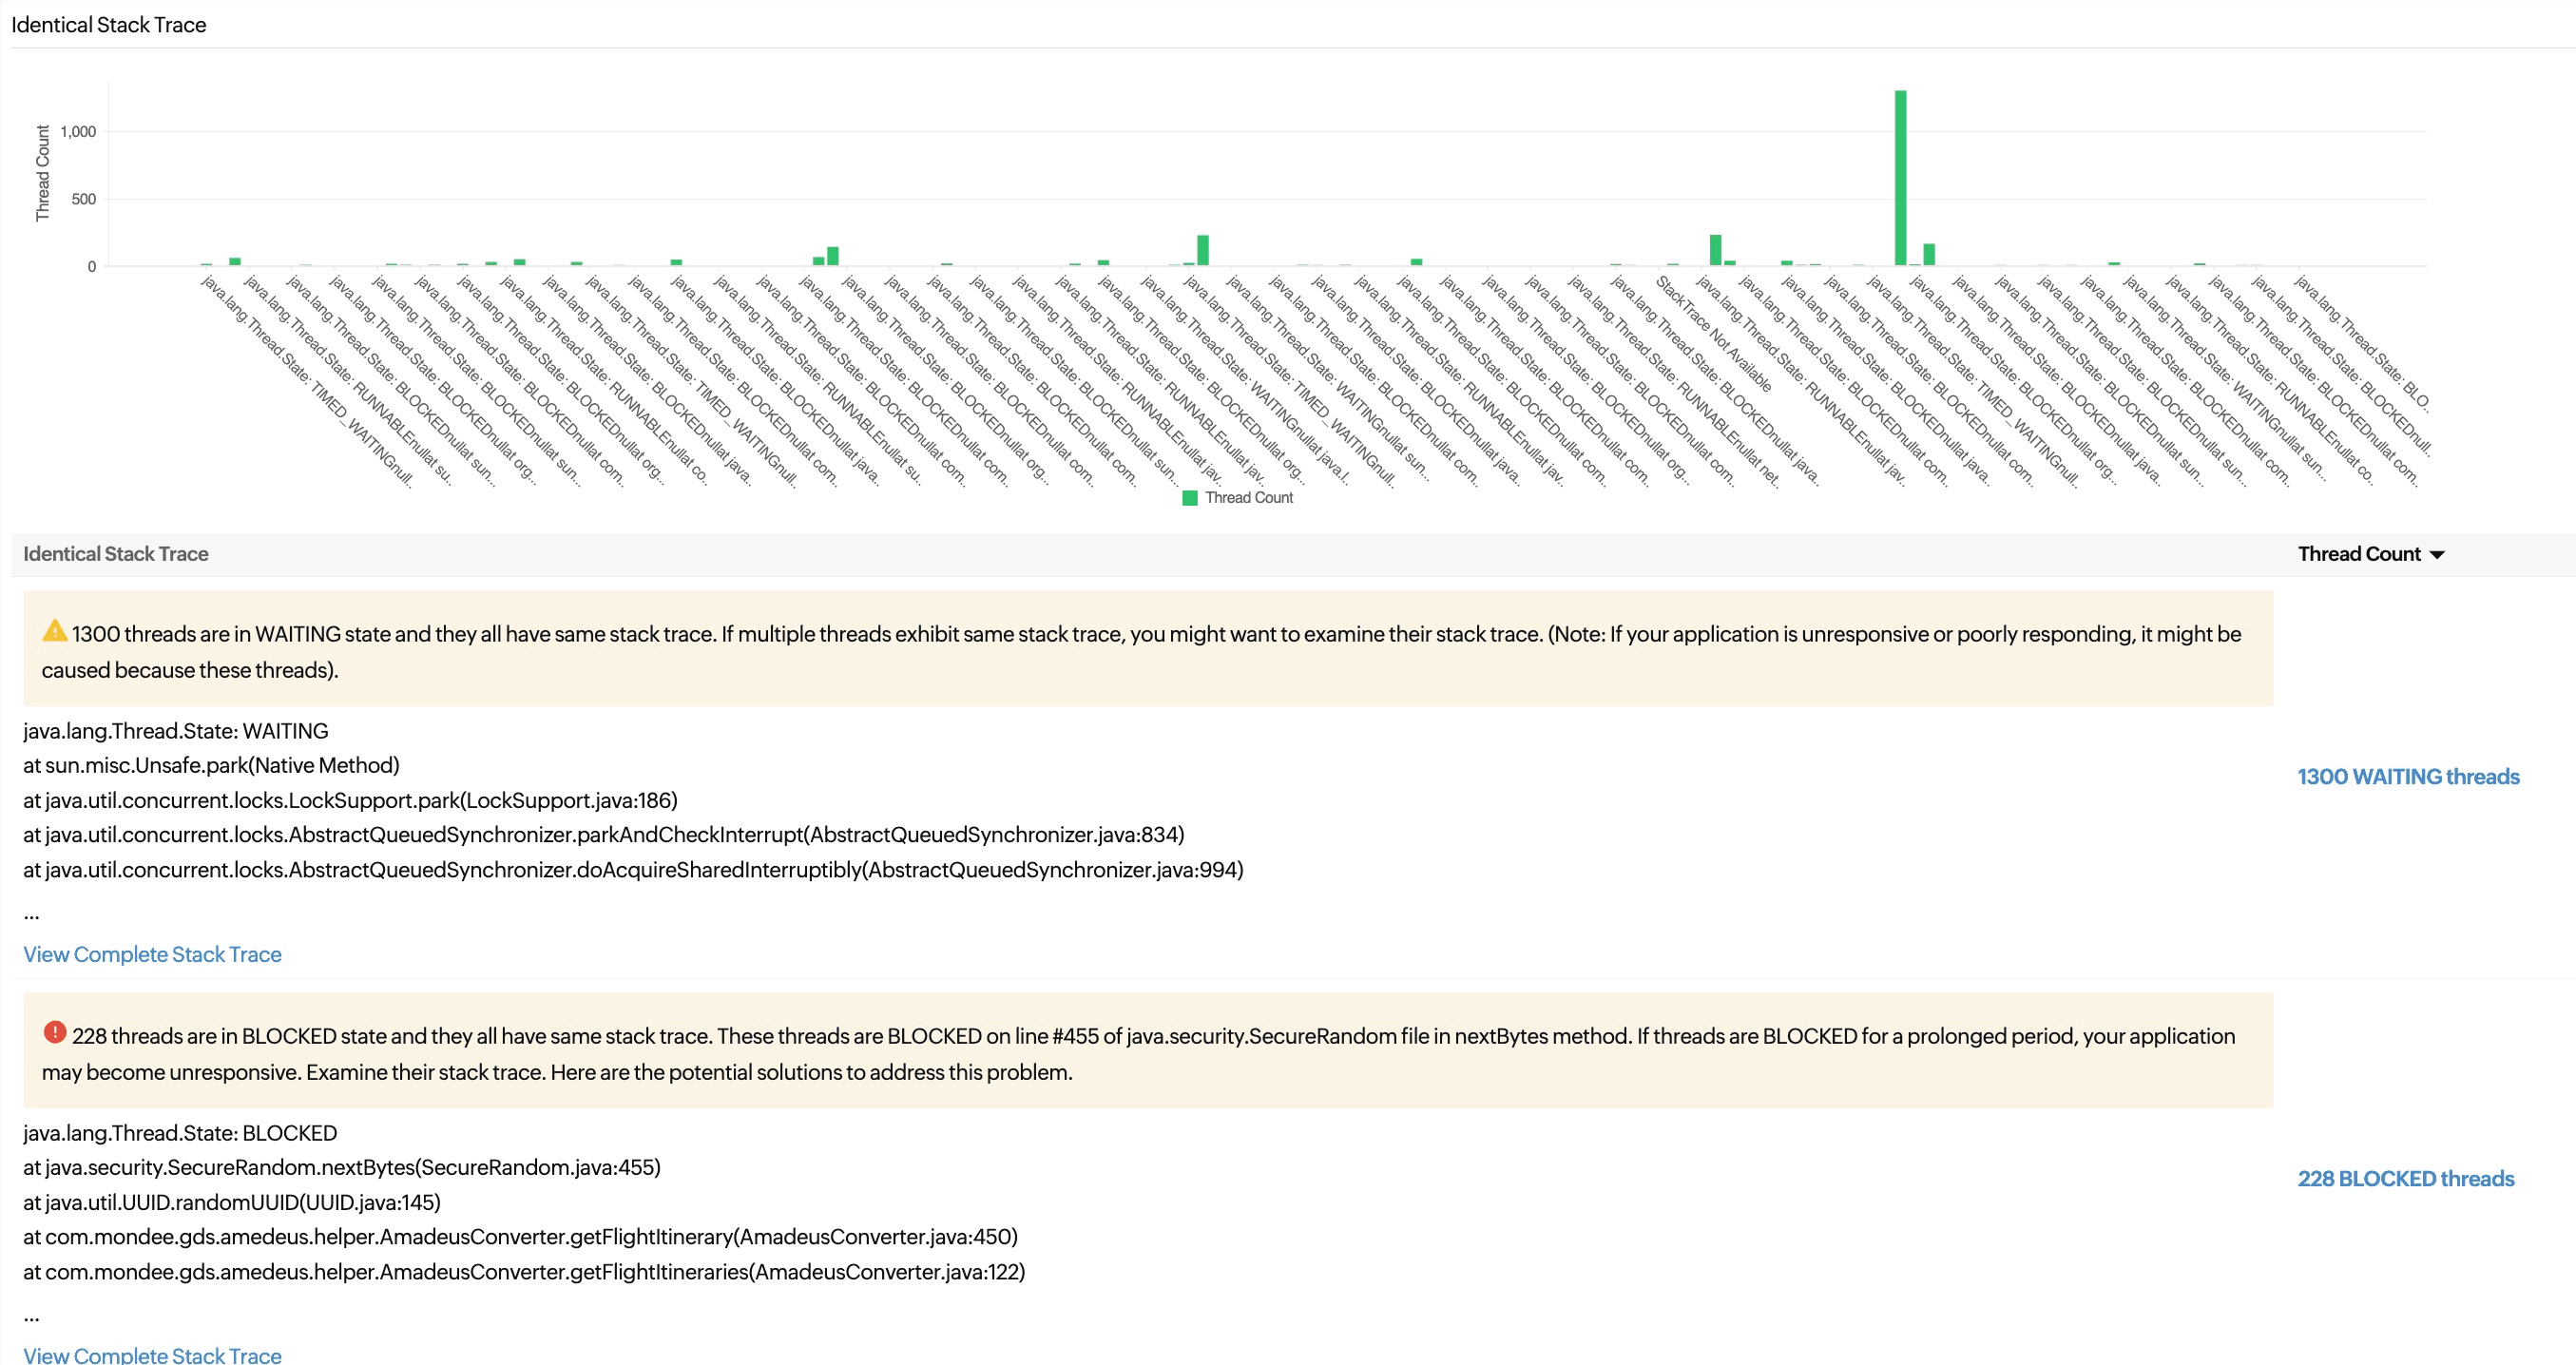
The Identical Stack Trace chart shows the split-up of thread groups, with threads grouped together if they share the stack trace.
The last section provides a list of identical stack traces.
Transitive Graph
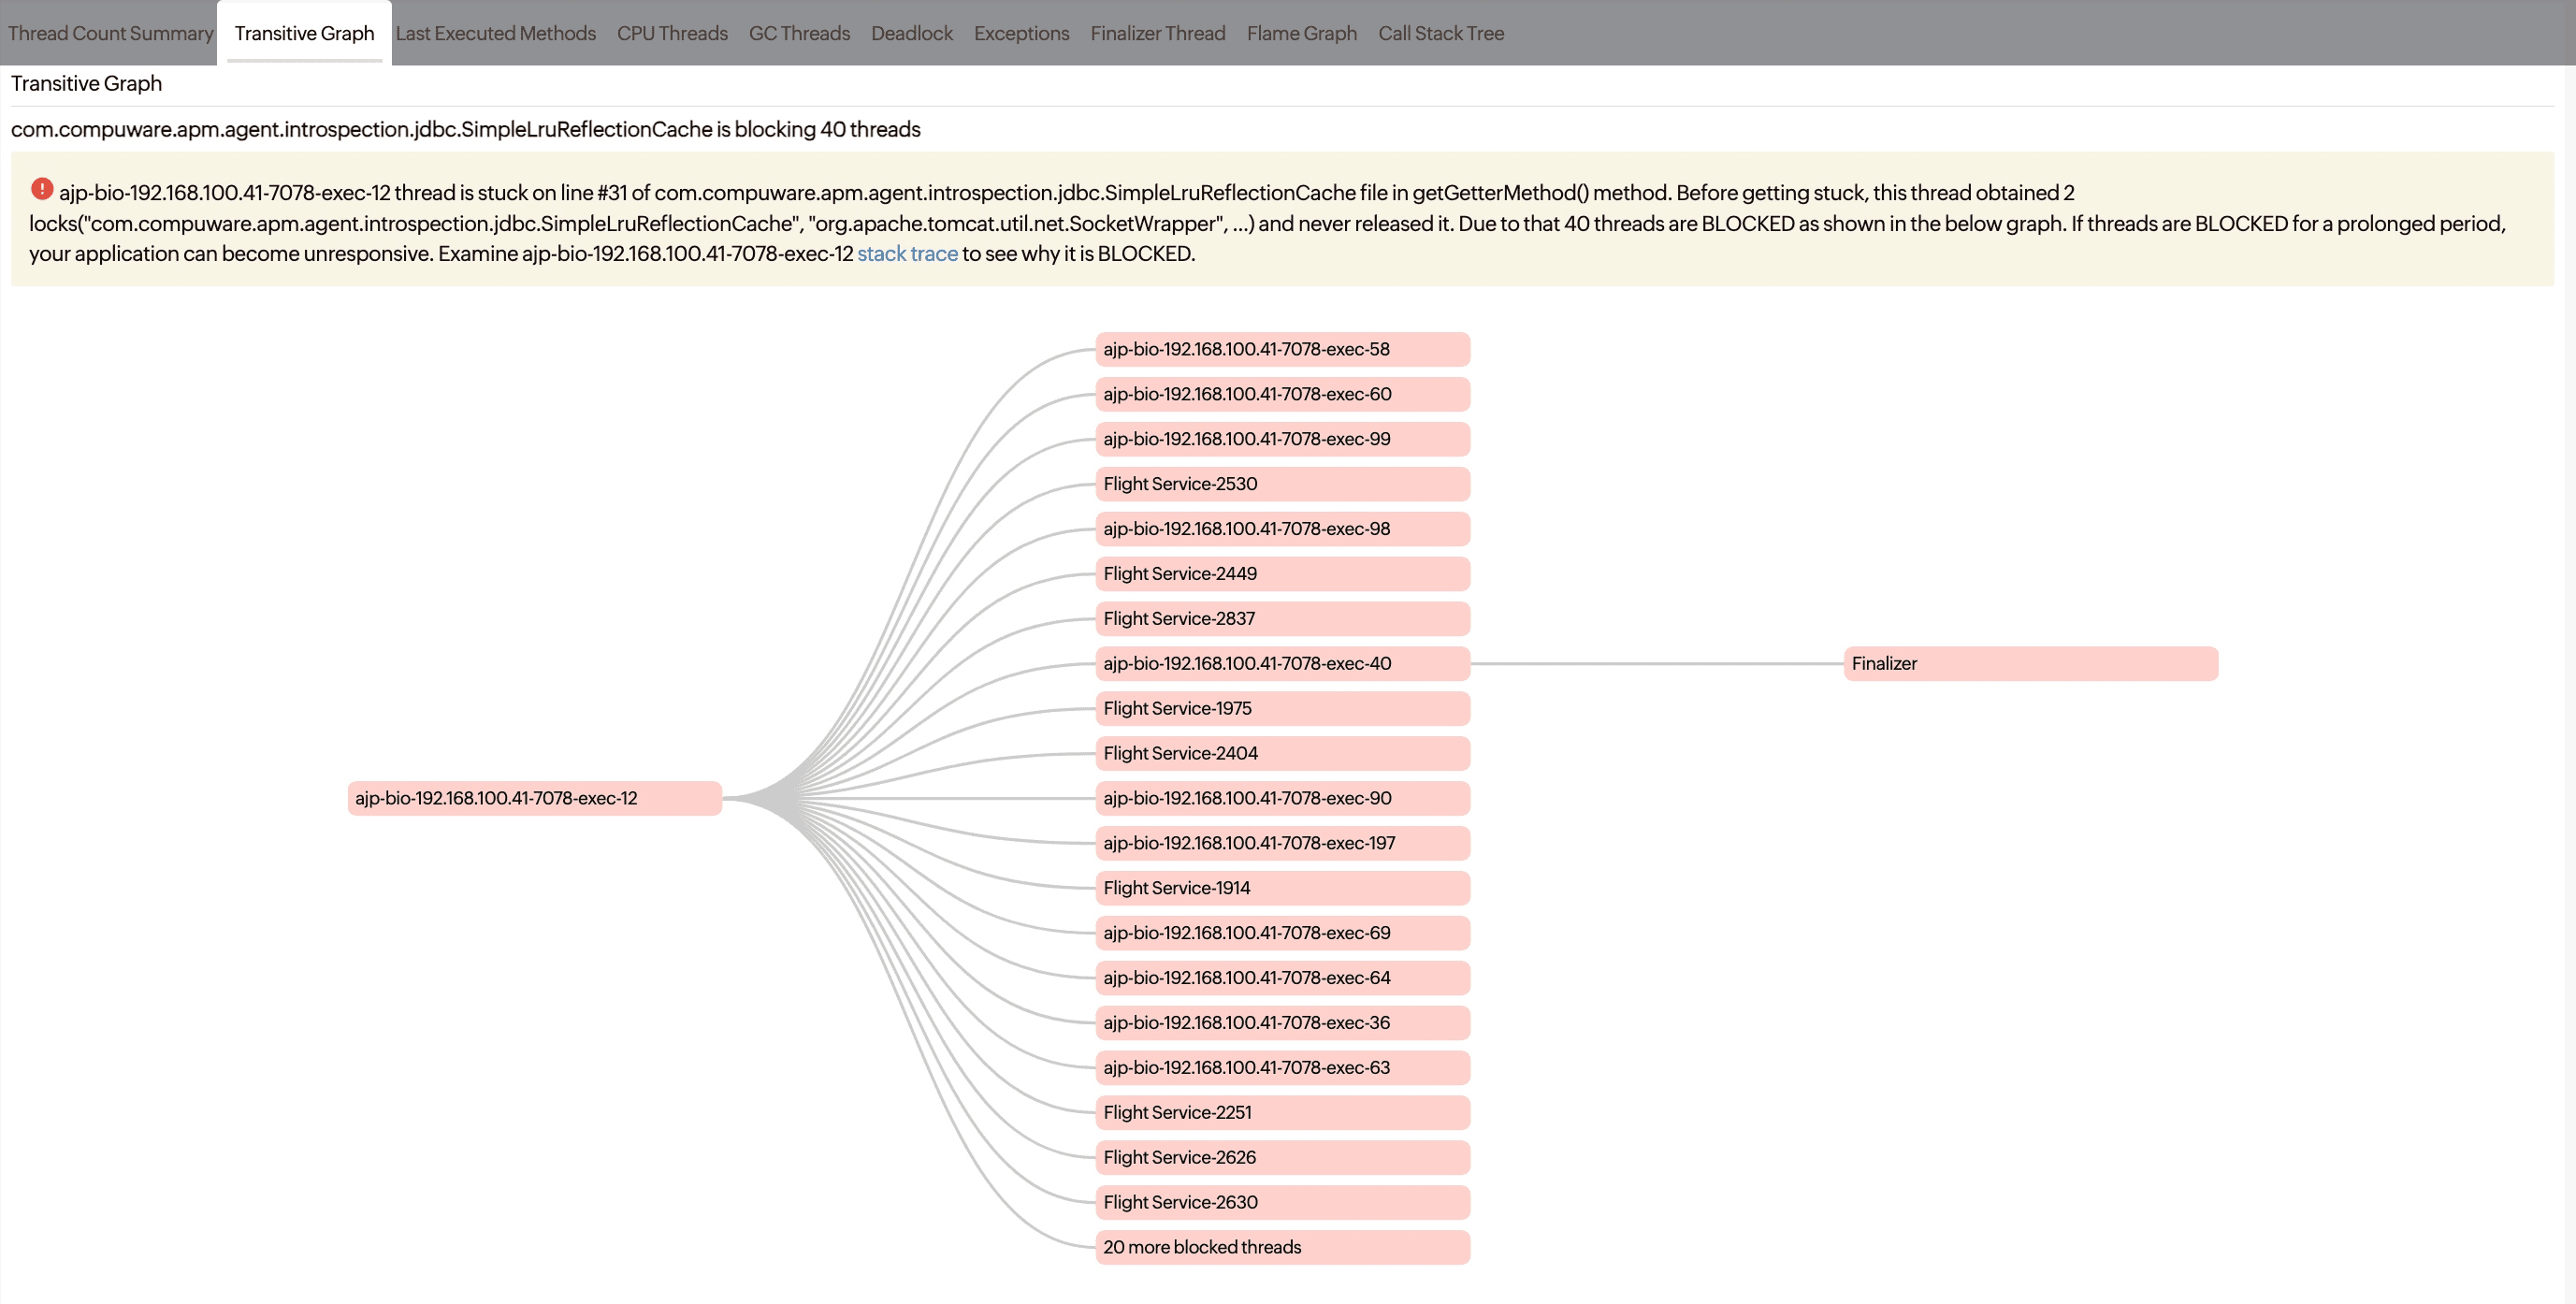
The Transitive Graph illustrates the connections between threads in a multi-threaded application, aiding in the identification of the main thread blocking other threads. Clicking the required thread name will show the respective stack trace.
Last Executed Methods
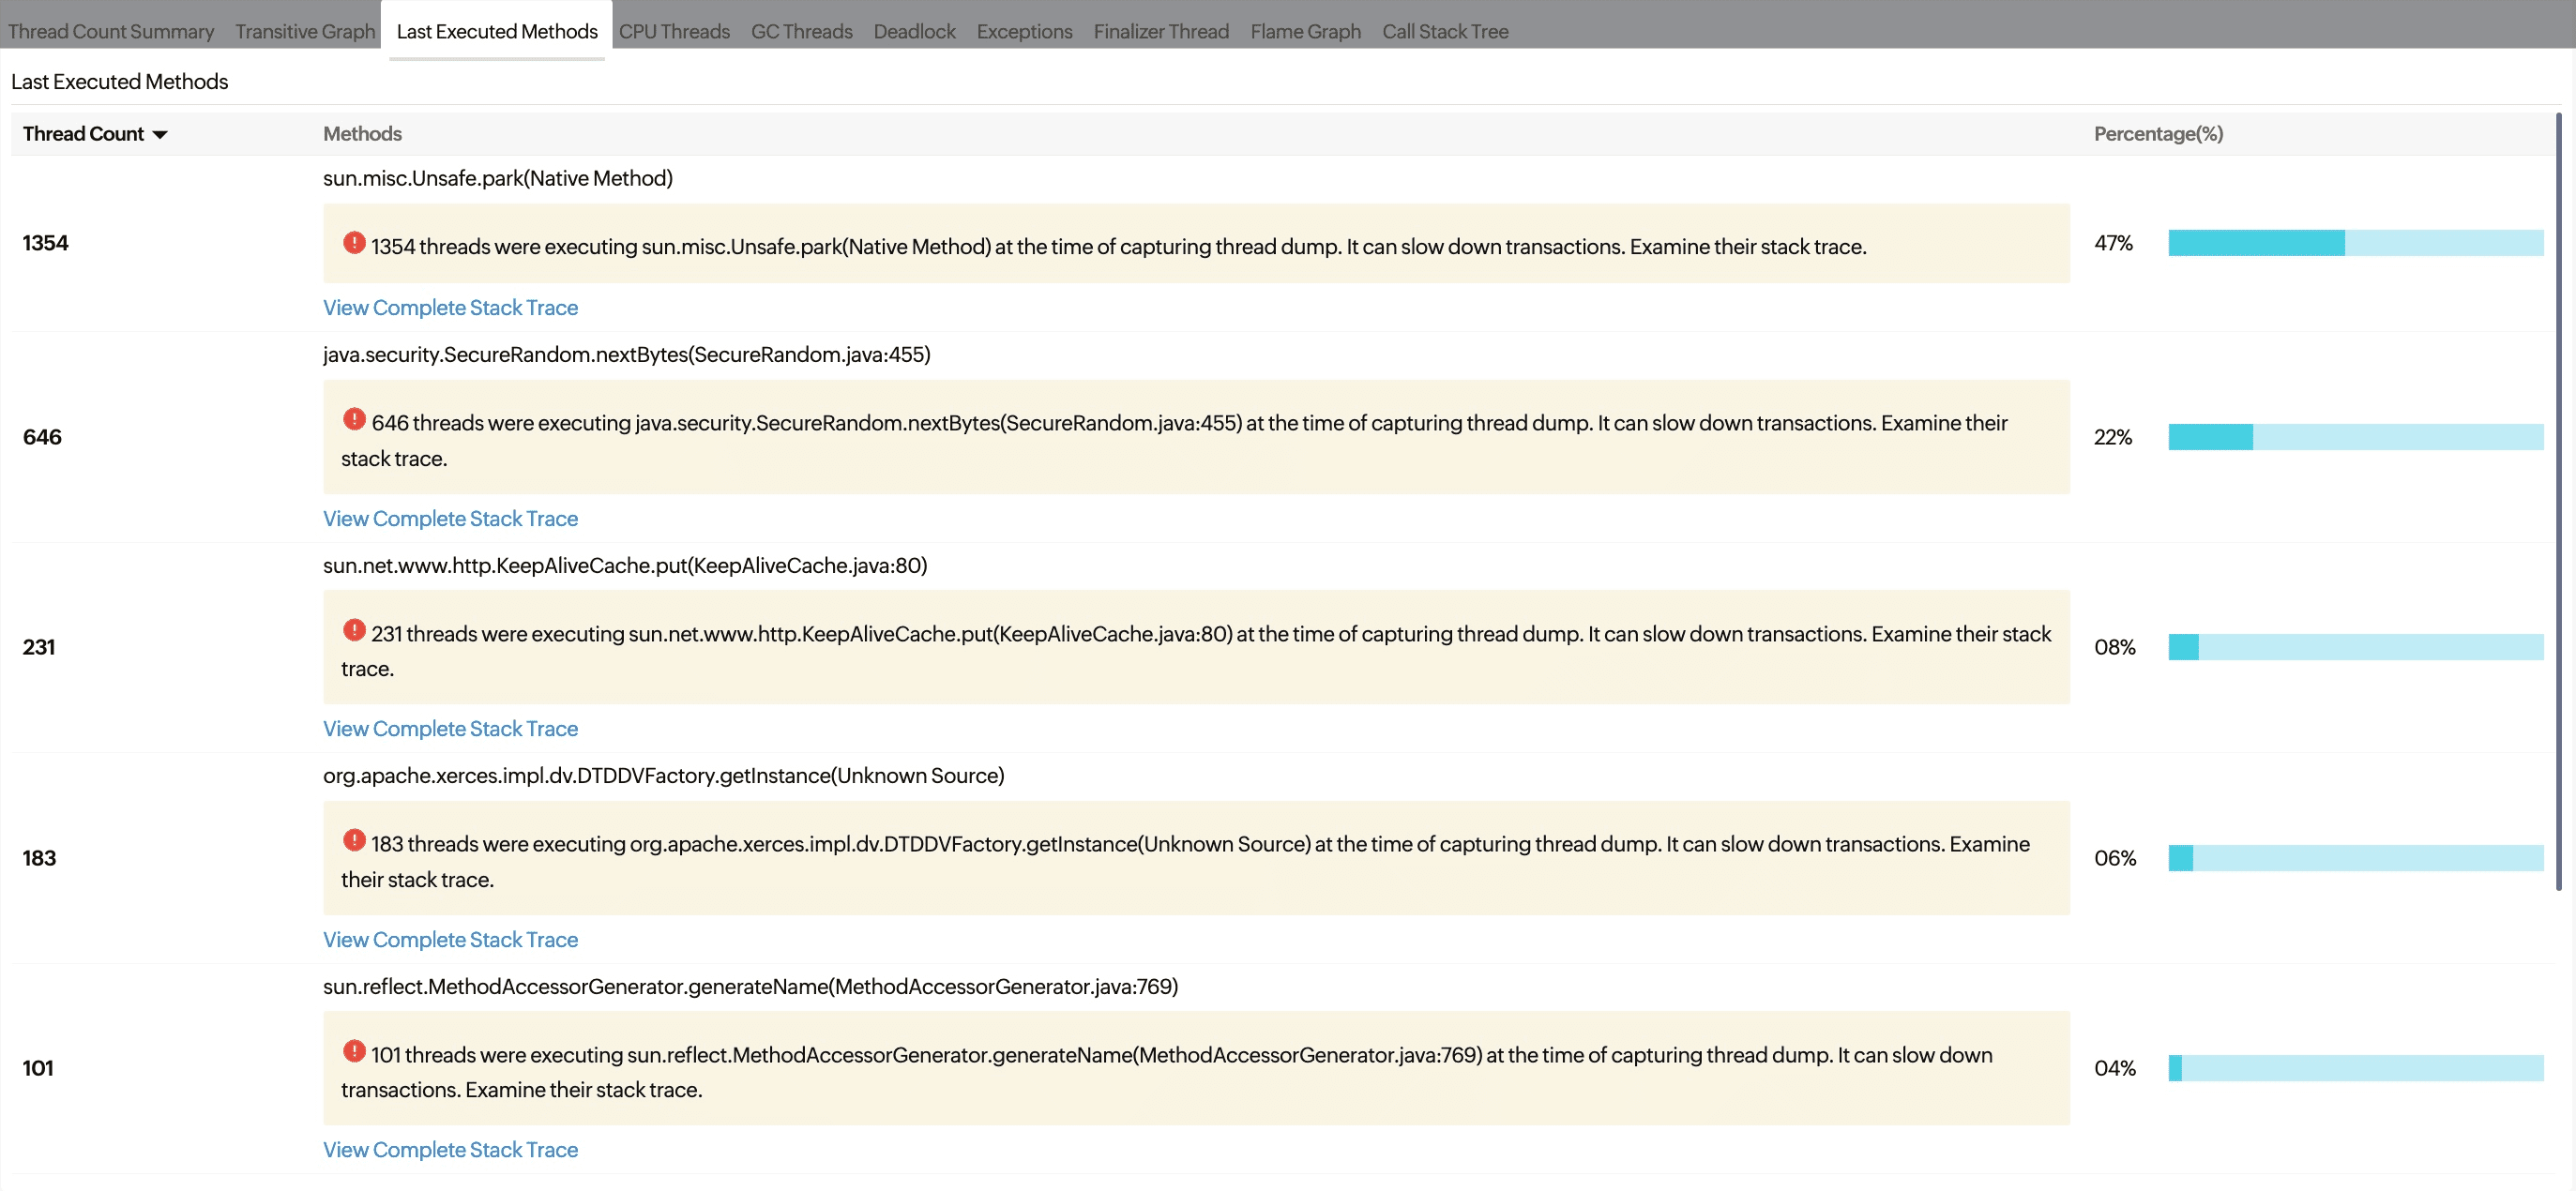
The Last Executed Methods tab shows the executed methods in descending order, along with the corresponding Thread Count and its Percentage.
CPU Threads
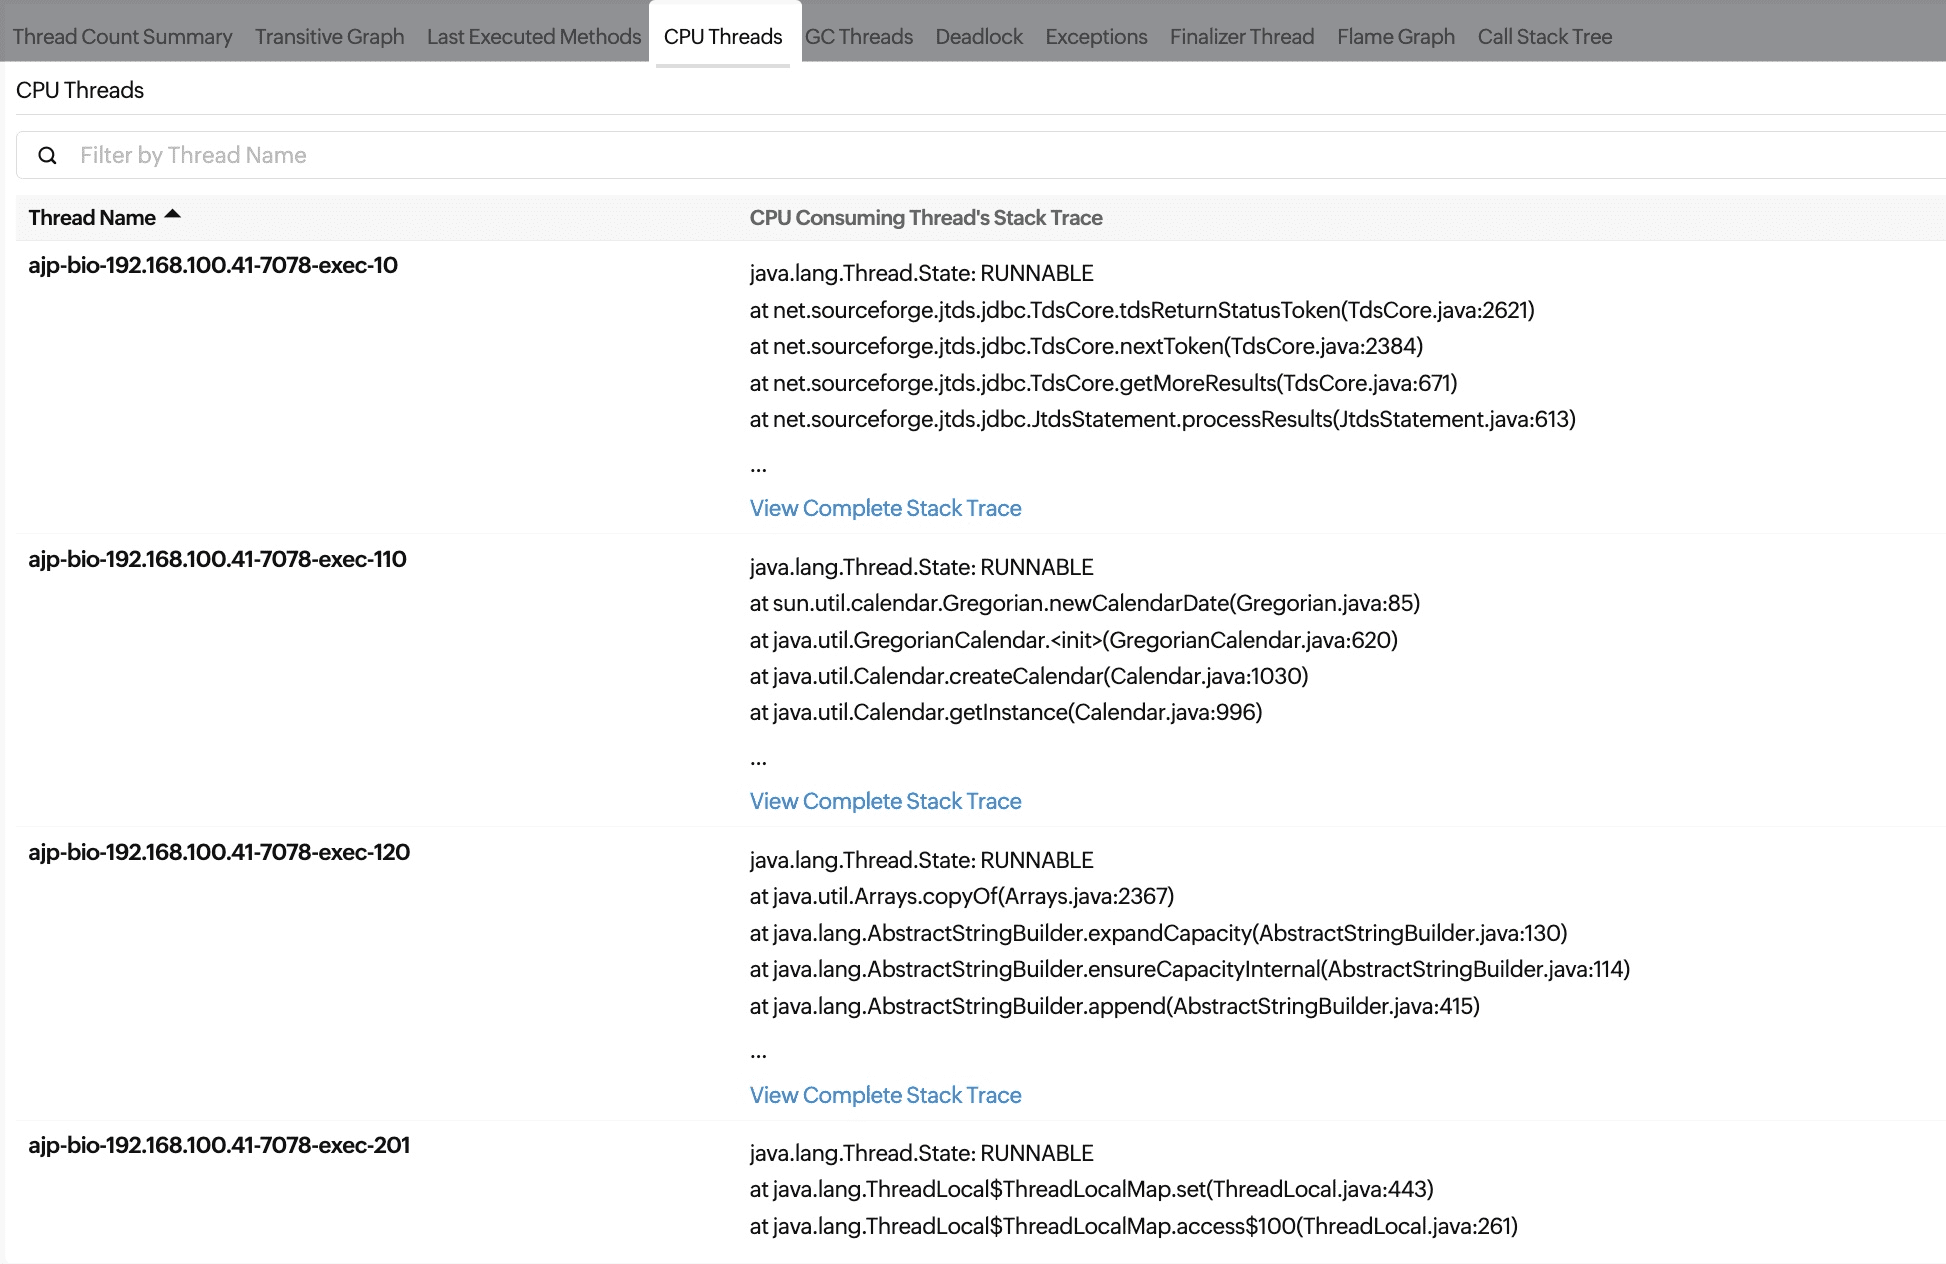
The CPU Threads tab provides valuable insight into your application's performance by displaying the top five CPU-consuming threads along with their stack trace.
- You can search for specific threads by name using the Filter box.
- When you click View Complete Stack Trace, you will be taken to the Thread Dump Analysis tab, where you can further analyze the threads involved in detail.
GC Threads
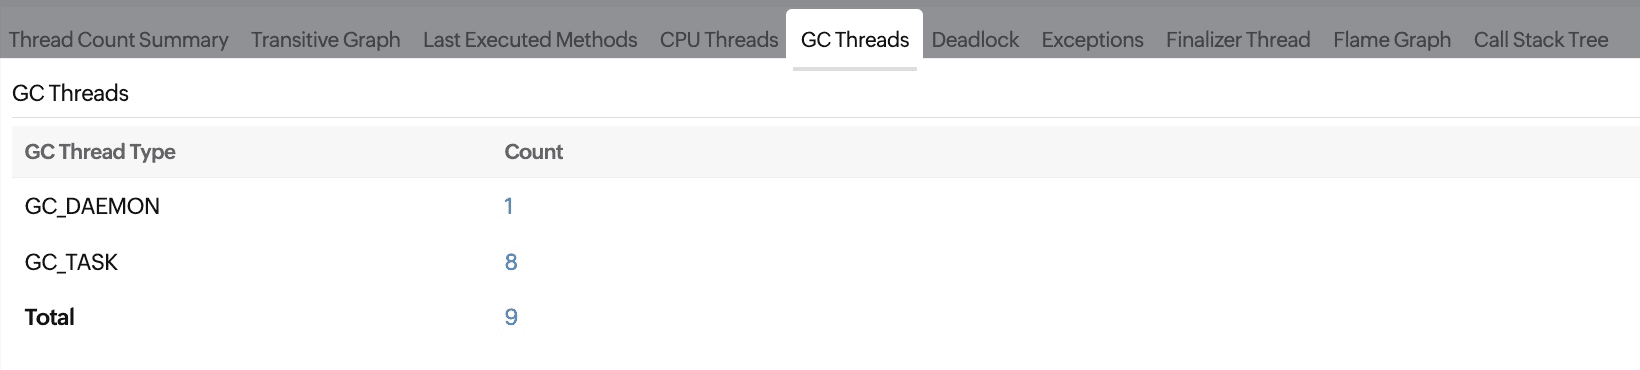
Garbage collection (GC) threads provide valuable insight into the memory management of your application, helping quickly identify and resolve performance issues related to GC.
The GC Threads tab shows the thread count for GC_DAEMON and GC_TASK separately.
Deadlock
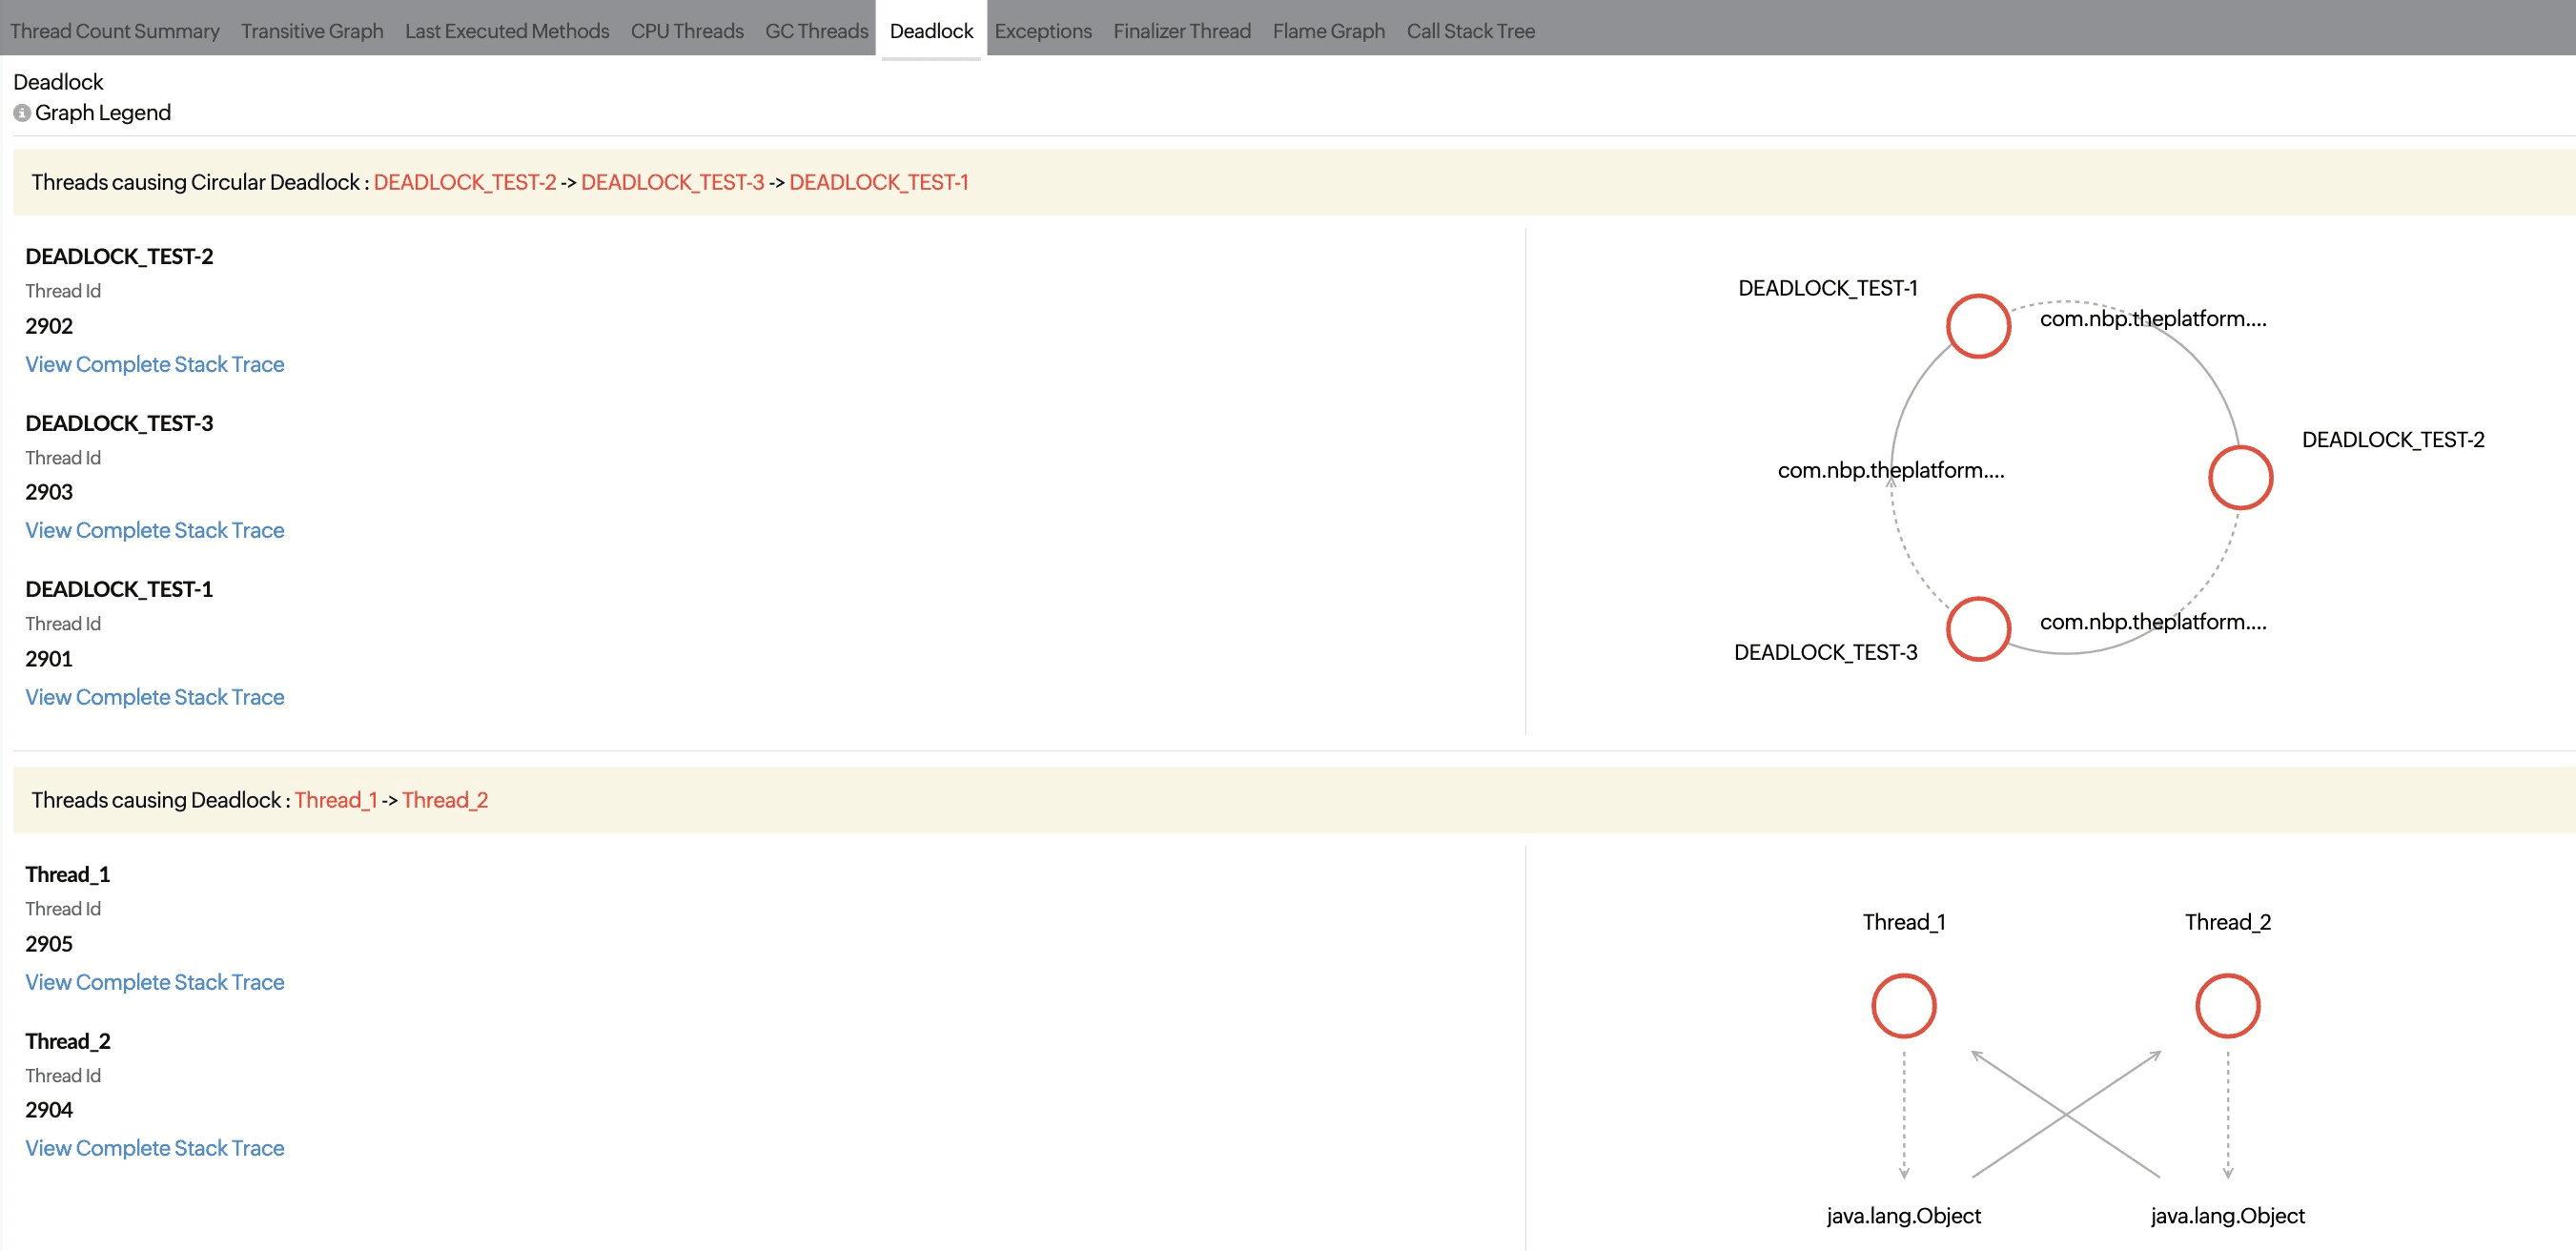
A deadlock happens when a group of threads are unable to proceed because each thread is holding a resource that another thread needs.
The Deadlock tab contains details regarding deadlocks and the threads affected, including the resources they are waiting for and the status of each thread. This data can be utilized to address the deadlock by either freeing up a resource or altering the sequence in which resources are locked.
It shows:
- The names and IDs of the threads associated with the deadlock.
- A graphical representation of the deadlock.
Exceptions
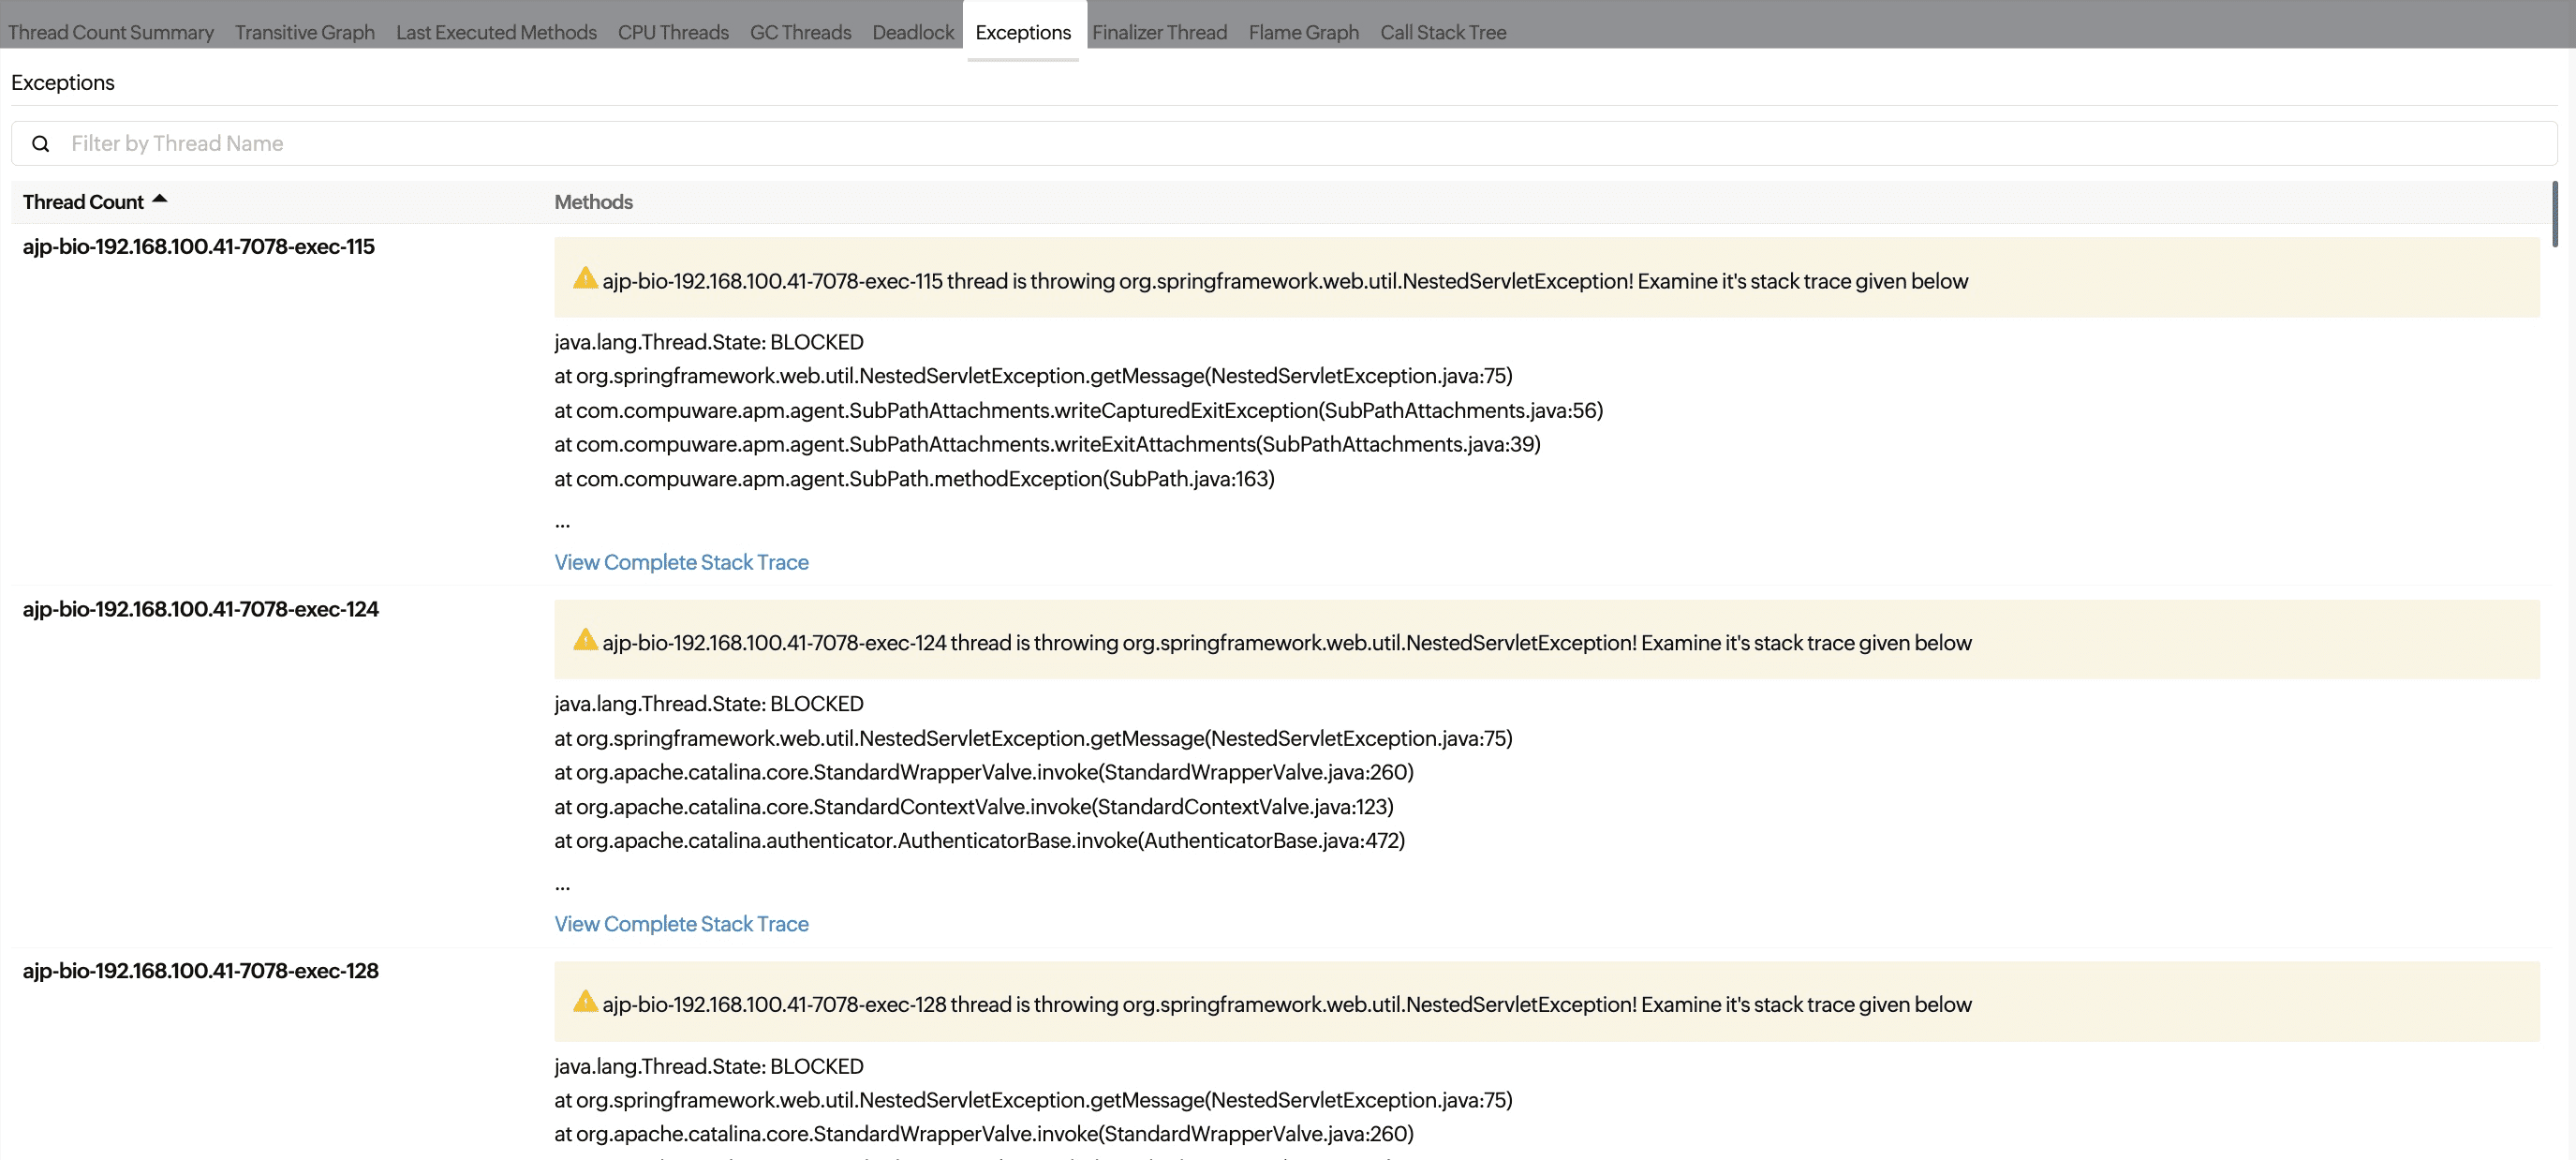
Errors that can be handled in multi-threaded applications are called exceptions, enabling the application to keep running instead of crashing.
The Exceptions tab displays the top five exception threads and the methods used in each thread.
- You can search for specific threads by name using the Filter box.
- When you click View Complete Stack Trace, you will be taken to the Thread Dump Analysis tab, where you can further analyze the threads involved in detail.
Finalizer Thread
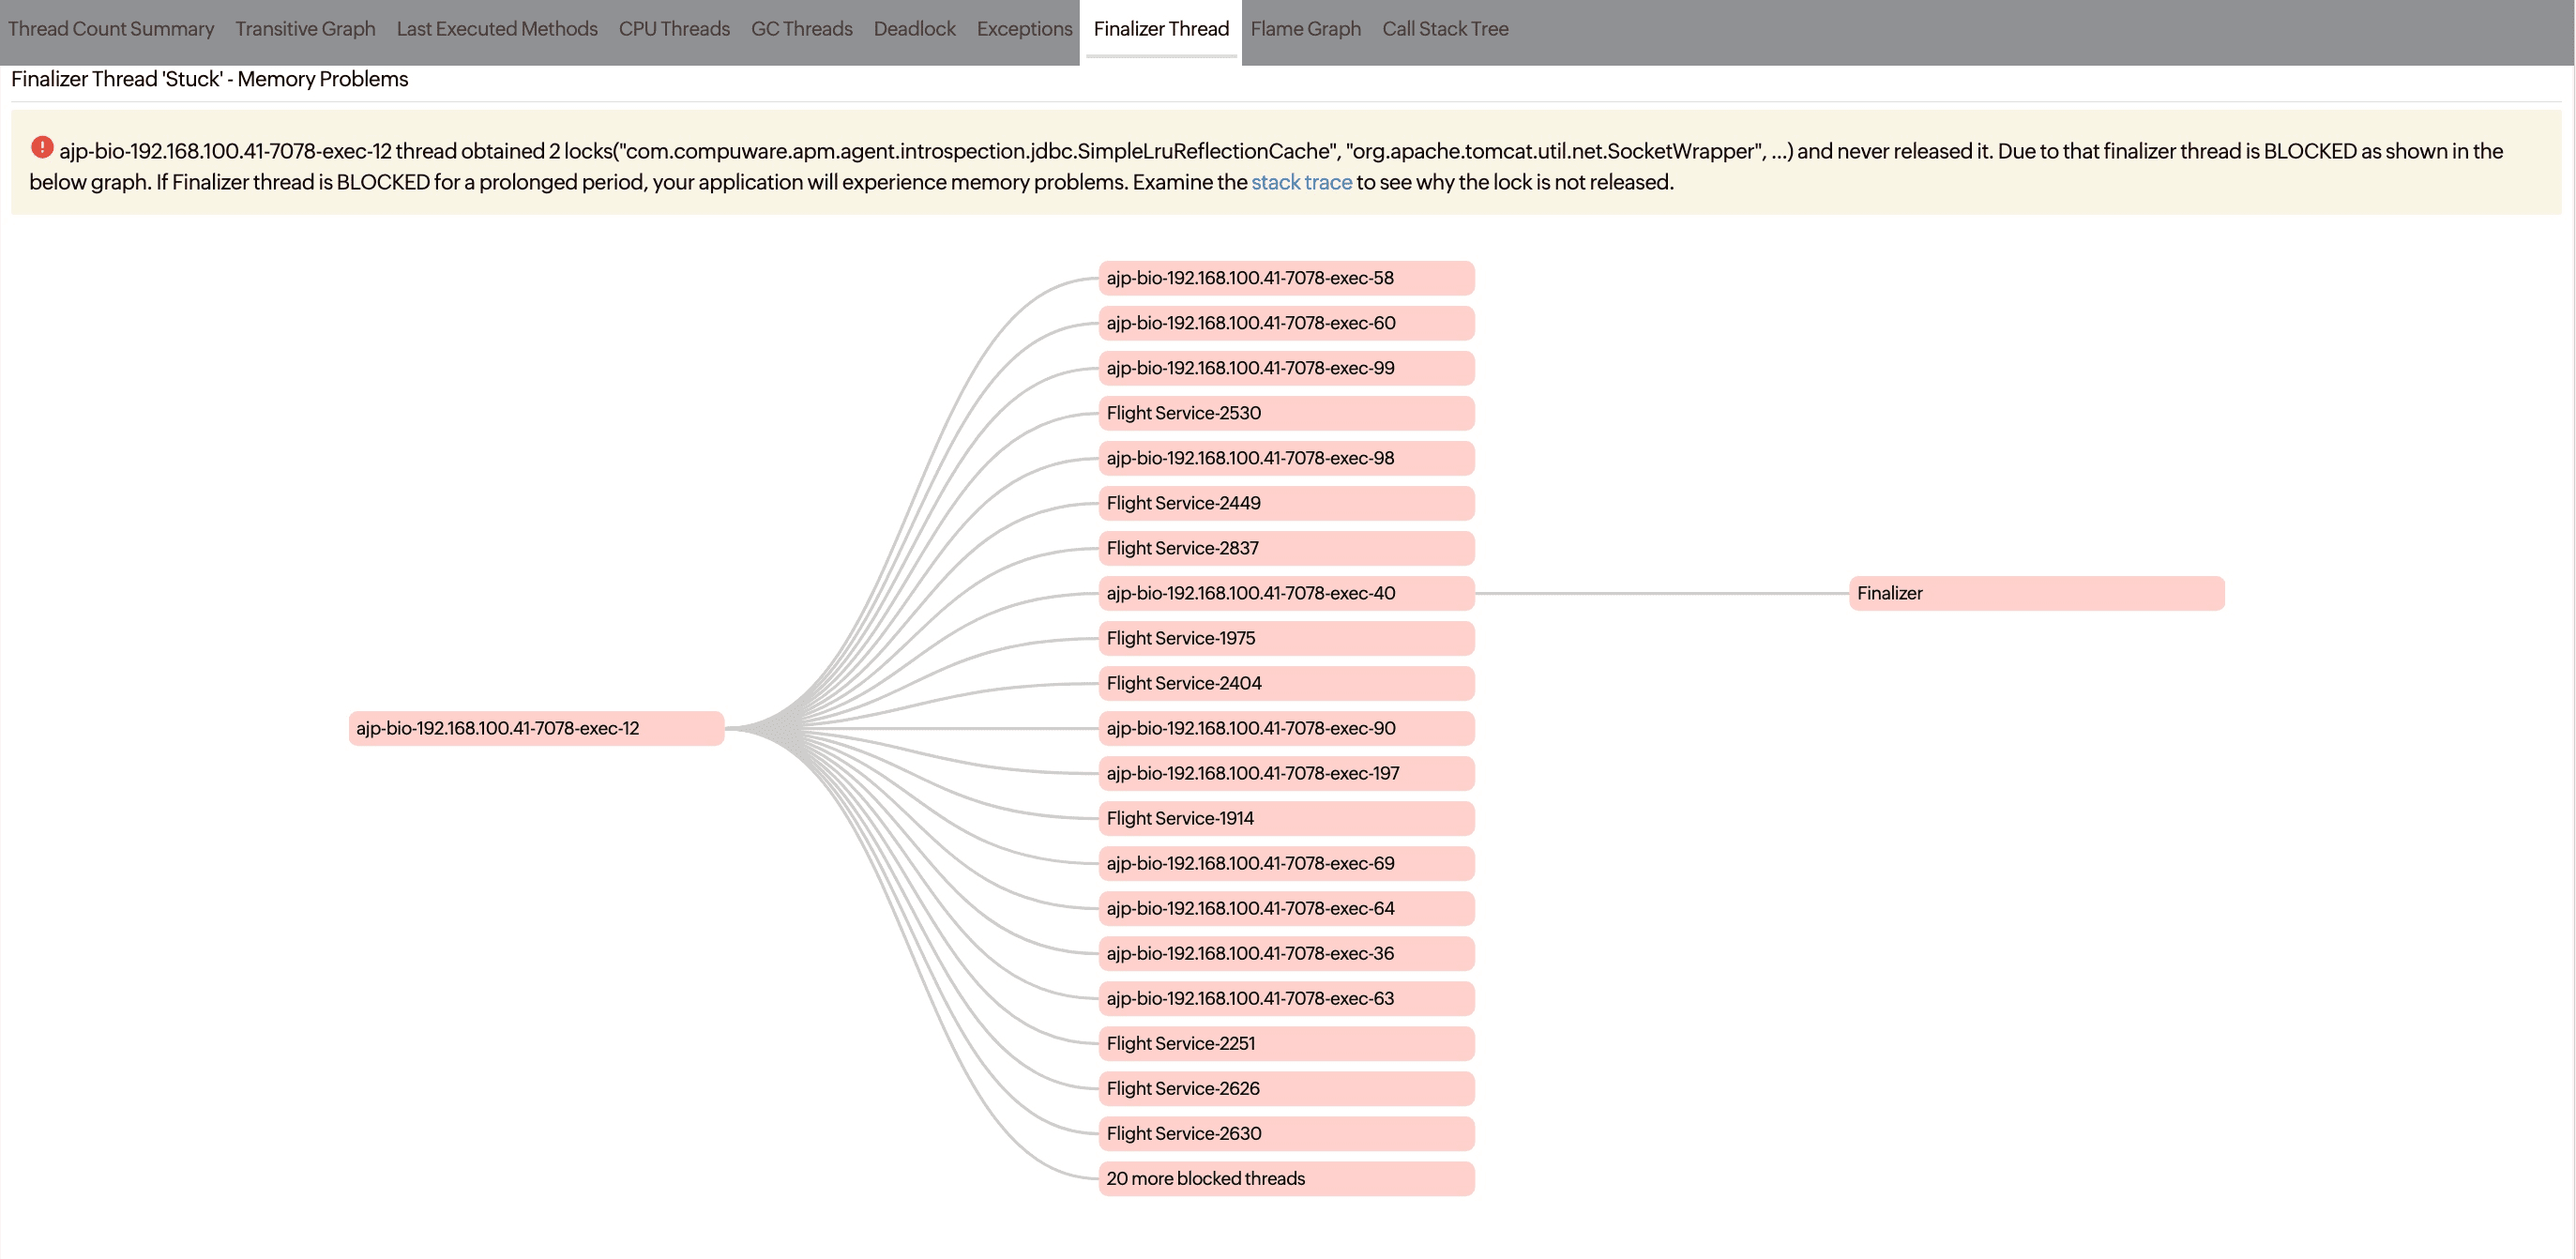
The finalizer thread in the JVM is responsible for executing the finalize() method of objects that are nearing garbage collection, allowing them to perform cleanup operations before being destroyed.
The Finalizer Thread tab shows a transitive graph indicating which threads are causing a blockage for the finalizer thread. It assists in releasing these threads to prevent memory problems in your application.
- Clicking the required thread name will show the respective stack trace.
- The information card above the graph contains troubleshooting tips.
Flame Graph
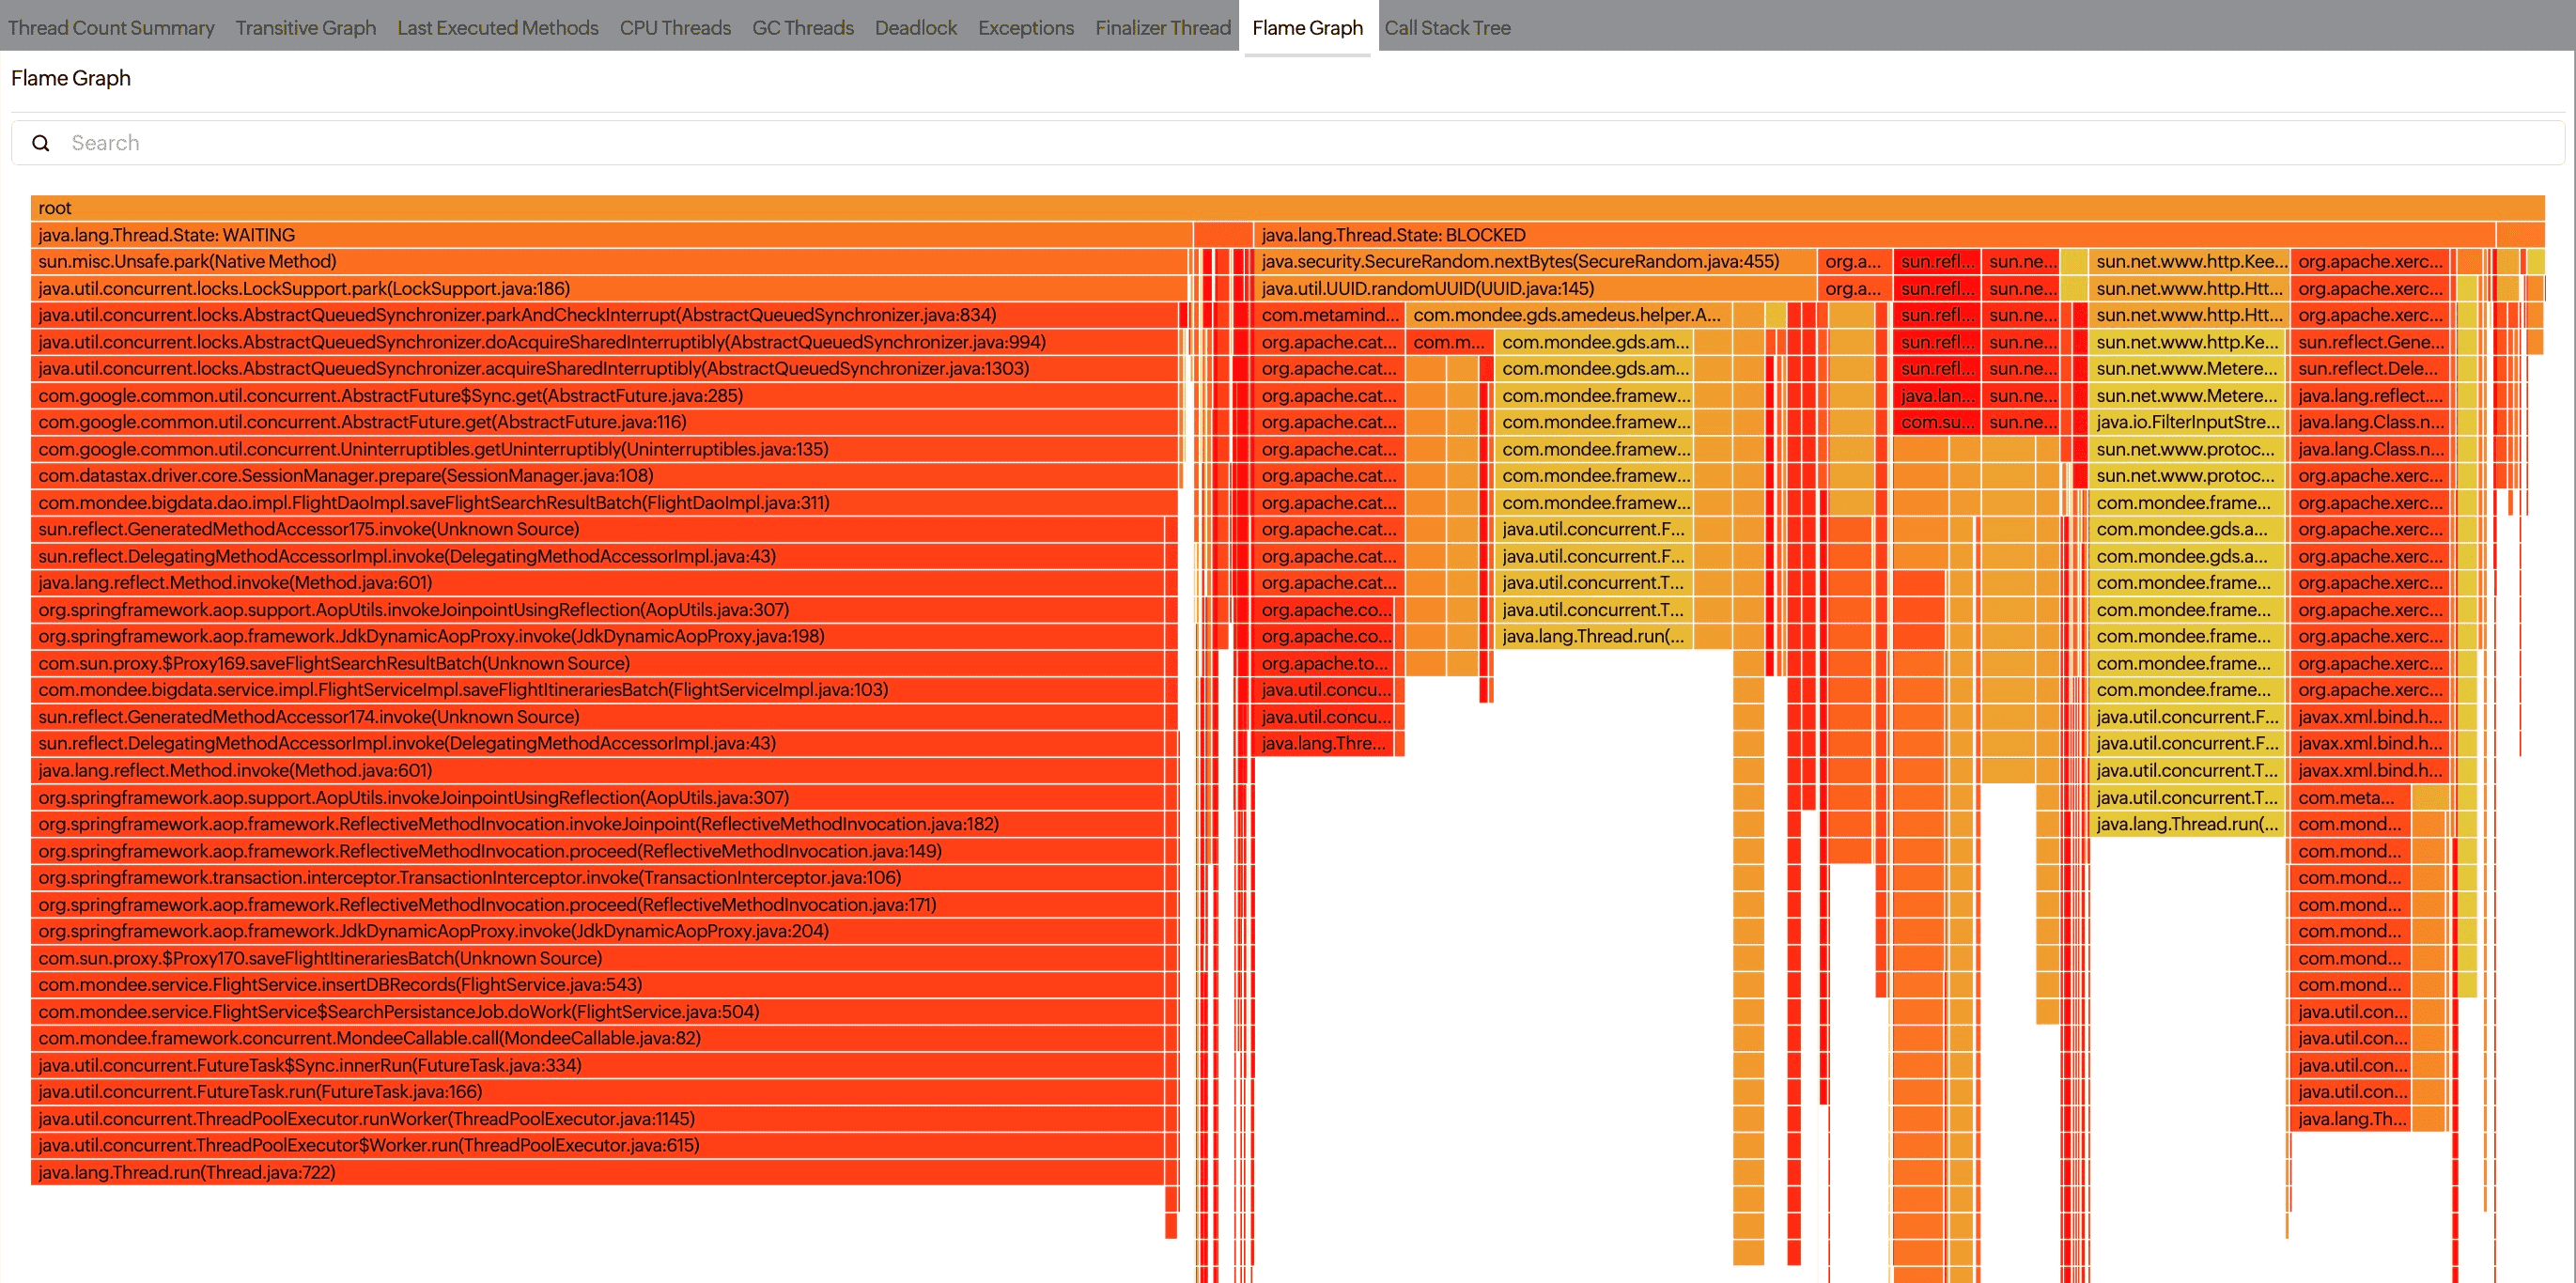
The Flame Graph illustrates the distribution of time spent in various functions or code segments, with each horizontal bar representing a function or code segment and its width indicating the thread count (number of threads that have called this method in their stack trace). This visualization helps in identifying areas that need improvement, optimization, and for pinpointing bottlenecks in complex systems.
Call Stack Tree
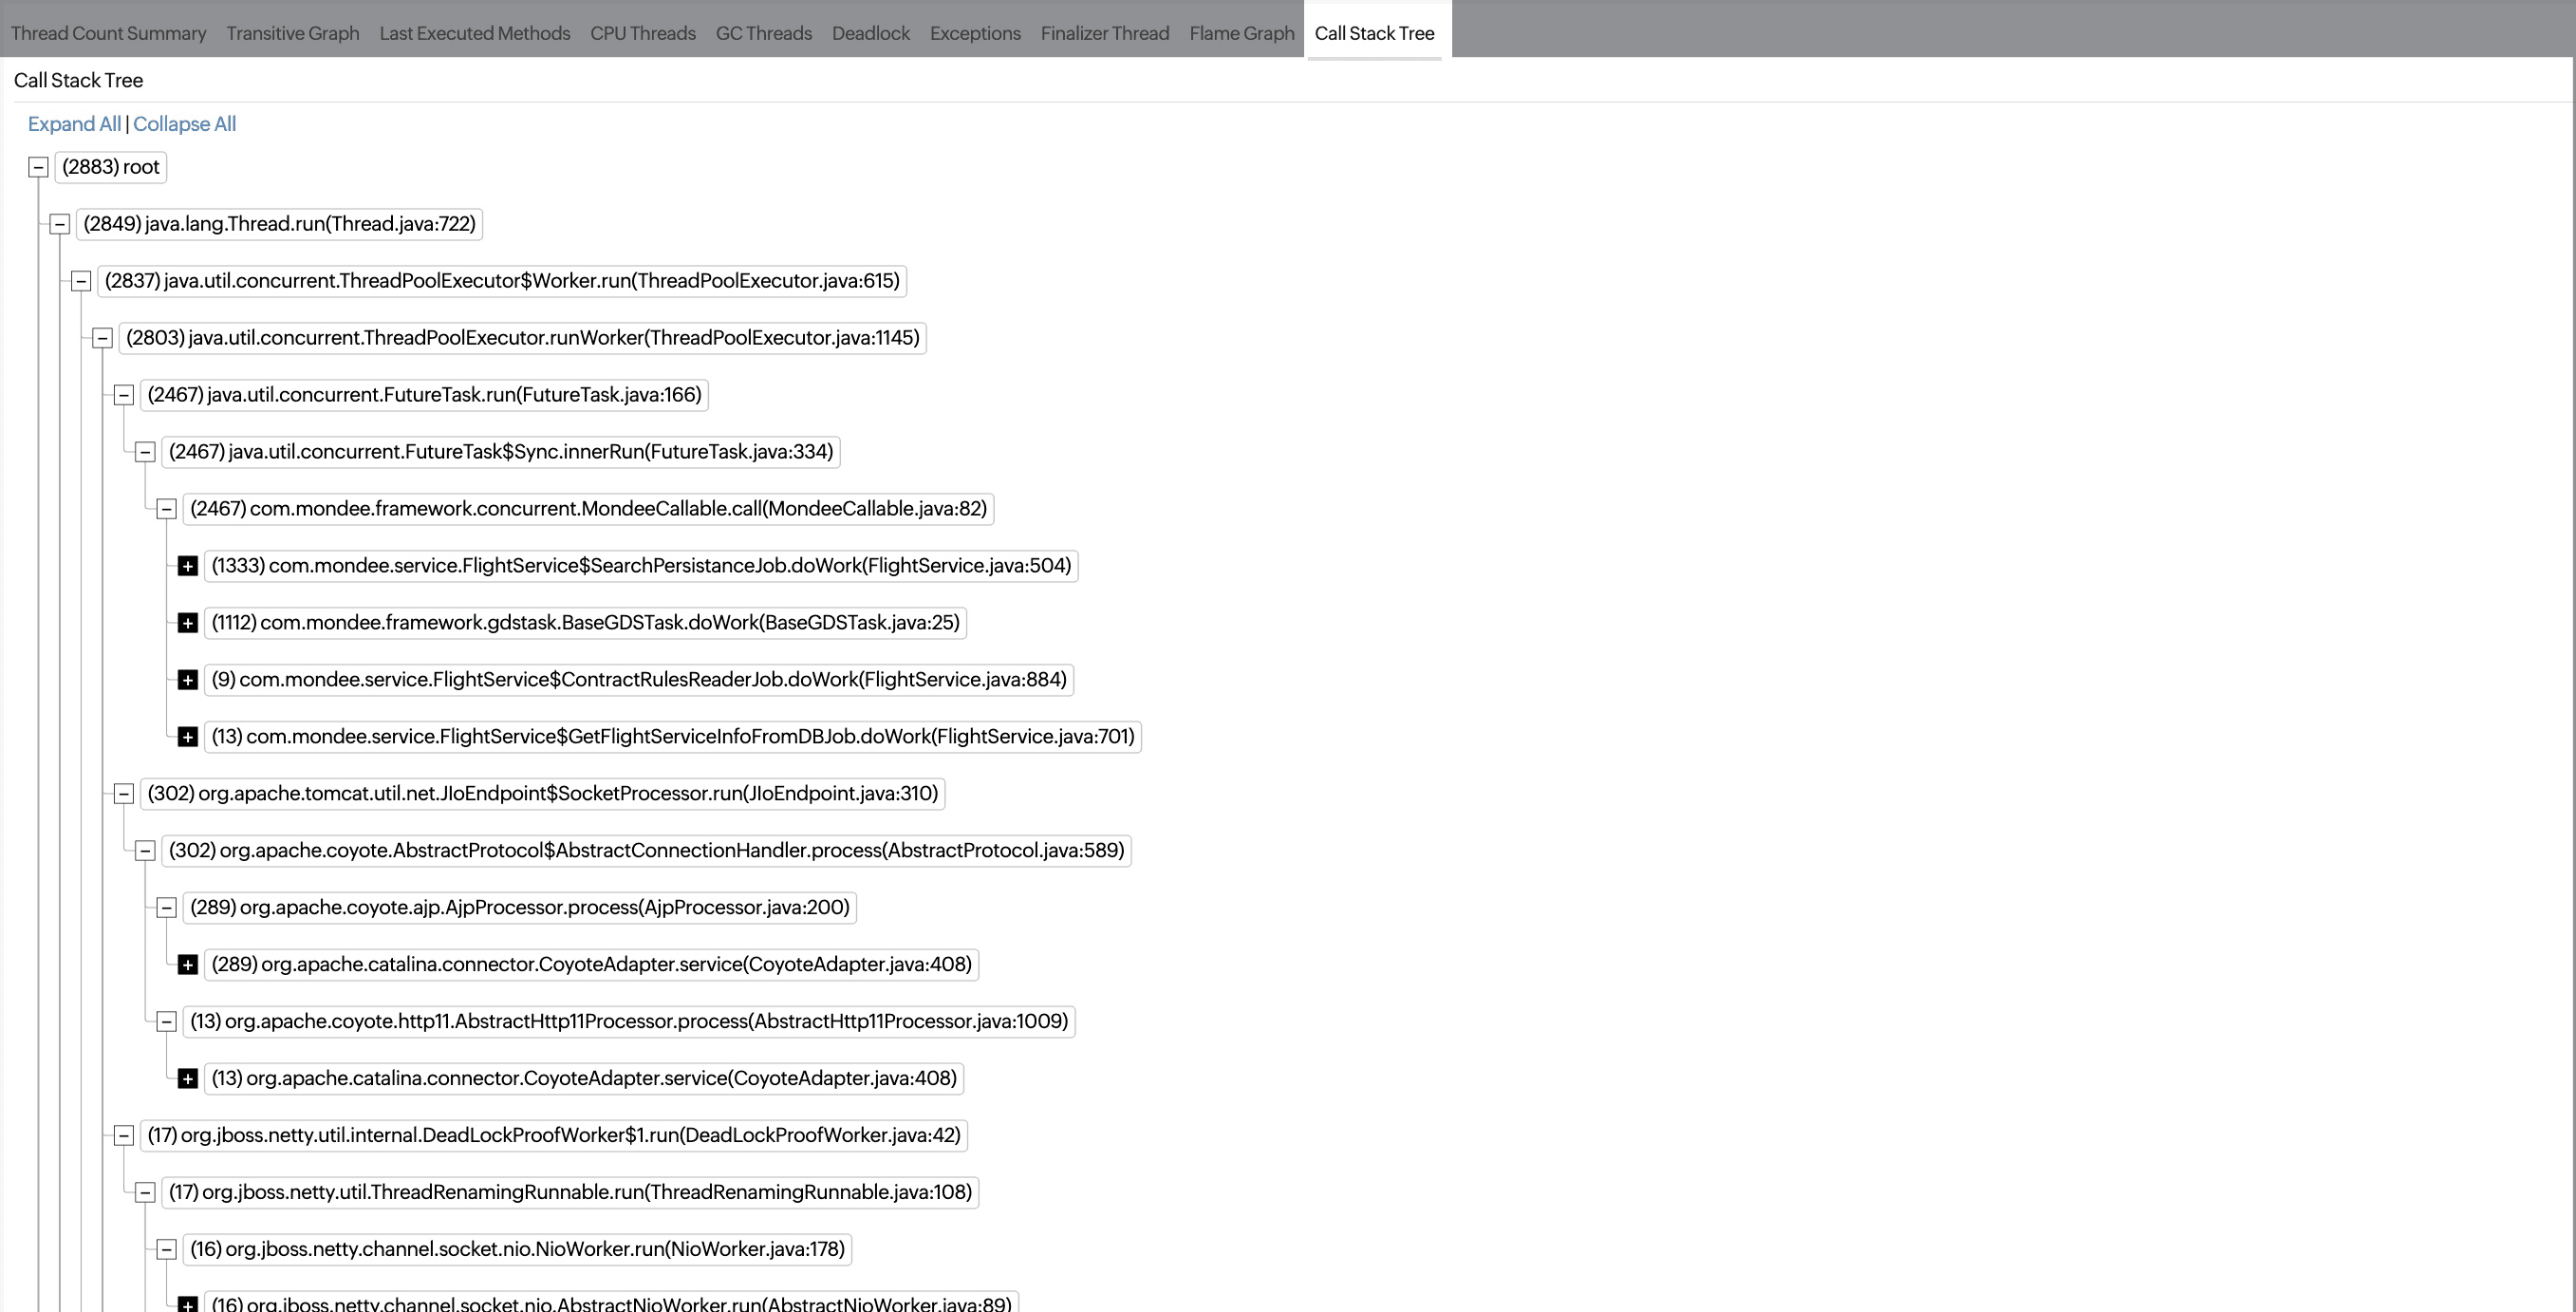
The Call Stack Tree is used to visualize the performance of a multi-threaded application. It provides a hierarchical representation of its functions, illustrating the flow of control between functions and how they are nested. It allows developers to understand program structure, debug code, identify recursion, analyze dependencies, and trace execution paths.
Thread Dump Analysis
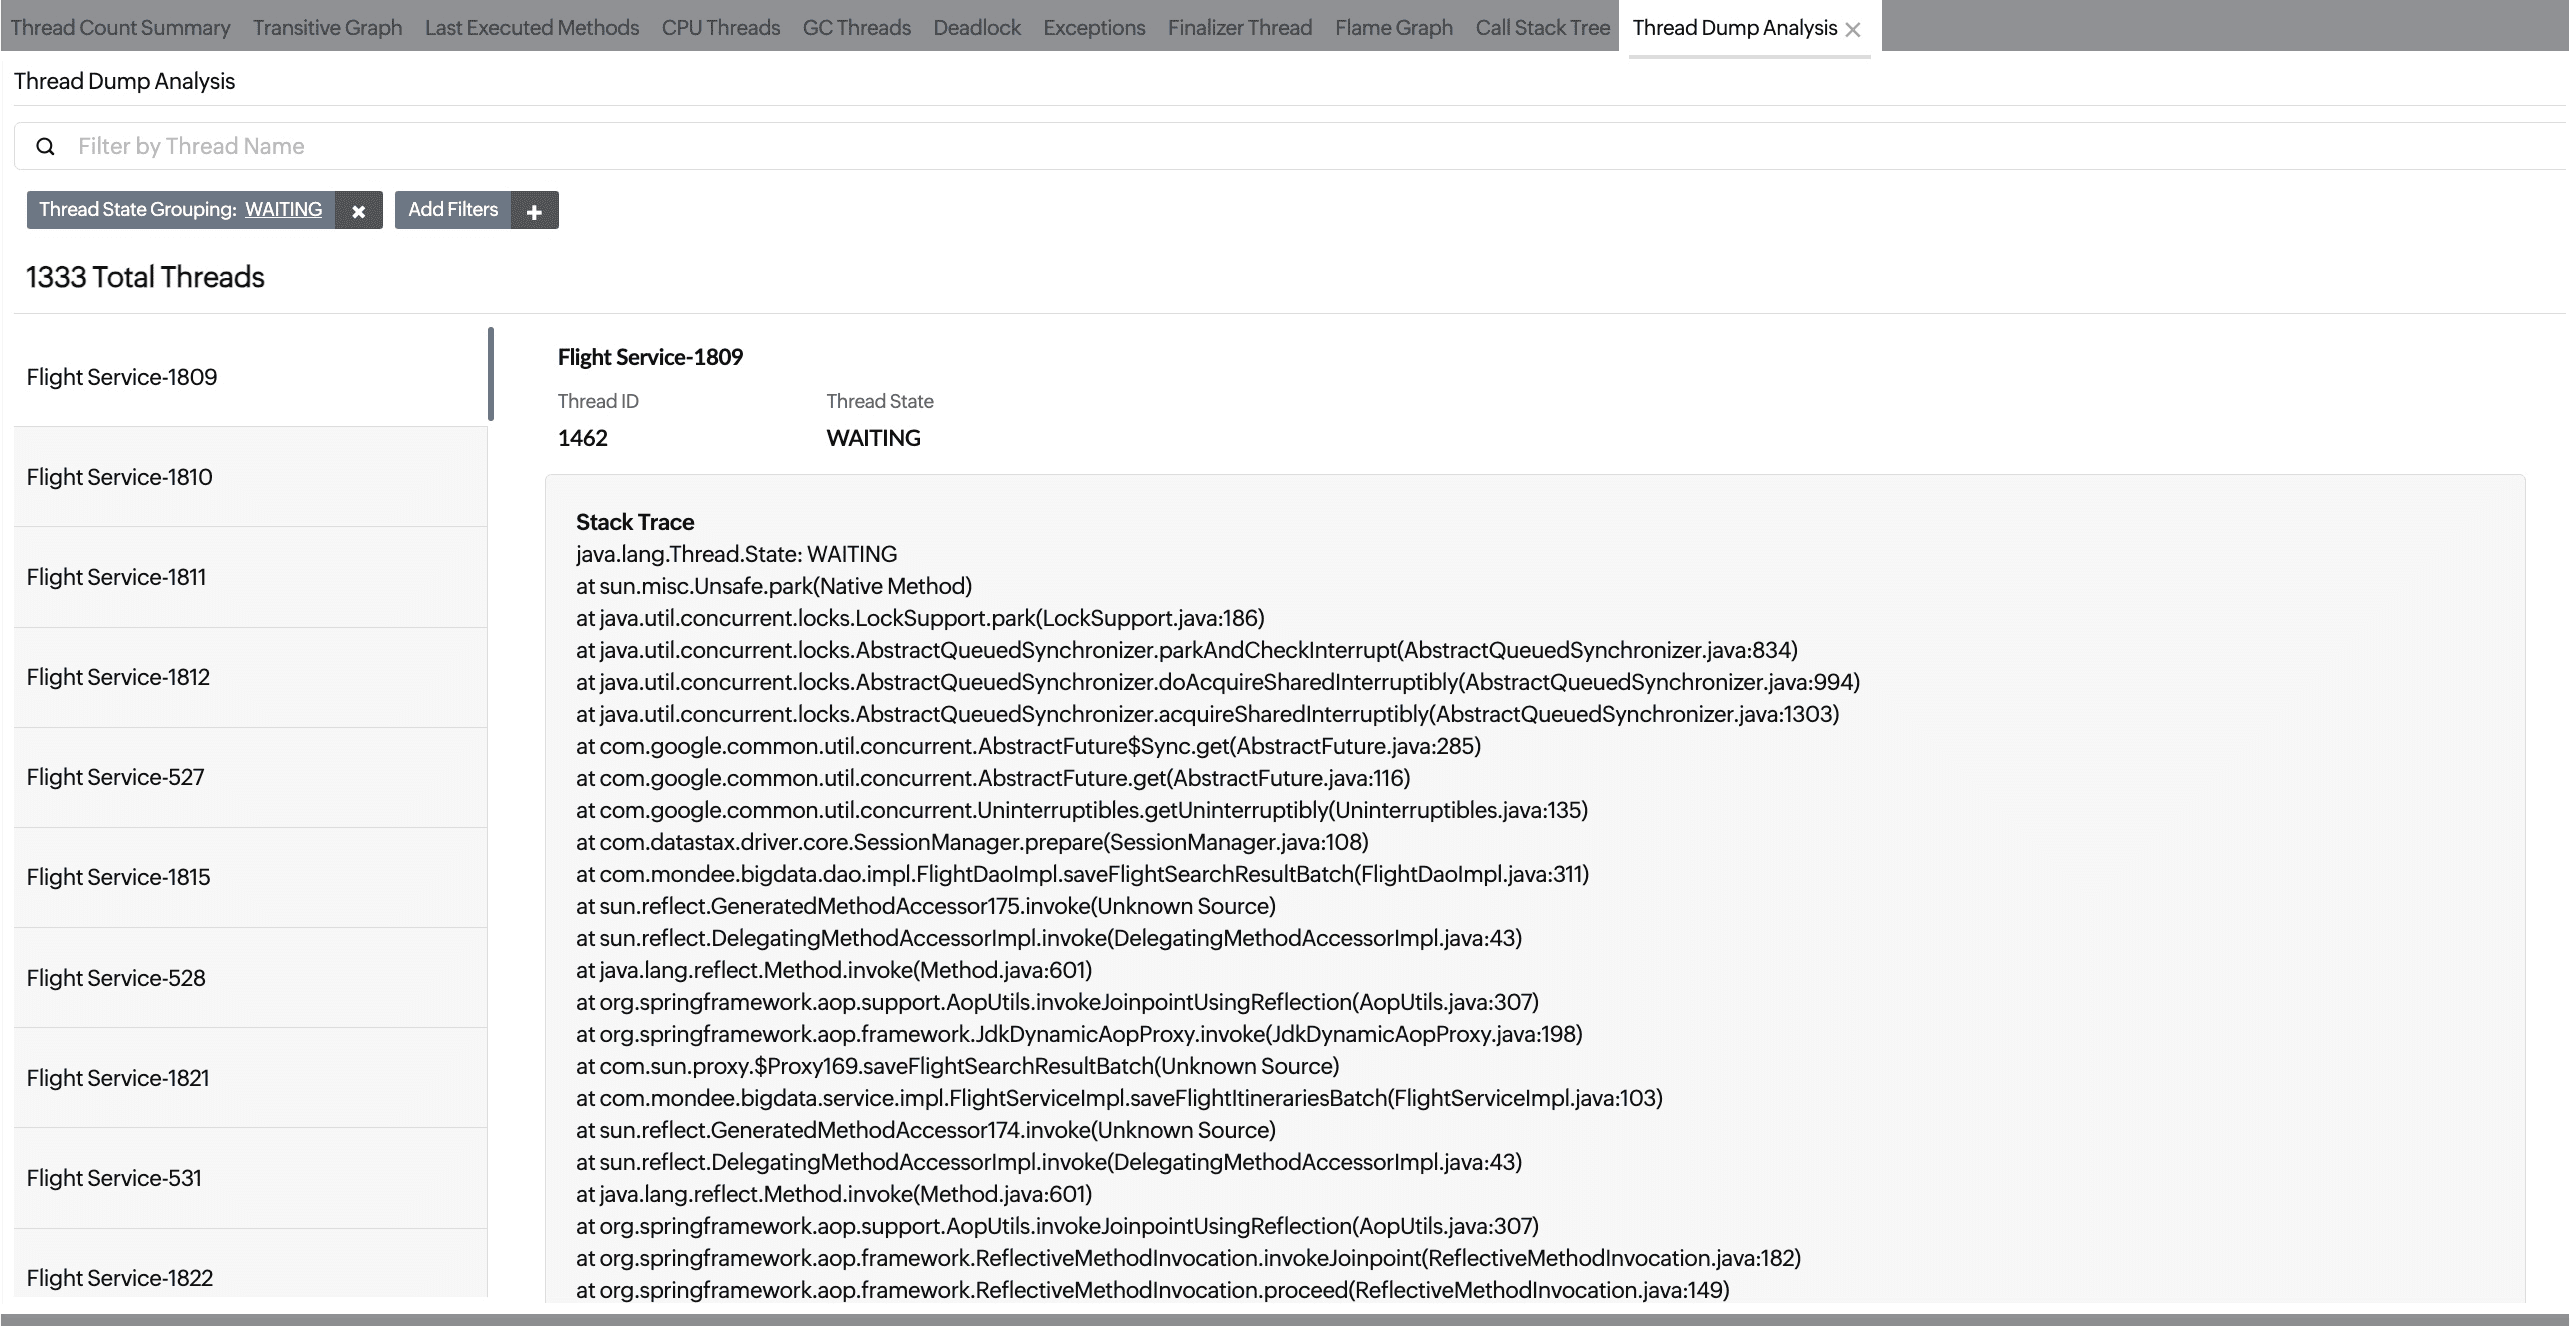
The Thread Dump Analysis tab provides the complete list of threads in the selected thread dump. The Add Filters option in this tab allows you to add multiple search conditions for thread dump analysis.
- This tab remains hidden until you click the View Complete Stack Trace option in other tabs.
- You can close this tab when the analysis is finished.
-
On this page
- Use case
- Thread dump metrics