Custom instrumentation for Node.js applications
By default, the APM Insight Node.js agent captures incoming web requests like http, https, http2, and other similar ones. To gain more granularity, you can use the custom instrumentation APIs. This helps you analyze specific transactions or code blocks in your applications.
APIs, as well as their functionality and syntax, are covered below.
Note: To use custom instrumentation in your Node.js applications, you must have the APM Insight module installed. Use the following command to load the APM Insight module in your application:
var apminsight = require('apminsight')API's to
- Monitor web/background transactions
- Monitor custom components
- Track handled errors
- Instrument app parameters
- Track custom parameters
Monitor web/background transactions:
- By default, incoming web requests are automatically collected by the agent and displayed under the Web transactions tab. However, other client-server communications, like socket connections, are not monitored by the agent. Such transactions can be monitored using an API.
- The agent does not monitor background transactions by default. You can monitor background transactions by instrumenting them with the API below.
- You can also customize the names of your transaction or skip transactions from monitoring using the given APIs.
- When you instrument web or background transactions, they must be followed by the End transaction API.
API to instrument web transactions
Syntax:
apminsight.startWebTransaction(txnName, handler)
txnName : string value
handler : handler is the function, that will be executed once txn is created
Example:
var apminsight = require('apminsight');
var app = require('express')();
var http = require('http').Server(app);
var io = require('socket.io')(http);

/* this request will be collected automatically*/

app.get('/', function(req, res){
res.sendFile(__dirname + '/index.html');
});

/*need to use custom instrumentation for socket communication*/

io.on('connection', function(socket){
apminsight.startWebTransaction('/message', function(){
doSomething()
........ apminsight.endTransaction();
});
});
http.listen(3000);
Output:

API to instrument background transactions
Syntax:
apminsight.startBackgroundTransaction(txnName, handler)
txnName : string value
handler : handler is the function, that will be executed once txn is created
Example:
var apminsight = require('apminsight');
function doBackground(){
setInterval( function(){
apminsight.startBackgroundTransaction('routine', function(){
doSomething().........
apminsight.endTransaction();
}
}, 5000);
}
Output:

API to change/customize transaction name
Syntax:
apminsight.setTransactionName(customTxnName)
cusTxnName : string value
Example:
var apminsight = require('apminsight');
var app = require('express')();
var http = require('http').Server(app);

/* this request will be collected automatically with txn name /admin*/

app.get('/admin', function(req, res){

/* txn name will be changed to /homepage*/

apminsight.setTransactionName('/homepage');
res.sendFile(__dirname + '/index.html');
});
http.listen(3000);
API to ignore transactions
Syntax:
apminsight.ignoreCurrentTransaction()
Example:
var apminsight = require('apminsight');
var app = require('express')();
var http = require('http').Server(app);
var io = require('socket.io')(http);
app.get('/logout', function(req, res){

/* this request will be ignored */

apminsight.ignoreCurrentTransaction();
res.sendFile(__dirname + '/index.html');
});
http.listen(3000);
End transaction API
Syntax:
apminsight.endTransaction()
Monitor custom components
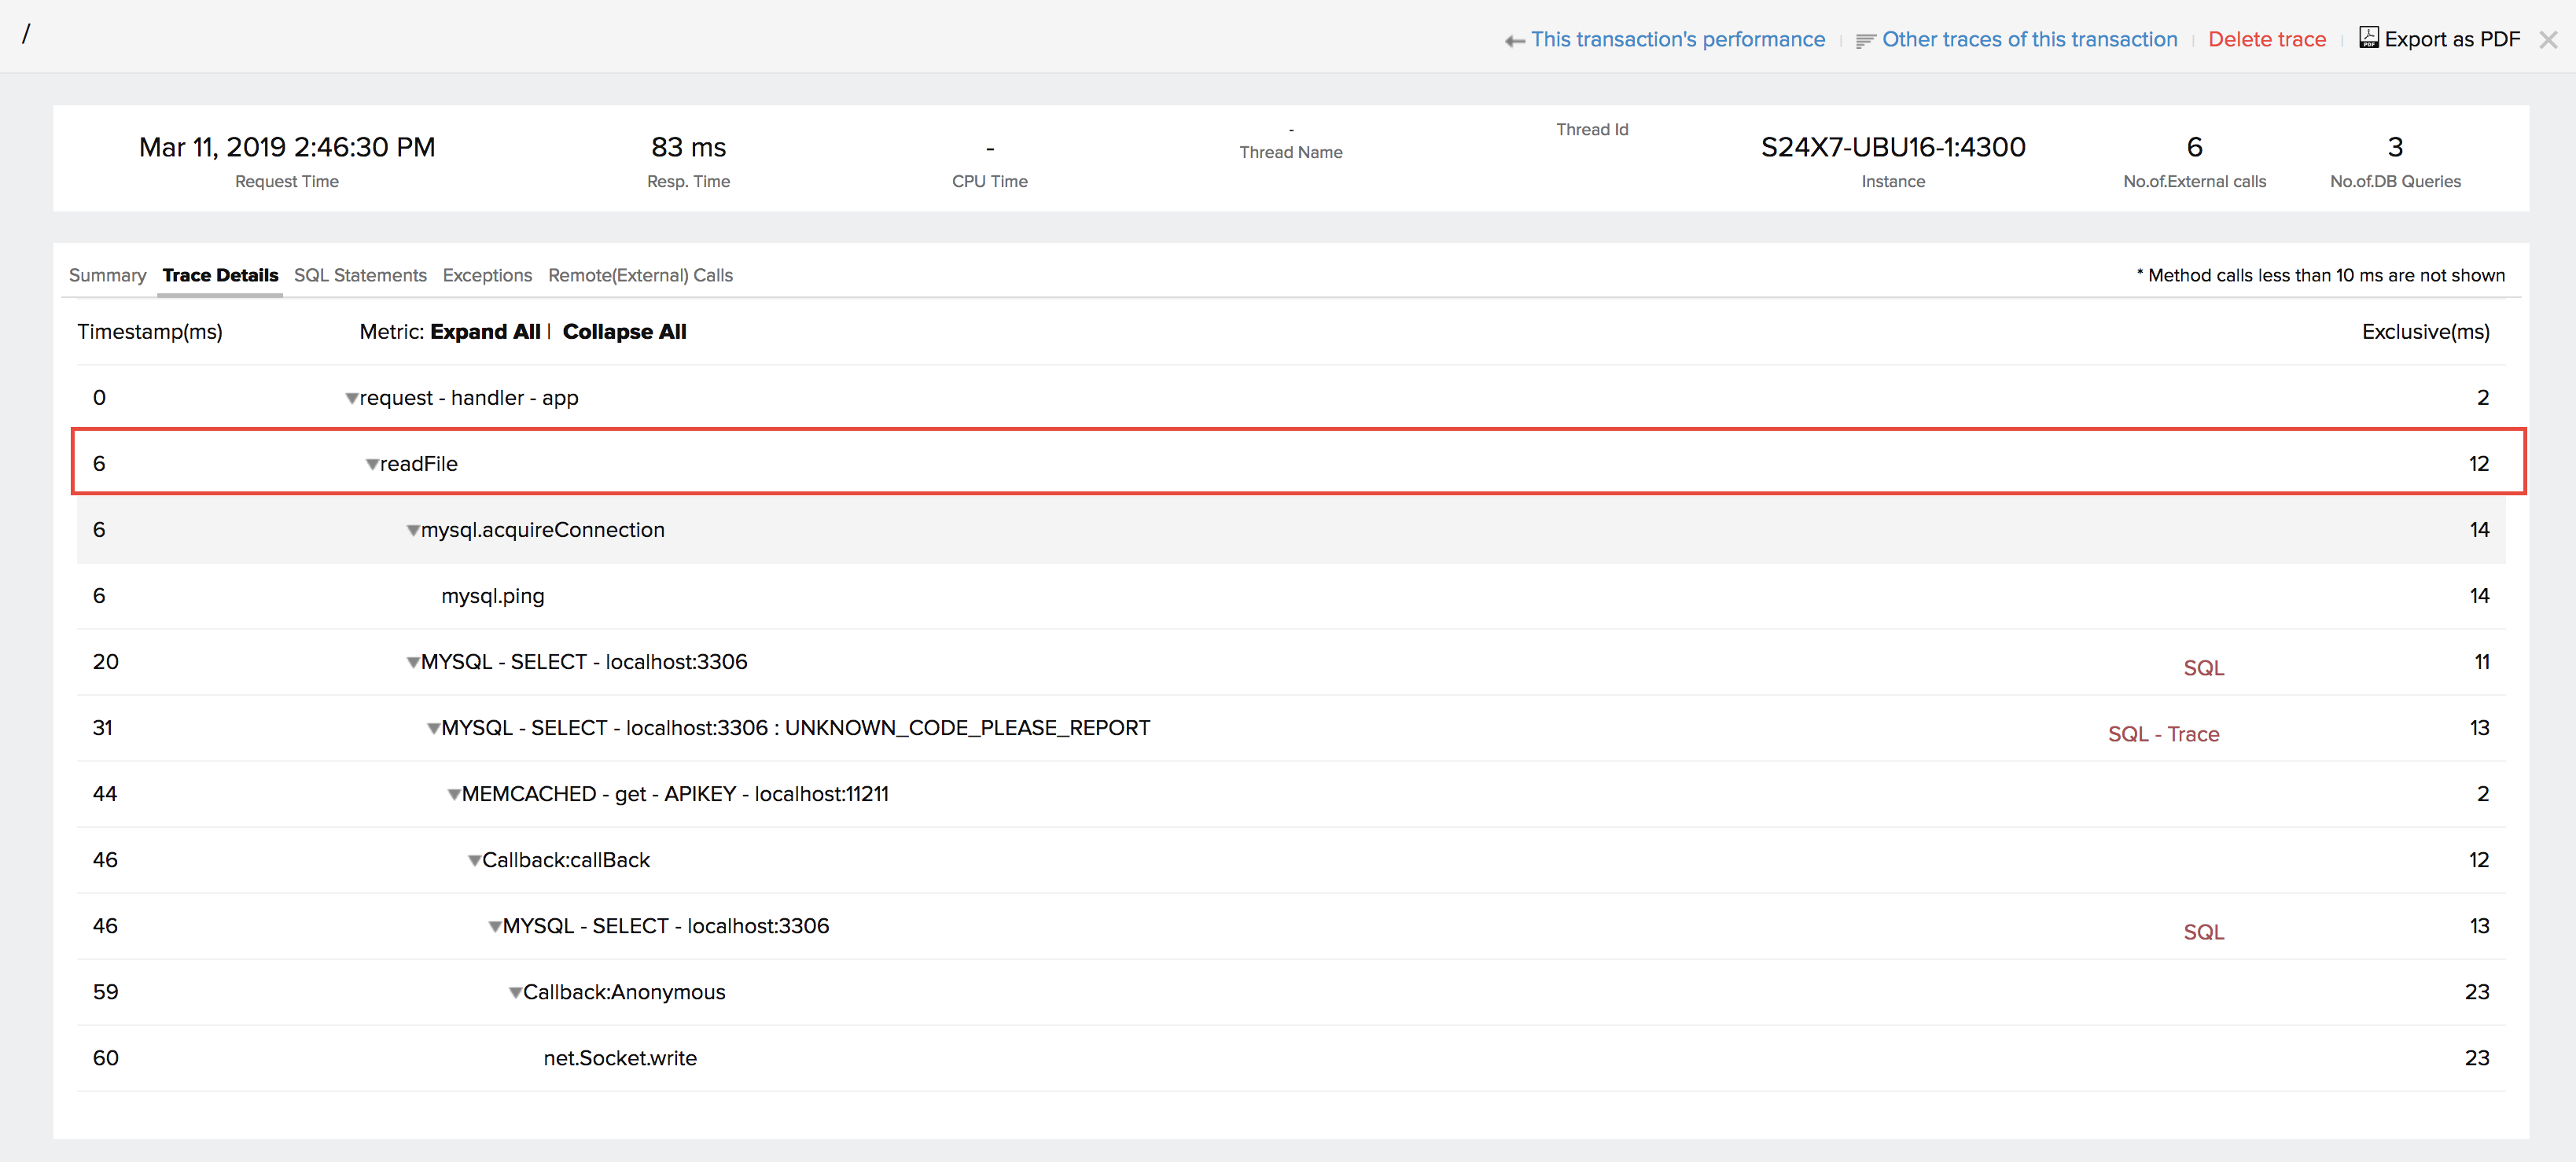
The agent captures default framework components, classes, and methods. However, user-defined classes and methods can be monitored only by instrumenting them with the following API. These details can be viewed under the Traces tab. Also, if any transaction involving a database operation is called in the instrumented class or method, those details will be reflected in the Database tab.
API to track custom components
Syntax:
apminsight.startTracker(trackerName, componentName, handler, cb)
trackerName : string value
componentName : string value
handler : handler is the function, that will be executed
cb : optional param, if it is present then it will be treated as asynchrous tracker
Example 1- Without cb:
var apminsight = require('apminsight');
var app = require('express')();
var http = require('http').Server(app);
app.get('/', function(req, res){
apminsight.startTracker('readFile', 'FS', function(){
res.sendFile(__dirname + '/index.html');
});
});
http.listen(3000);
Example 2- With cb:
var apminsight = require('apminsight');
var app = require('express')();
var http = require('http').Server(app);
app.get('/', function(req, res){
apminsight.startTracker('readFile', 'FS', function(cb){
doSomething()......
cb();
}, function(){

// send response

});
});
http.listen(3000);
Output:

Track handled errors
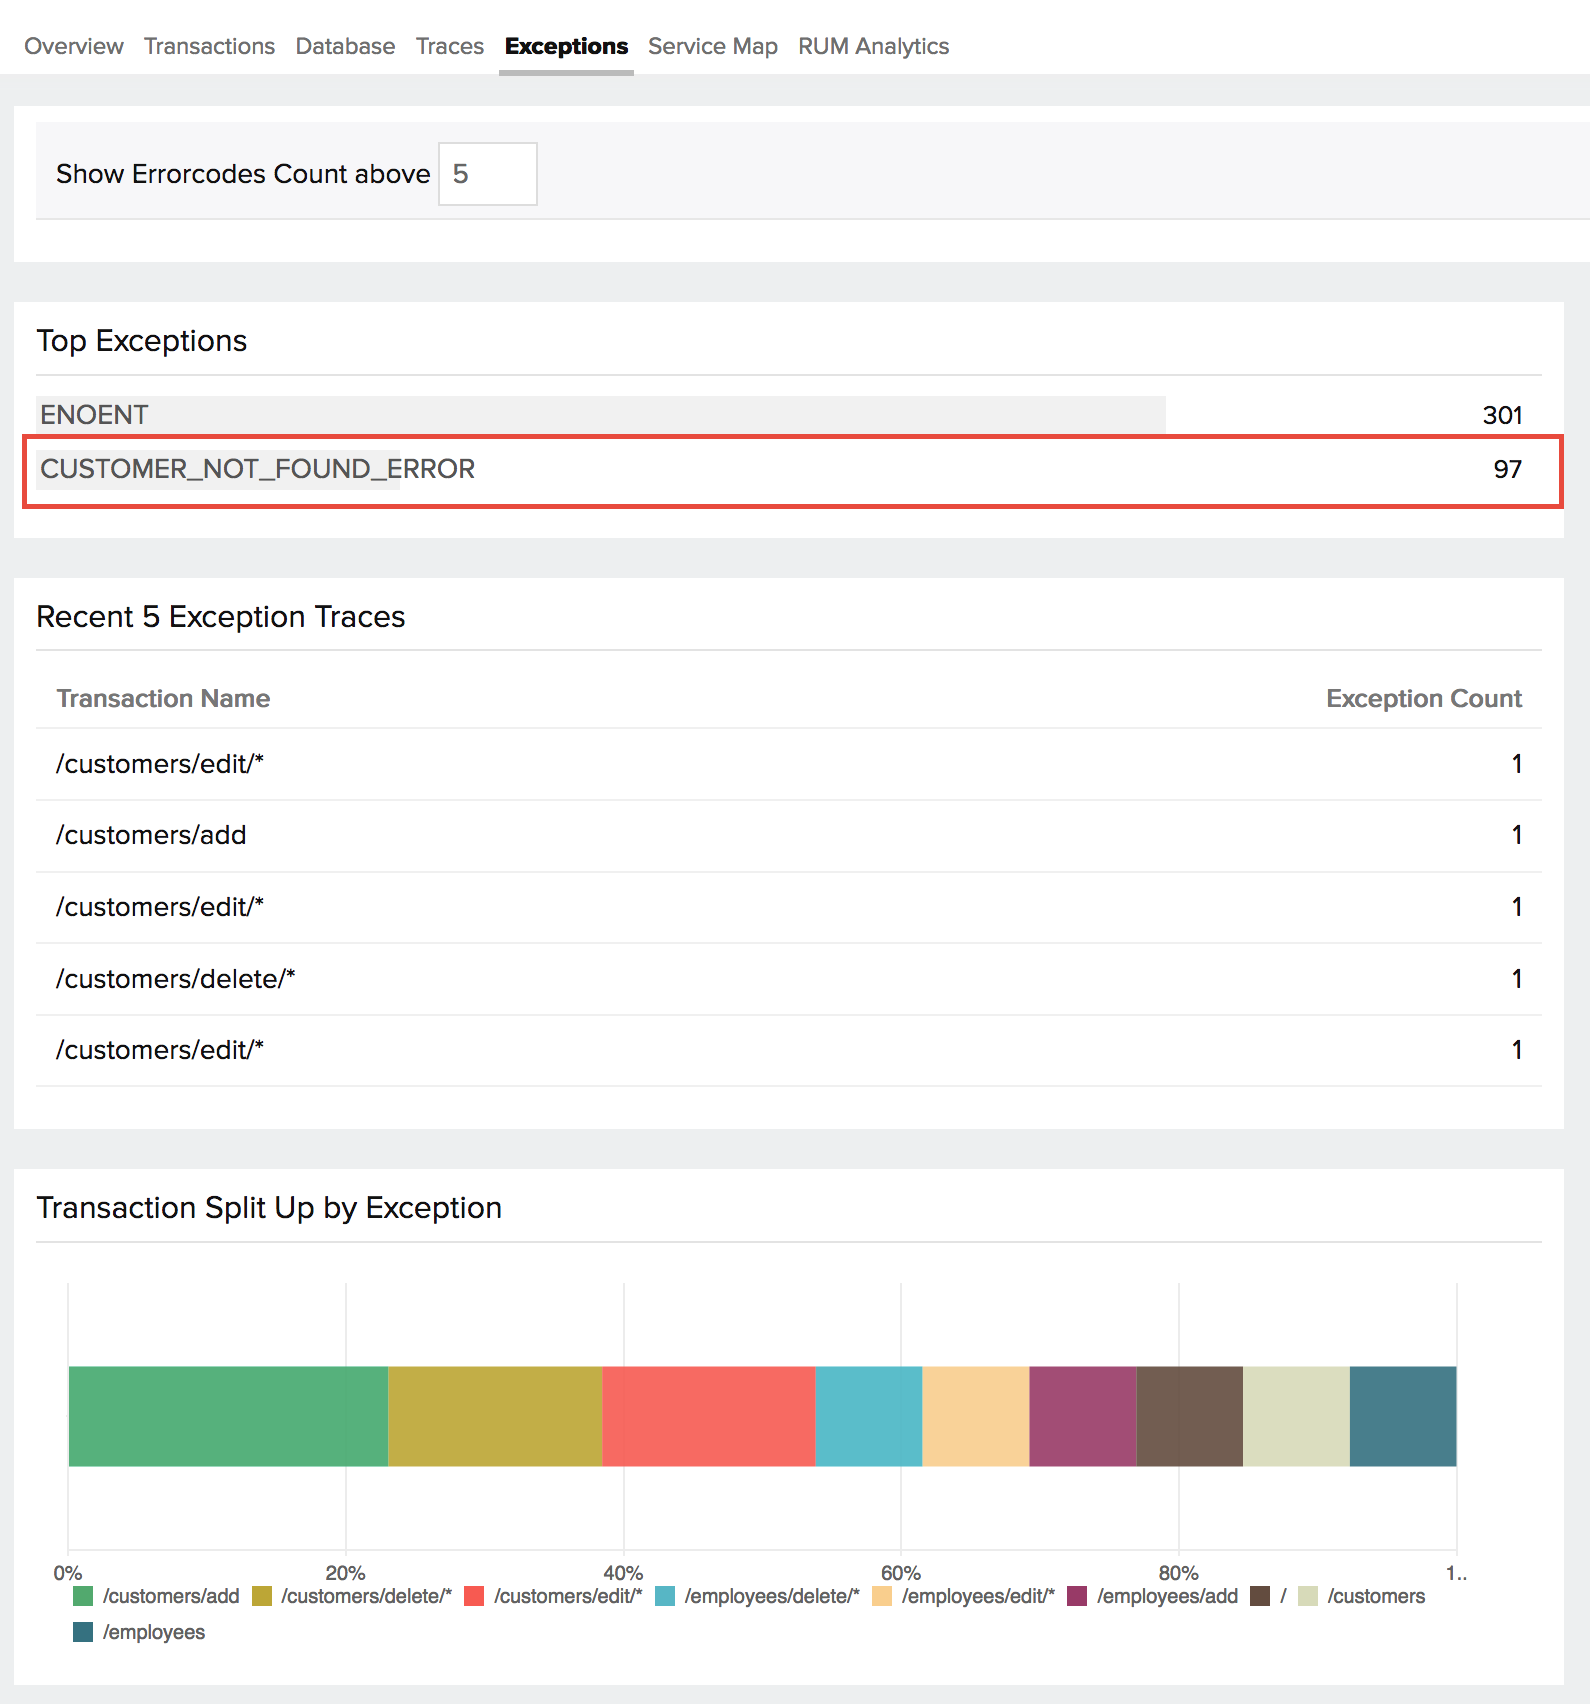
All async i/o errors and unhandled errors are captured by the agent in general. This API comes in handy for handled errors. For instance, if you have handled errors using the try-catch method, such errors can be notified via this API, and the notified errors are associated with its corresponding transaction. The captured errors can be viewed under Errors as well as the Traces tab.
API to track handled errors
Syntax:
apminsight.trackError(err)
err : Error object
Example:
var apminsight = require('apminsight');
var app = require('express')();
var http = require('http').Server(app);

/* this request will be collected automatically*/

app.get('/', function(req, res){
try{
fetchAndSendResponse();
}catch(err){
apminsight.trackError(err)
sendErrorResponse();
}
});
http.listen(3000);
Output:

Instrument app parameters
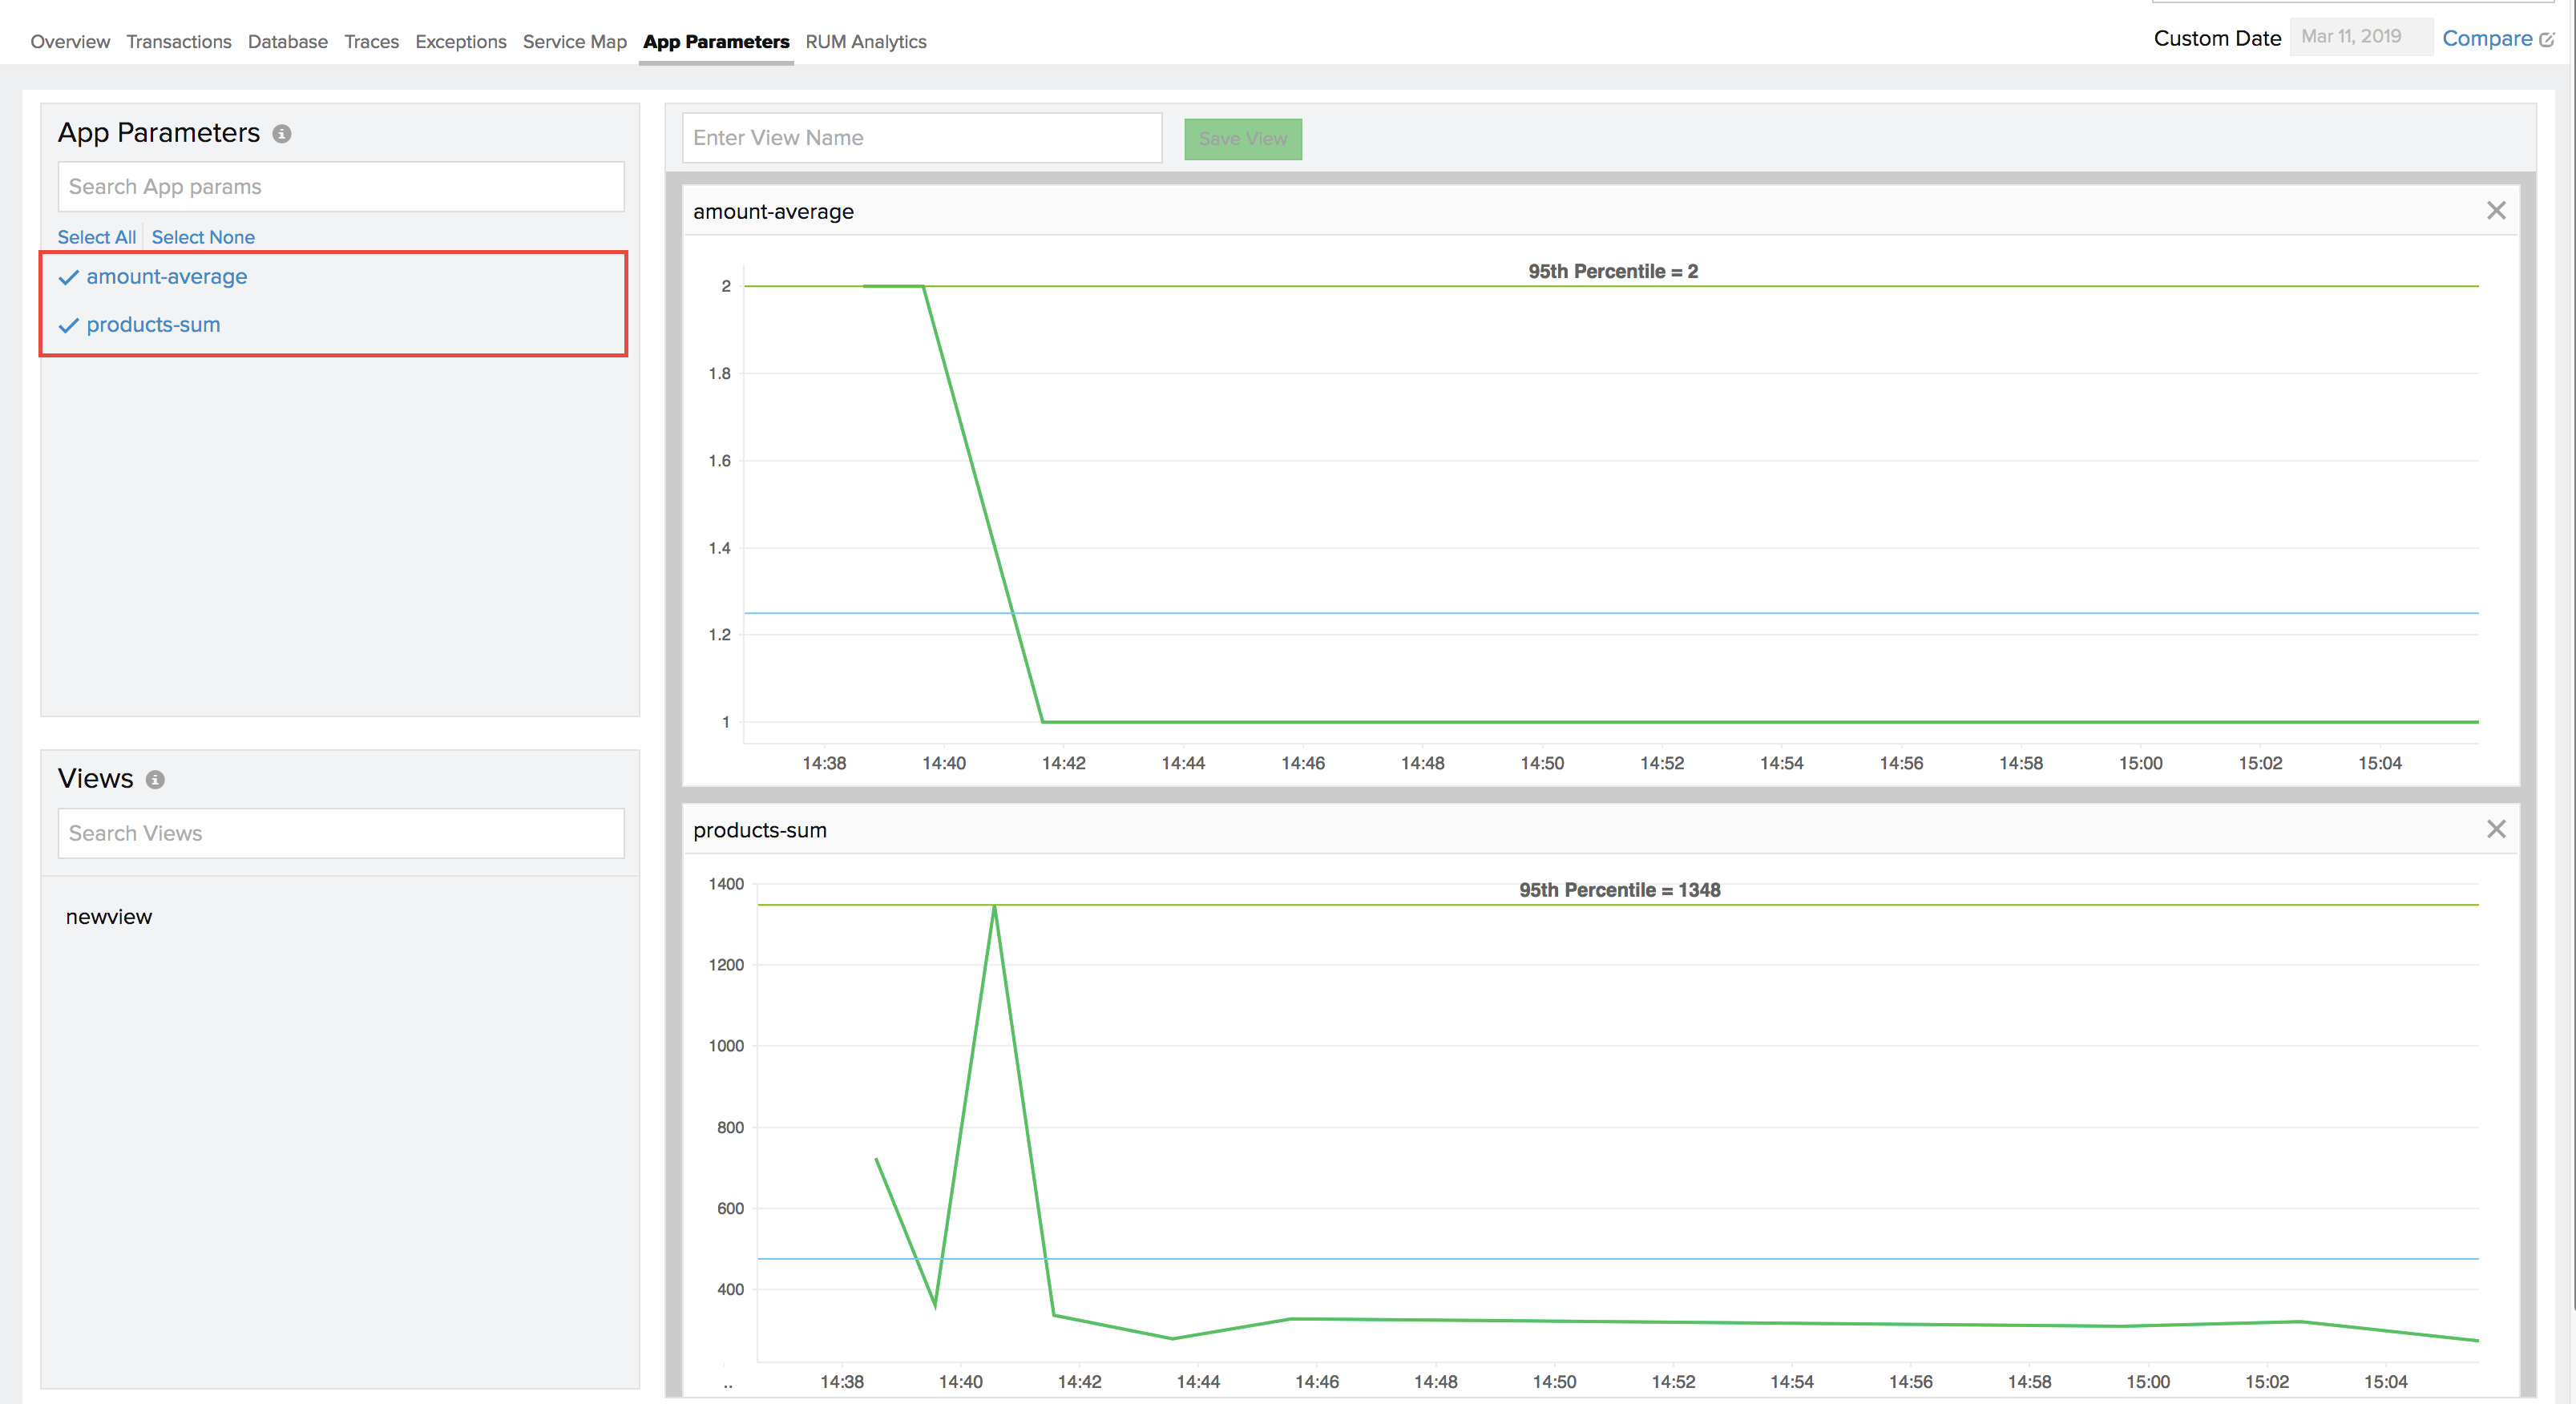
Using App Parameters, you can monitor important parameters, like the size and frequency of a variable or an operation in your application. To understand how App Parameters work, refer here.
API to instrument app parameters
incrementCustomMetric: This API collects the sum of custom metrics.
Syntax:
apminsight.incrementCustomMetric(metricName, metricValue)
metricName : string value
metricValue : optional, if it is not present then metric will incremented by 1
Example:
var apminsight = require('apminsight');
var app = require('express')();
var http = require('http').Server(app);

app.get('/buy', function(req, res){
apminsight.incrementCustomMetric('products', req.product.count);
res.sendFile(__dirname + '/index.html');
});
http.listen(3000);
averageCustomMetric: This API collects the average of custom metrics.
Syntax:
apminsight.averageCustomMetric(metricName, metricValue)

metricName : string value
metricValue : number
Example:
var apminsight = require('apminsight');
var app = require('express')();
var http = require('http').Server(app);

app.get('/pay', function(req, res){
apminsight.averageCustomMetric('amount', req.amount);
res.sendFile(__dirname + '/index.html');
});
http.listen(3000);
Output:

Track custom parameters
To give contextual meaning to traces, you can add additional parameters which can help you identify the context of the transaction trace.
Contextual metrics can be anything, a session id, user id or certain method parameters which can help you identify the specific information about a transaction trace.
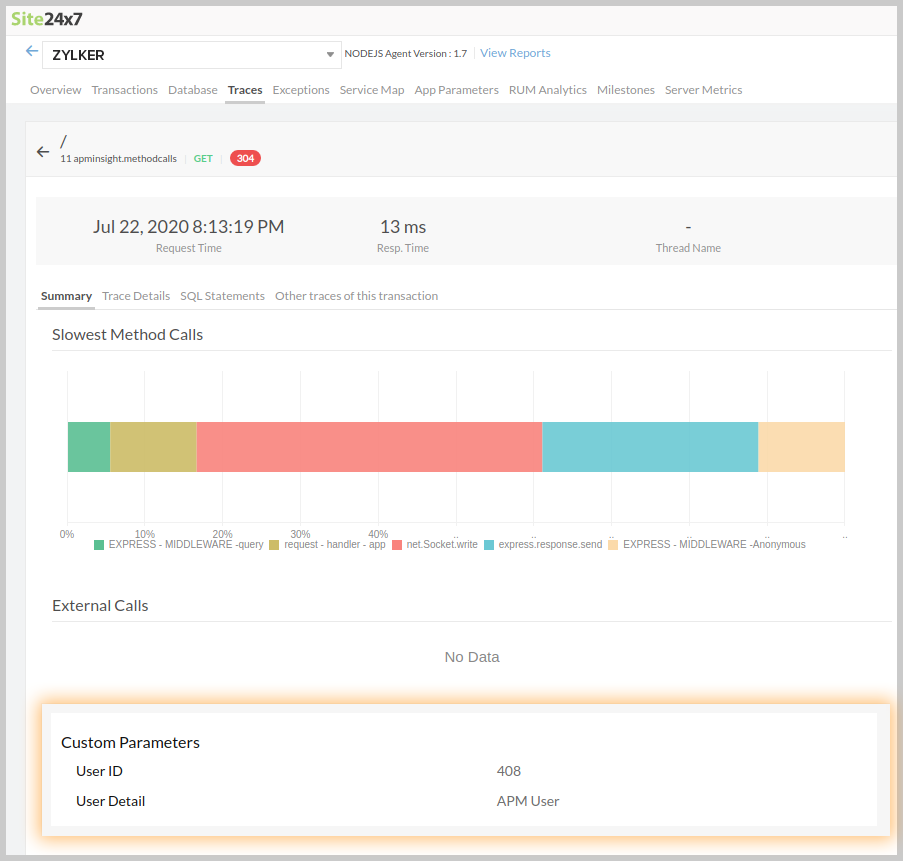
You can add a maximum of 10 parameters to a transaction trace, these parameters can be viewed under Trace Summary
Syntax to track custom params
Syntax:
apminsight.addParameter("key", value);
Key - Name of the parameter
Value - Parameter of the value. It can be of any type, internally agent converts them to string.
Example:
var apminsight = require('apminsight');
var app = require('express')();
var http = require('http').Server(app);
app.get('/', function(req, res){
apminsight.addParameter("User Detail", "APM User");
apminsight.addParameter("User ID", 408);
res.sendFile(__dirname + '/index.html');
});
http.listen(3000);
OUTPUT:
The added parameter values will be displayed under the Custom parameters section of Trace details tab as follows:

