Memory Leak Detection
Memory Leak Detection in Site24x7 APM allows you to detect and address memory leaks before they seriously affect your application's performance.
What is a memory leak?
A memory leak occurs in an application when memory resources are allocated but not properly released once they are no longer required. This frequently happens as a result of poor coding practices.
The server runs out of memory when an application uses additional memory without releasing it. When the server memory is completely utilized, it will cause the application to crash.
In Java, the memory allotted for resources is usually released during garbage collection. At times, some resources are skipped during garbage collection, which results in a memory leak in the application.
The On-Demand Memory Profiling in the Memory Leak Detection tab tracks the collection and identifies potential leaks using a linear regression model. You can identify the root cause of the leak by tracking the growth of the objects in the collection over a period of time.
On-Demand Memory Profiling
With On-Demand Memory Profiling, you can quickly identify the classes in your code stack that consume the most memory. All objects collected during the specified time are listed along with the associated metrics.
Follow the steps below to initiate On-Demand Memory Profiling:
- Log in to your Site24x7 web client.
- Go to APM > your Java application.
- Click the JVM tab, then click the Memory Leak Detection tab underneath it.
- To start Memory Profiling, click the Initiate Memory Profiling button.
Note
You can only perform On-Demand Memory Profiling 10 times per day for each instance.

- Change the listed parameters to customize the profiling.

- Profiling Duration: Choose the duration from 5-30 minutes for the profiler to collect objects.
- Object Age: Provide an age from 1-9 minutes for the objects to be captured during profiling.
For example:If Object Ageis set to 5, the objects that are active five minutes after starting the profiling will be captured.NoteThe maximum value for the age is 30% of the value set for Profiling Duration.
For example: If Profiling Duration is set to 20, you can select an age from 1-6, since 6 is 30% of 20. - Instance(s):On-Demand Memory Profiling can be initiated for both applications and instances.
- In the application view, you can select multiple instances for which you want to initiate profiling.
- In the instance view, the particular instance will be selected by default, and the Instance(s) drop-down will be disabled.
- Click Start to initiate Memory Profiling.
When On-Demand Memory Profiling is initiated, the Initiate Memory Profiling button will be replaced with the Profiling Initialized button, which is disabled.

Please keep in mind that the Initiate Memory Profiling button is disabled when:
- The monitor status is down or suspended.
- The Java agent version is below 5.8.
- Memory leak profiling is currently being performed.
Once the On-Demand Memory Profiling process is completed, the captured data will be displayed on the Memory Leak Detection tab. The following views are available for the captured metrics:
Table View
In Table View, the Memory Objects collected during profiling as well as the metrics associated with them are displayed.
When you click an individual memory object, you will be taken to the corresponding Details View.

| Parameter | Description |
| Class Name | The name of the class of the memory object. |
| Element Count | The total number of elements stored in the memory object. |
| Object Leak Status | Whether the object has a memory leak or not:
|
| Object Creation Time | The time when the object was captured. |
| Instance Name | The name of the instance. |
The Recent Memory Events section displays a Summary for each memory leak event associated with the selected Memory Objects and the Time at which each event occurred. This will help speed up troubleshooting and prevent similar memory leak issues in the future.
- Only the last 25 memory leak events are listed.
- When you click an event summary associated with any of the Memory Objects, you will be taken to the corresponding Details View.
Details View
In Details View, you can inspect additional details about an object by clicking the individual class listed on the left panel.

| Parameter | Description |
| Class Name | The name of the class that contains the Memory Objects. |
| Element Count | The total number of elements stored in the Memory Objects. |
You can view the associated metrics by clicking each class. The metrics are divided into three tabs:
Overview
The top band displays the object's memory leak status, the number of elements, and the object's size.
To get the object's updated size, Content Inspection or Access Tracking must be enabled.

Element Count displays a graph of the number of elements as it changes over time with a line denoting the 95th percentile.
Recent Memory Events displays a Summary for each memory event associated with the selected class and the Time at which each event occurred.
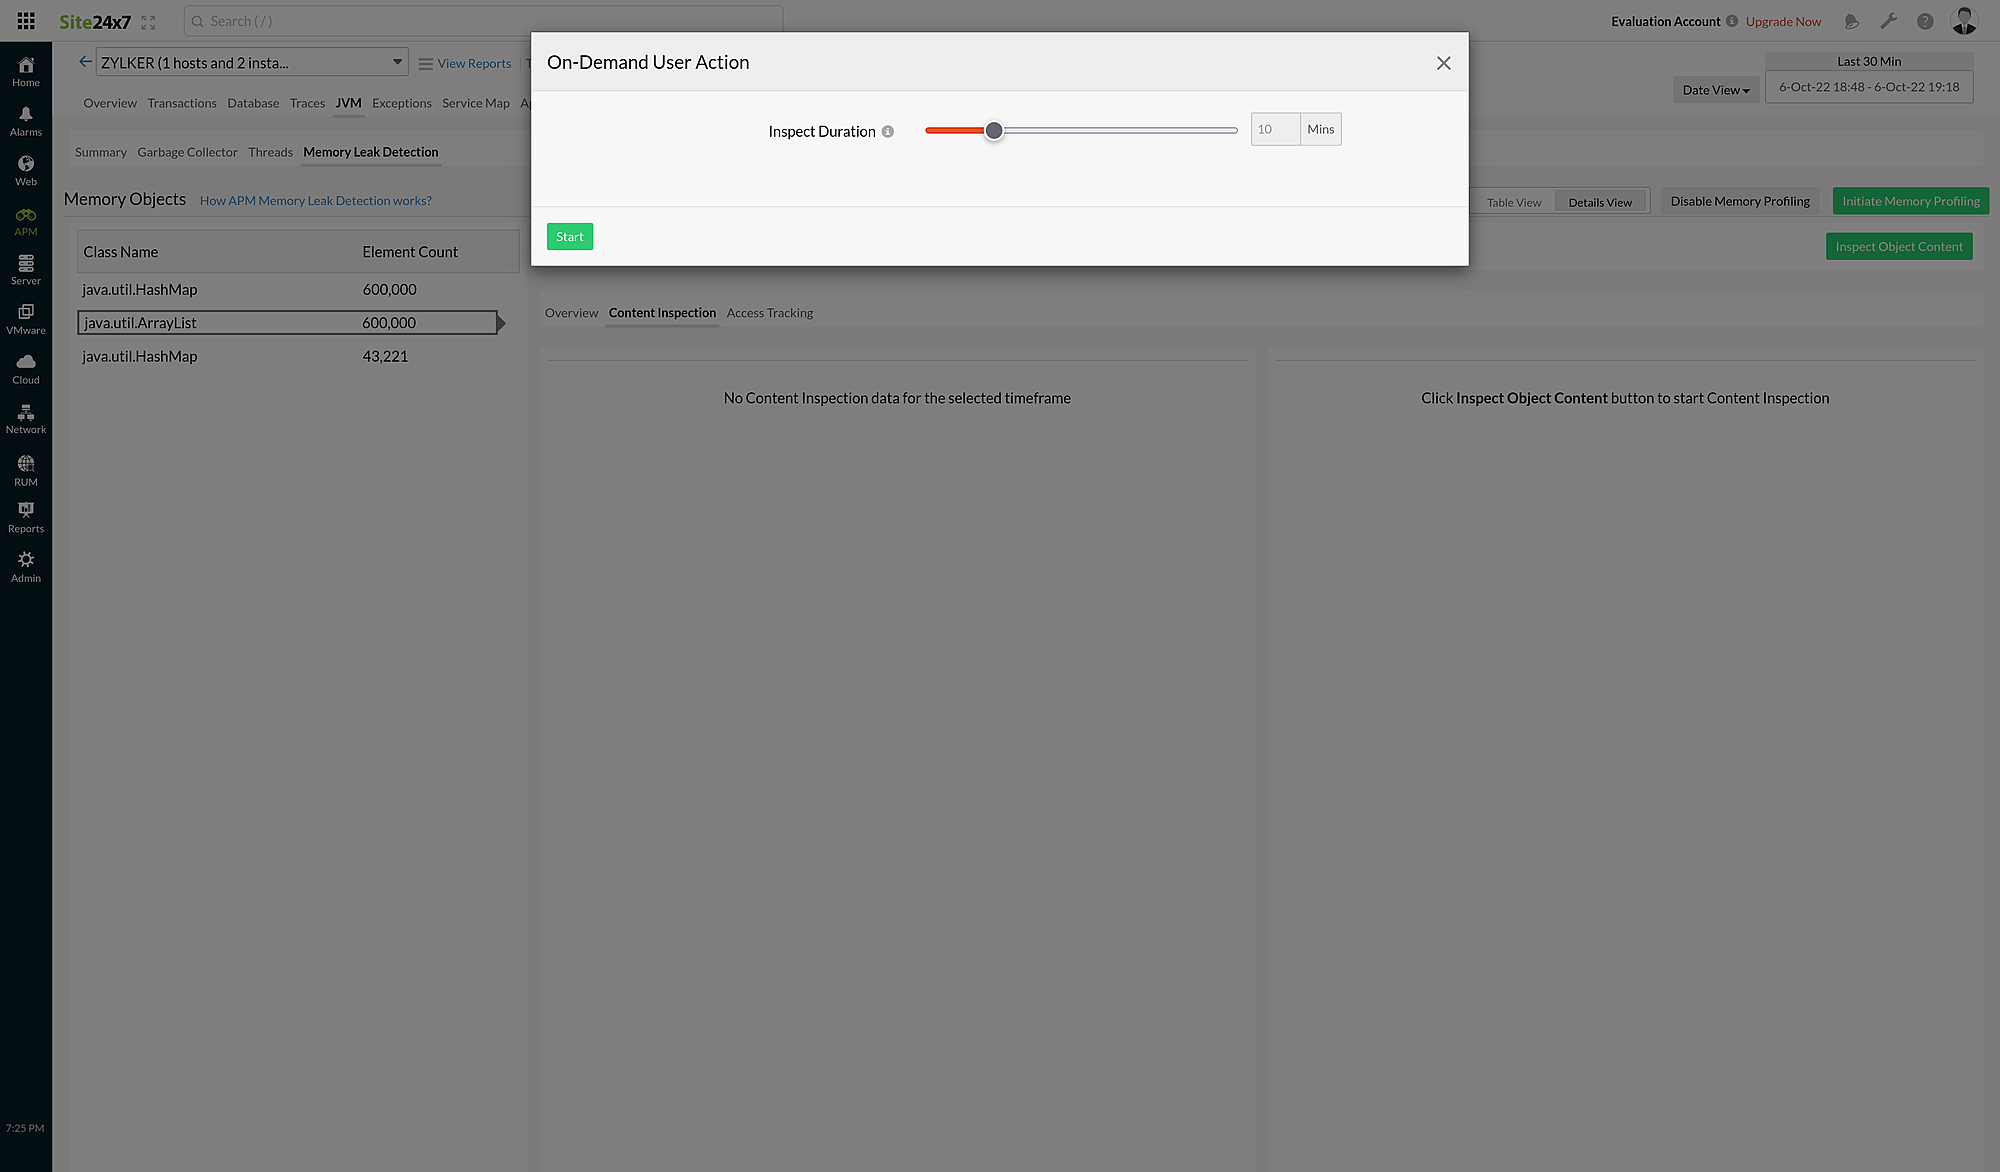
Content Inspection
When Content Inspection is requested, the agent monitors the size of the objects in the selected class. If the size of the objects changes every minute (within the time frame specified by the user), the agent picks the data and displays it in the Site24x7 web client once every minute. Thus, you can view the data that is updated every minute on the Content Inspection tab.
To begin Content Inspection:
- Select the class from the left panel and click Inspect Object Content to launch the On-Demand User Action dialog box.
Note
When there is a memory leak, the agent automatically enables the Content Inspection process.
- Specify the Inspect Duration from 5-30 minutes.
- Click Start to initiate the Content Inspection.
Once the profiling is finished, you can view the timestamps and the respective metrics.

| Parameter | Description |
| Time | The time at which the memory object was captured. |
| Class | The memory object that was captured. |
| Count | The total number of elements stored in the memory object. |
| Size | The size of the memory object. |
- The timestamps (every minute) are displayed on the middle panel. When you click each timestamp, the objects captured at that time and their metrics will be displayed on the right panel.
- If there is no change in the size of the selected object (under Class Name), only the first minute of data will be displayed in the Site24x7 web client.
Access Tracking
When Access Tracking is requested, the agent monitors the objects in the selected class for the time period specified by the user. If the objects are accessed through any of the code paths, the agent captures those code paths. Once the tracking is completed, the captured metrics will be displayed in the Site24x7 web client.
To begin Access Tracking:
- Select the class from the left panel and click Capture Object Trace to launch the On-Demand User Action dialog box.
Note
When there is a memory leak, the agent enables the Access Tracking process automatically.
- Specify the Tracking Duration from 5-30 minutes.
- Click Start to initiate Access Tracking.

When the tracking is completed, the metrics will be displayed on the Access Tracking tab.
The agent can only capture 25 objects per session.
| Parameter | Description |
| Time | The time at which the code paths were captured. |
| Code Path | The traces in which the Memory Objects were found. |
| Occurrence(s) | The number of times the same trace was collected. |
A list of timestamps showing when the objects were captured is displayed on the middle panel. When you click a timestamp, the code path captured at that time will be displayed on the right panel.
- If the same object is accessed again via the same code path, a new timestamp will not be added; instead, the number in the Occurrence(s) field will increase by one each time.
- If the selected object (under Class Name) is not accessed within the specified time, no data will be displayed.

Use cases
Consider a situation where your Java application is unintentionally retaining object references (declared as static) that are no longer required due to logical errors in the code. These unintentional object references prevent the built-in garbage collection mechanism from freeing the memory that these objects consume. The collection object grows continuously and remains in memory throughout the application's lifetime, preventing vital memory from being used elsewhere.
How does our APM agent decide whether an object is a leak?
Site24x7 considers the following criteria before capturing the Java collection object:
• The user must provide the age of the object when the memory leak was initiated.
• The number of elements in the collection or map must be greater than 1,000.
• The size of the object must be greater than 5MB.
The Java agent captures the collection objects and confirms potential leaks using a linear regression model. Site24x7 monitors the size of the collection objects after they qualify as having a long-term growth trend. Positive growth indicates that the collection object is a potential leak object and the source of a memory leak.
The next step to take once you confirm the object as a potential leak
After detecting a potential memory leak, you must troubleshoot it by performing the following actions:
- Make use of Content Inspection.
Content Inspection tells you what data the collection object is holding in the application so that you can begin troubleshooting. It allows you to keep track of the histograms of all the elements in a specific collection. - Make use of Access Tracking.
Access Tracking displays the actual code paths that access the collection object.
Best practices to avoid or prevent a leak
• Avoid declaring the collection objects as static in places where it is not necessary.
• Choose the right collection or map.
• Use the diamond operator and generic type.