
LLM Observability in Site24x7
Large language models (LLMs) are increasingly used in applications to generate content, answer queries, automate workflows, and power AI-driven experiences. As applications interact with multiple LLMs, monitoring their performance, usage, reliability, and cost becomes important for maintaining an efficient AI application.
Site24x7’s LLM Observability provides visibility into LLM interactions from a centralized console. It helps you analyze requests across models, track latency and token consumption, understand model-wise costs, identify errors, and investigate individual LLM calls and requests.
By bringing performance, usage, cost, and prompt-level information together, LLM Observability helps you understand how different models are being used and how they affect the performance and operational cost of your applications.
Use cases
You can use LLM Observability to:
- Monitor LLM performance: Track request volume and response latency (including P95 and P99 latency) across models to identify slow-performing models or unusual changes in performance.
- Analyze token consumption: Monitor input and output token usage to understand how tokens are consumed by individual models.
- Control LLM costs: Analyze total cost, average cost per request, and model-wise costs to identify models or workloads contributing significantly to LLM expenditure.
- Compare models: Compare request count, latency, token consumption, and cost across models to understand their relative performance and usage.
- Identify errors: Monitor the number and trend of failed LLM requests to identify reliability issues.
- Analyze prompts: Review individual LLM interactions and associated request information to investigate model usage at the prompt level.
- Plan LLM usage: Analyze historical token consumption and usage trends to understand and plan LLM resource consumption.
Configure LLM Observability data collection
Before you can view LLM Observability data in Site24x7, configure your LLM application to send OpenTelemetry telemetry to Site24x7. You can use a supported OpenTelemetry-compatible instrumentation method to instrument your application and export the generated telemetry to Site24x7.
View LLM Observability data
To view LLM Observability data:
- Log in to the Site24x7 web client.
- Navigate to APM > LLM Observability.
- Select the required time period and use Add Filter to narrow the displayed information when required.
- Use the Dashboard, Prompt Analysis, and Logs tabs to analyze different aspects of your LLM activity.
Note: The selected time period applies to the LLM Observability data displayed in the console.
Filter LLM Observability data
Use Add Filter to narrow the LLM Observability data based on specific services or models. You can add filters based on the service's name and model.
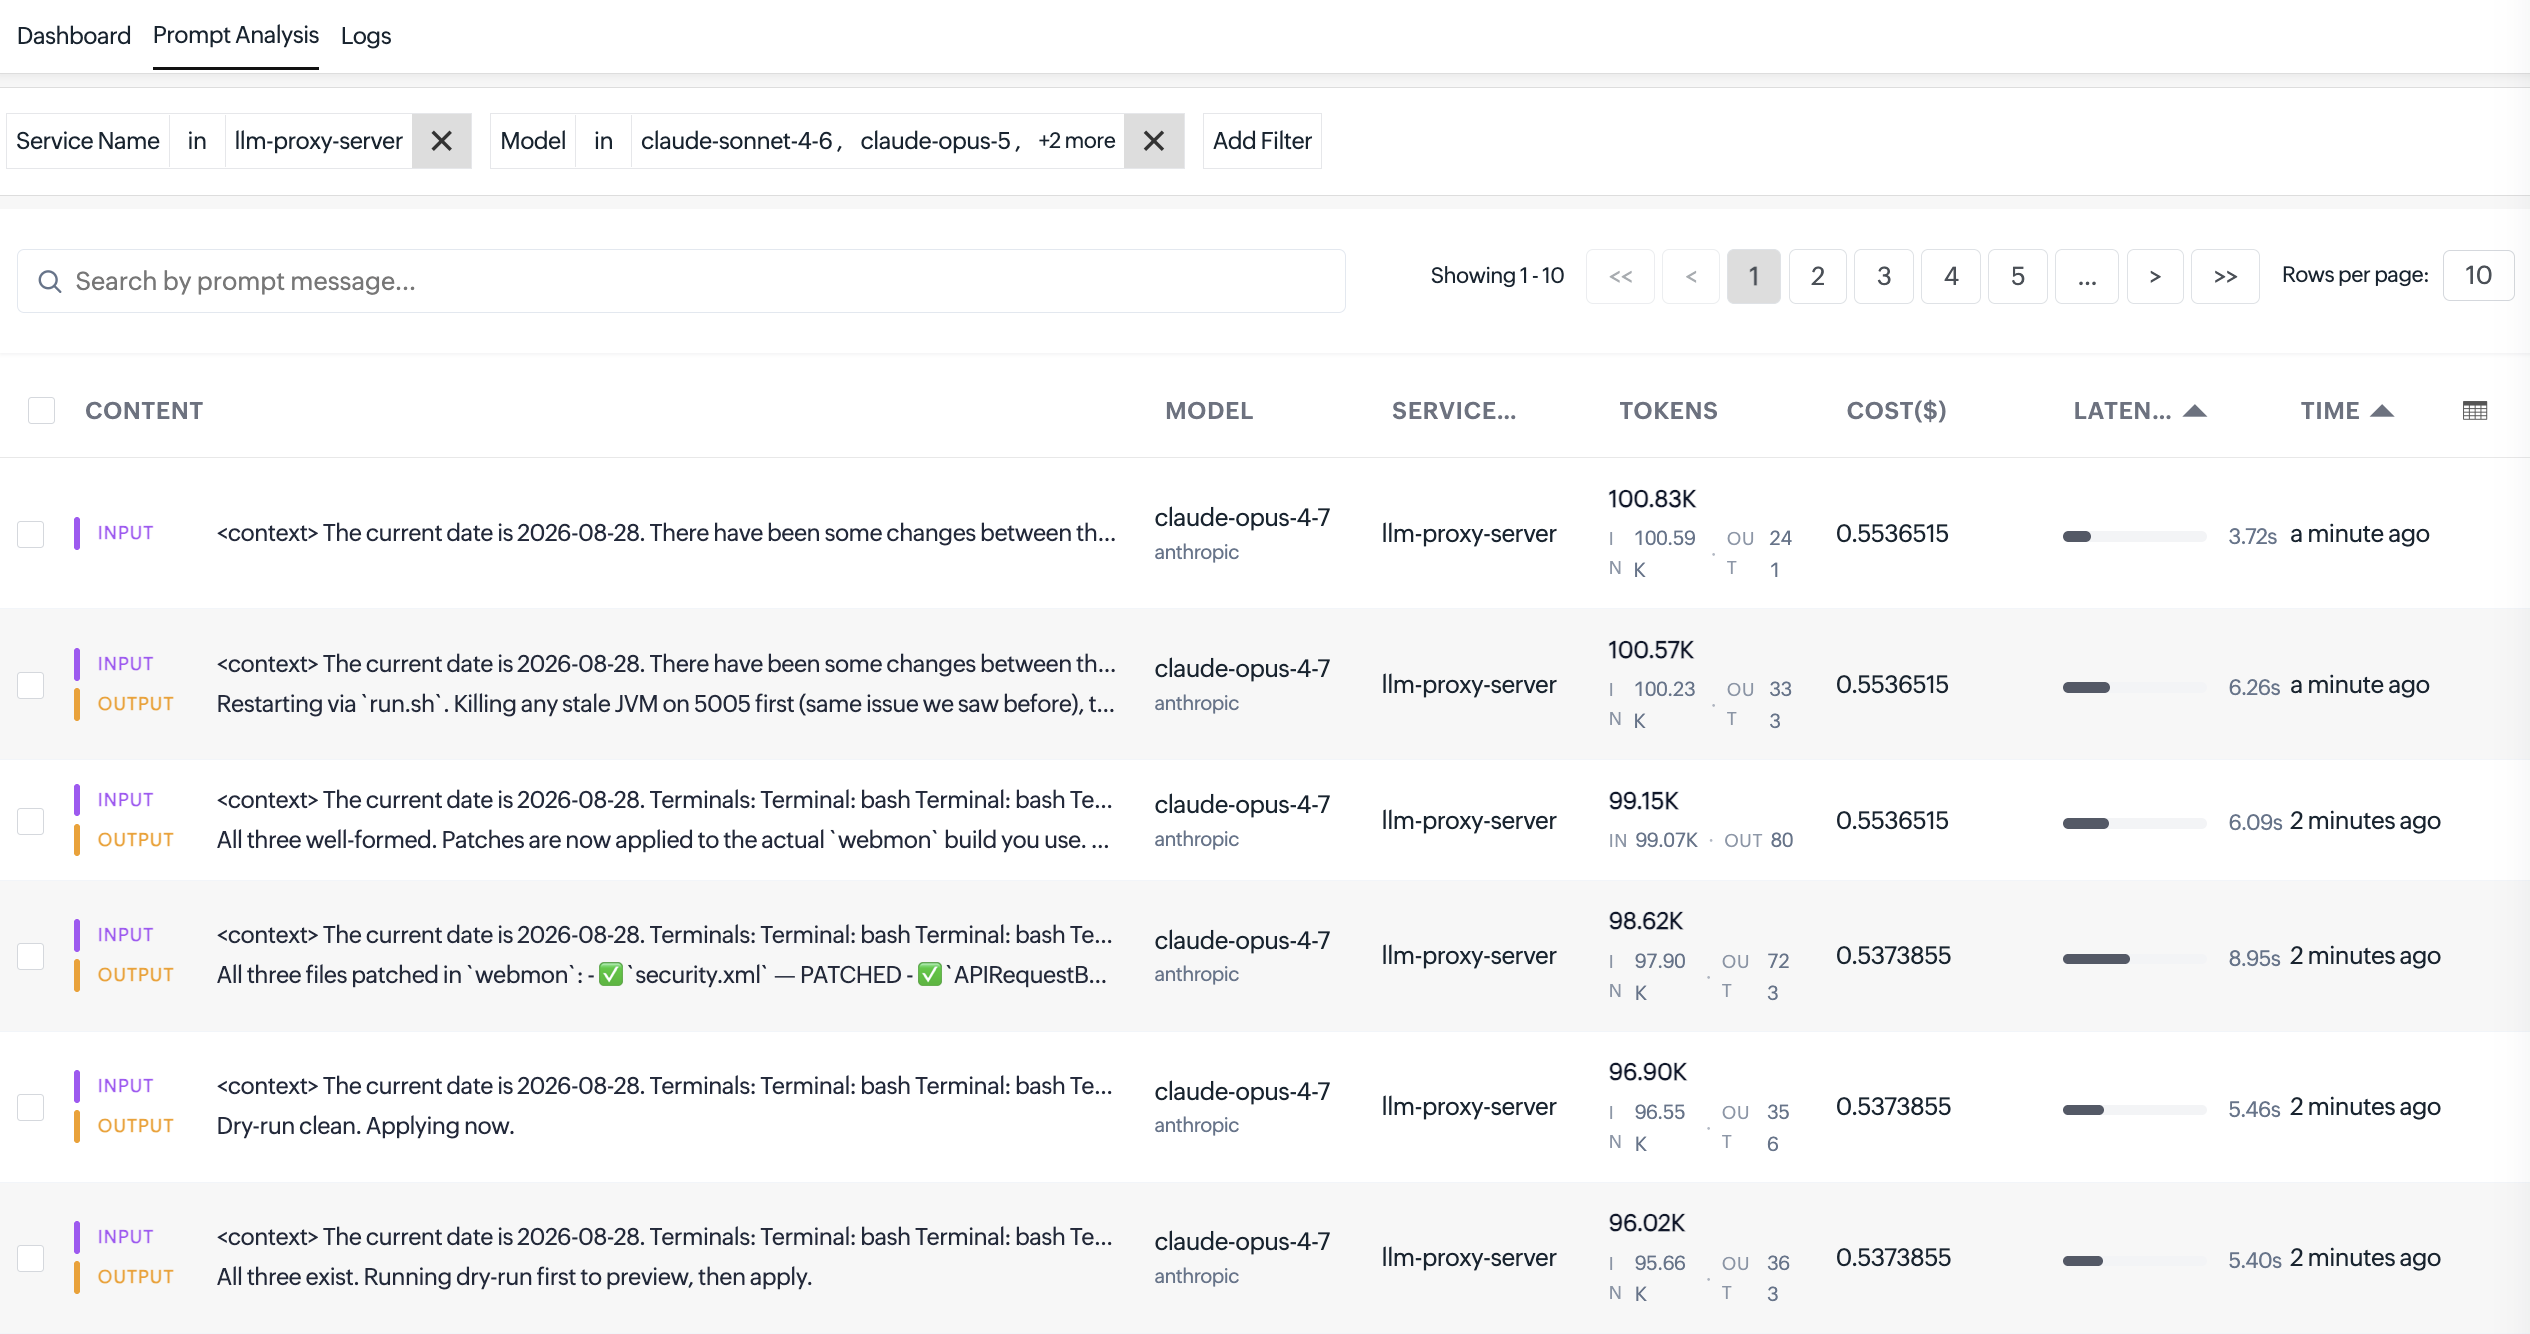
Select a filter and choose one or more values from the available options. Both Service Name and Model filters support multiple selections, allowing you to analyze data for multiple services or models at the same time. You can also add more filter conditions to further refine the displayed data.
The filters are common to the Dashboard and Prompt Analysis tabs. When you apply a filter in either tab, the same filter remains active when you switch between these tabs. For example, if you select specific models in the Prompt Analysis tab and then navigate to the Dashboard tab, the Dashboard displays metrics only for the selected models.
To remove a filter condition, click the X icon next to the corresponding filter.
Dashboard
The Dashboard provides an overview of LLM performance, utilization, token consumption, costs, and errors. It combines summary metrics with model-wise charts and comparison tables, helping you quickly understand how your LLM models are behaving.
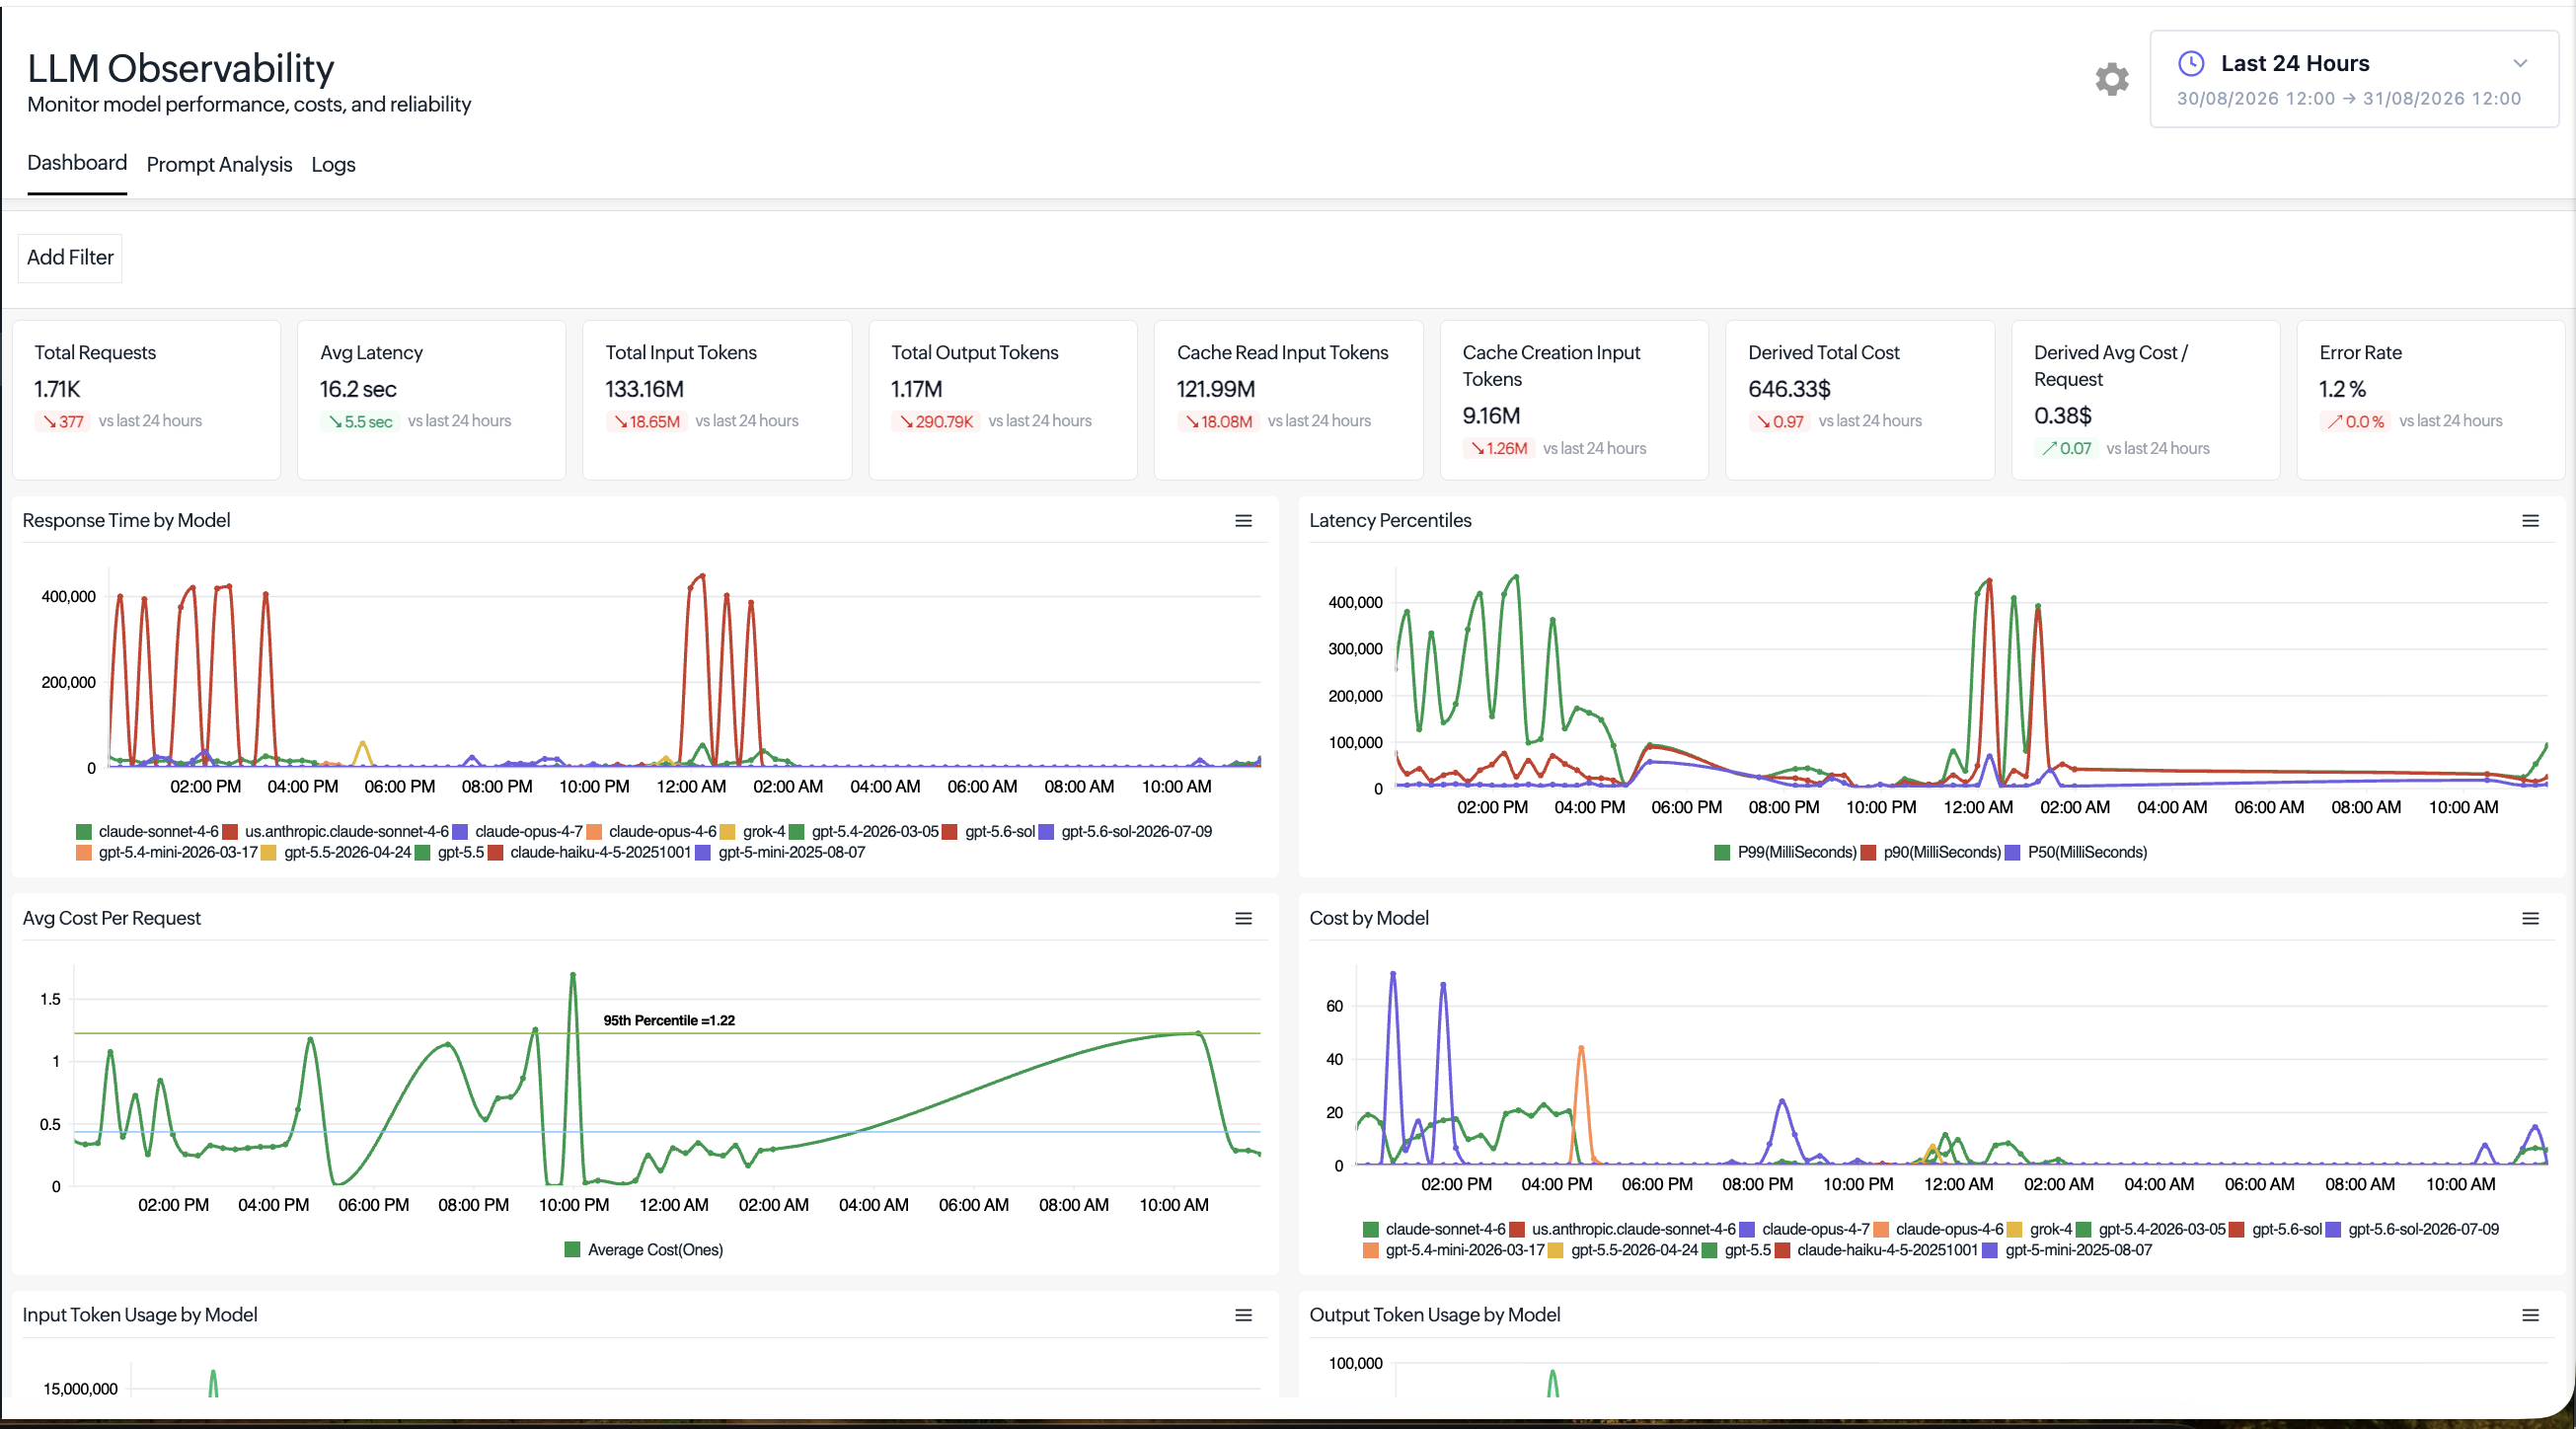
The top section of the Dashboard displays the following metrics:
| Metric | Description |
|---|---|
| Total Requests | Total number of LLM requests recorded. |
| Avg Latency | Average time taken to process LLM requests. |
| Total Input Tokens | Total number of input tokens consumed by LLM requests. |
| Total Output Tokens | Total number of output tokens generated by LLM responses. |
| Cache Read Input Tokens | Number of input tokens retrieved from the model’s cache. |
| Cache Creation Input Tokens | Number of input tokens used for creating cache entries. |
| Derived Total Cost | Derived Total Cost is derived based on the model pricing information available from OpenRouter. Note: Since model and provider pricing can vary, the derived cost may differ from the actual amount billed by your LLM provider. |
| Derived Avg Cost / Request | Average cost incurred for each LLM request. |
| Error Rate | Percentage of LLM requests that resulted in errors. |
Response Time by Model
The Response Time by Model graph displays response-time trends for the different LLM models over the selected period.
Use this graph to compare model performance and identify models experiencing increased response times or latency spikes.
Latency Percentiles
This graph displays request latency at different percentile levels, including P50, P90, and P99.
Percentiles help you understand the latency experienced across the request distribution rather than relying only on an overall average. For example, higher percentile values can help identify slower requests that might otherwise be hidden by the average latency.
Avg Cost Per Request
This graph displays changes in the average cost incurred for individual LLM requests over time.
Use this graph to identify periods in which the average request cost increases and correlate the change with model or token usage.
Cost by Model
This graph displays the cost incurred by individual LLM models over the selected period.

This helps identify models contributing the most to overall LLM expenditure and compare model-wise spending patterns.
Input Token Usage by Model
This graph displays the number of input tokens consumed by each model over time.
Use this graph to identify models processing large prompts or workloads and compare input token consumption across models.
Output Token Usage by Model
This graph displays the number of output tokens generated by individual models.
This helps you identify models generating higher volumes of output and understand how output token consumption changes over time.
Token Usage Forecast
The Token Usage Forecast graph displays historical token consumption and forecasts future token usage based on the observed usage trend. The Forecast Start Time marker indicates where the forecast period begins, distinguishing predicted token usage from historical data.

Use this graph to understand expected token consumption, anticipate changes in usage, and plan LLM usage and associated costs accordingly. Hover over the graph to view the predicted total token count for a specific time.
Model Usage by Request Count
This chart compares models based on the number of requests processed by each model.
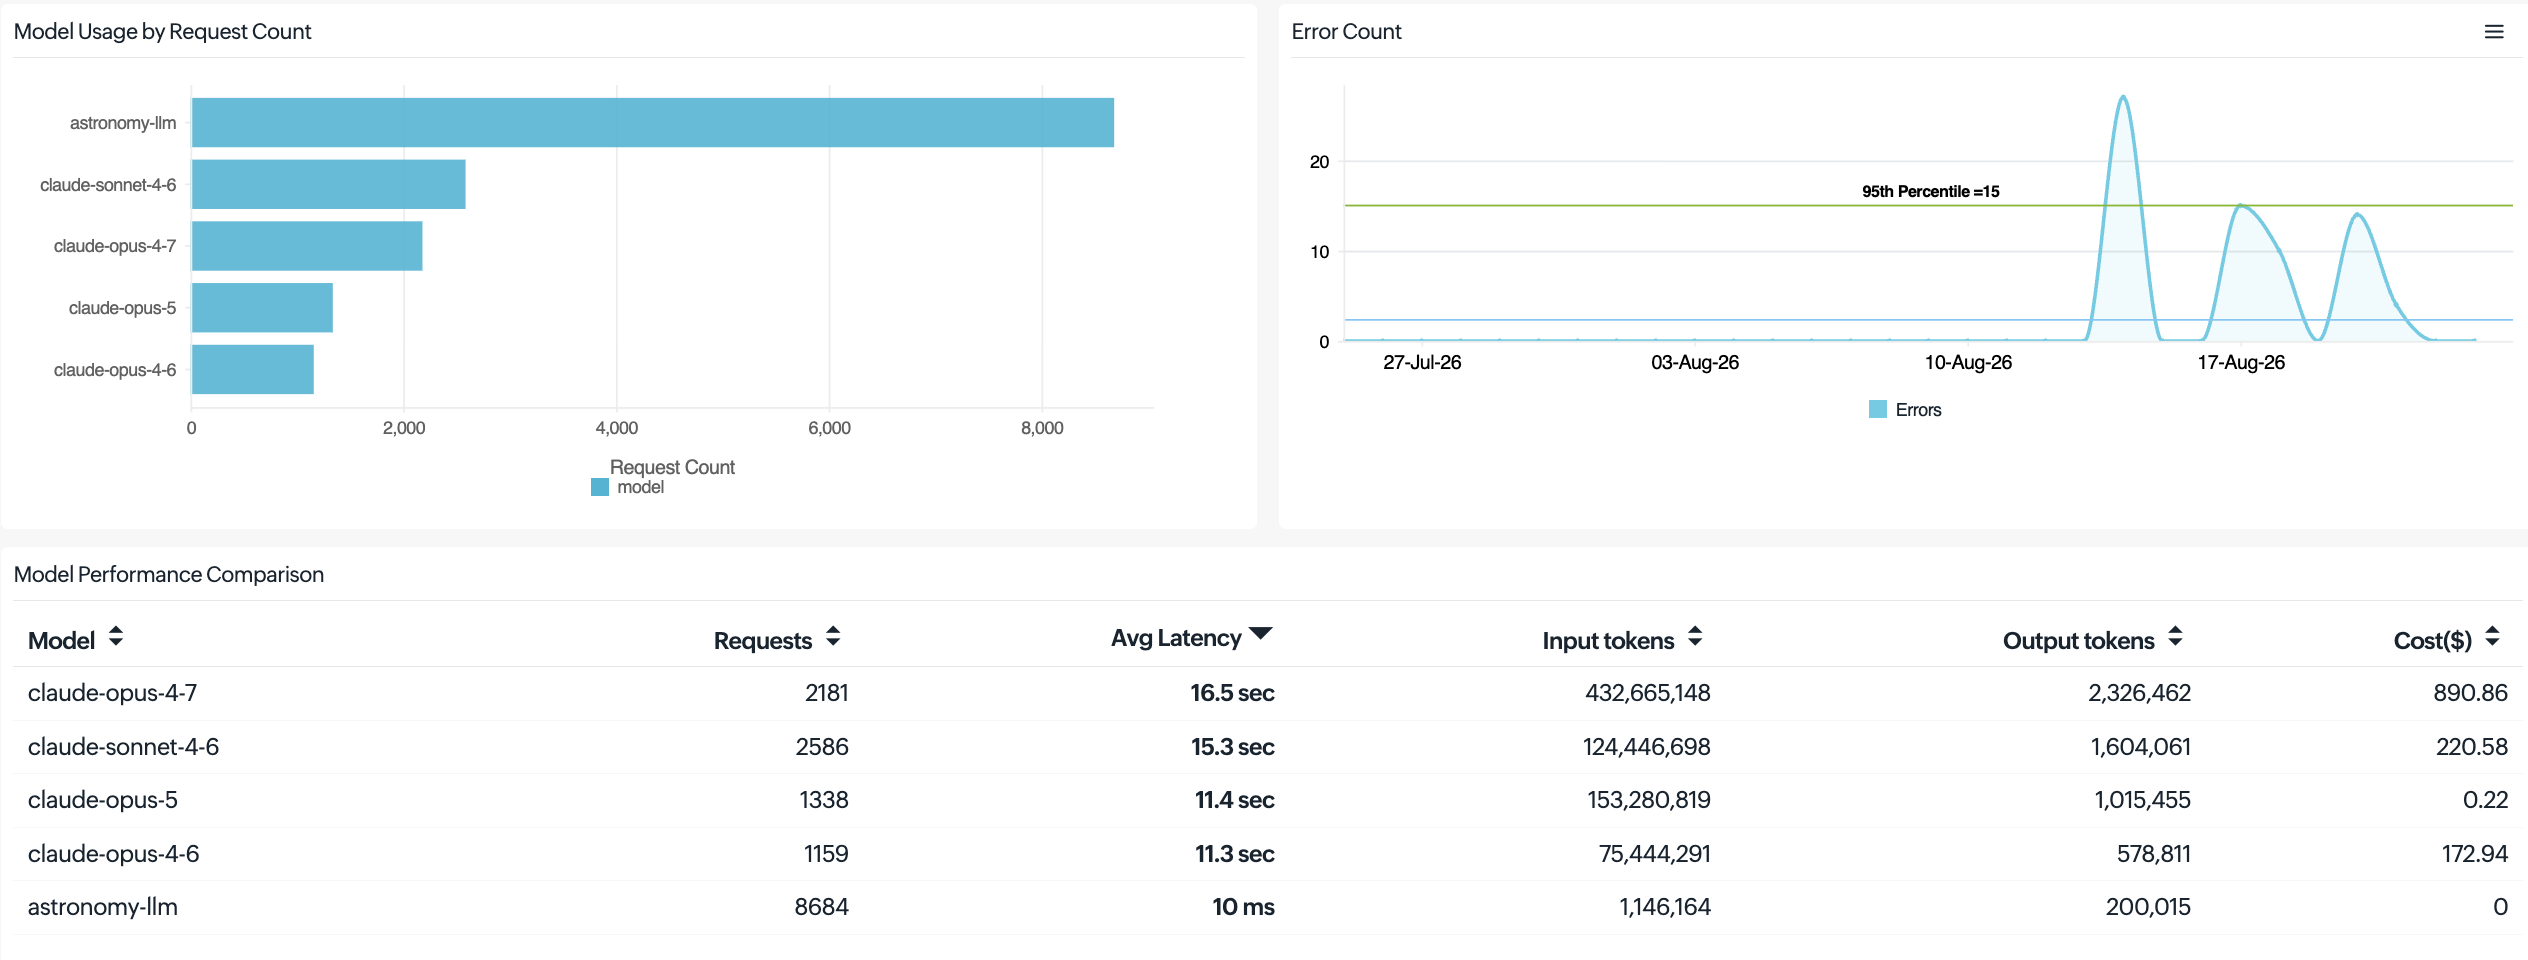
Use this chart to quickly determine which models are used most frequently by your applications.
Error Count
This graph displays the number of errors recorded over time.
Use this graph to identify error spikes and periods of increased LLM request failures for further investigation.
Model Performance Comparison
This table provides a consolidated model-wise comparison using the following metrics:
| Metric | Description |
|---|---|
| Model | Name of the LLM model. |
| Requests | Total number of requests processed by the model. |
| Avg Latency | Average request latency for the model. |
| Input tokens | Total number of input tokens consumed by the model. |
| Output tokens | Total number of output tokens generated by the model. |
| Cost ($) | Cost associated with the model’s usage. |
Use this table to compare models and identify differences in utilization, performance, token consumption, and cost from a single view.
Tokens Per Call by model
This table provides model-wise information about the average number of tokens consumed for each request.

| Metric | Description |
|---|---|
| Model | Name of the LLM model. |
| Avg Input | Average number of input tokens consumed per call. |
| Avg Output | Average number of output tokens generated per call. |
| Avg Total | Average total number of input and output tokens consumed per call. |
| Distribution | Visual representation of token distribution for the model. |
This information can help identify models or workloads with high token consumption per request.
Prompt Analysis
The Prompt Analysis tab provides request-level visibility into LLM interactions.
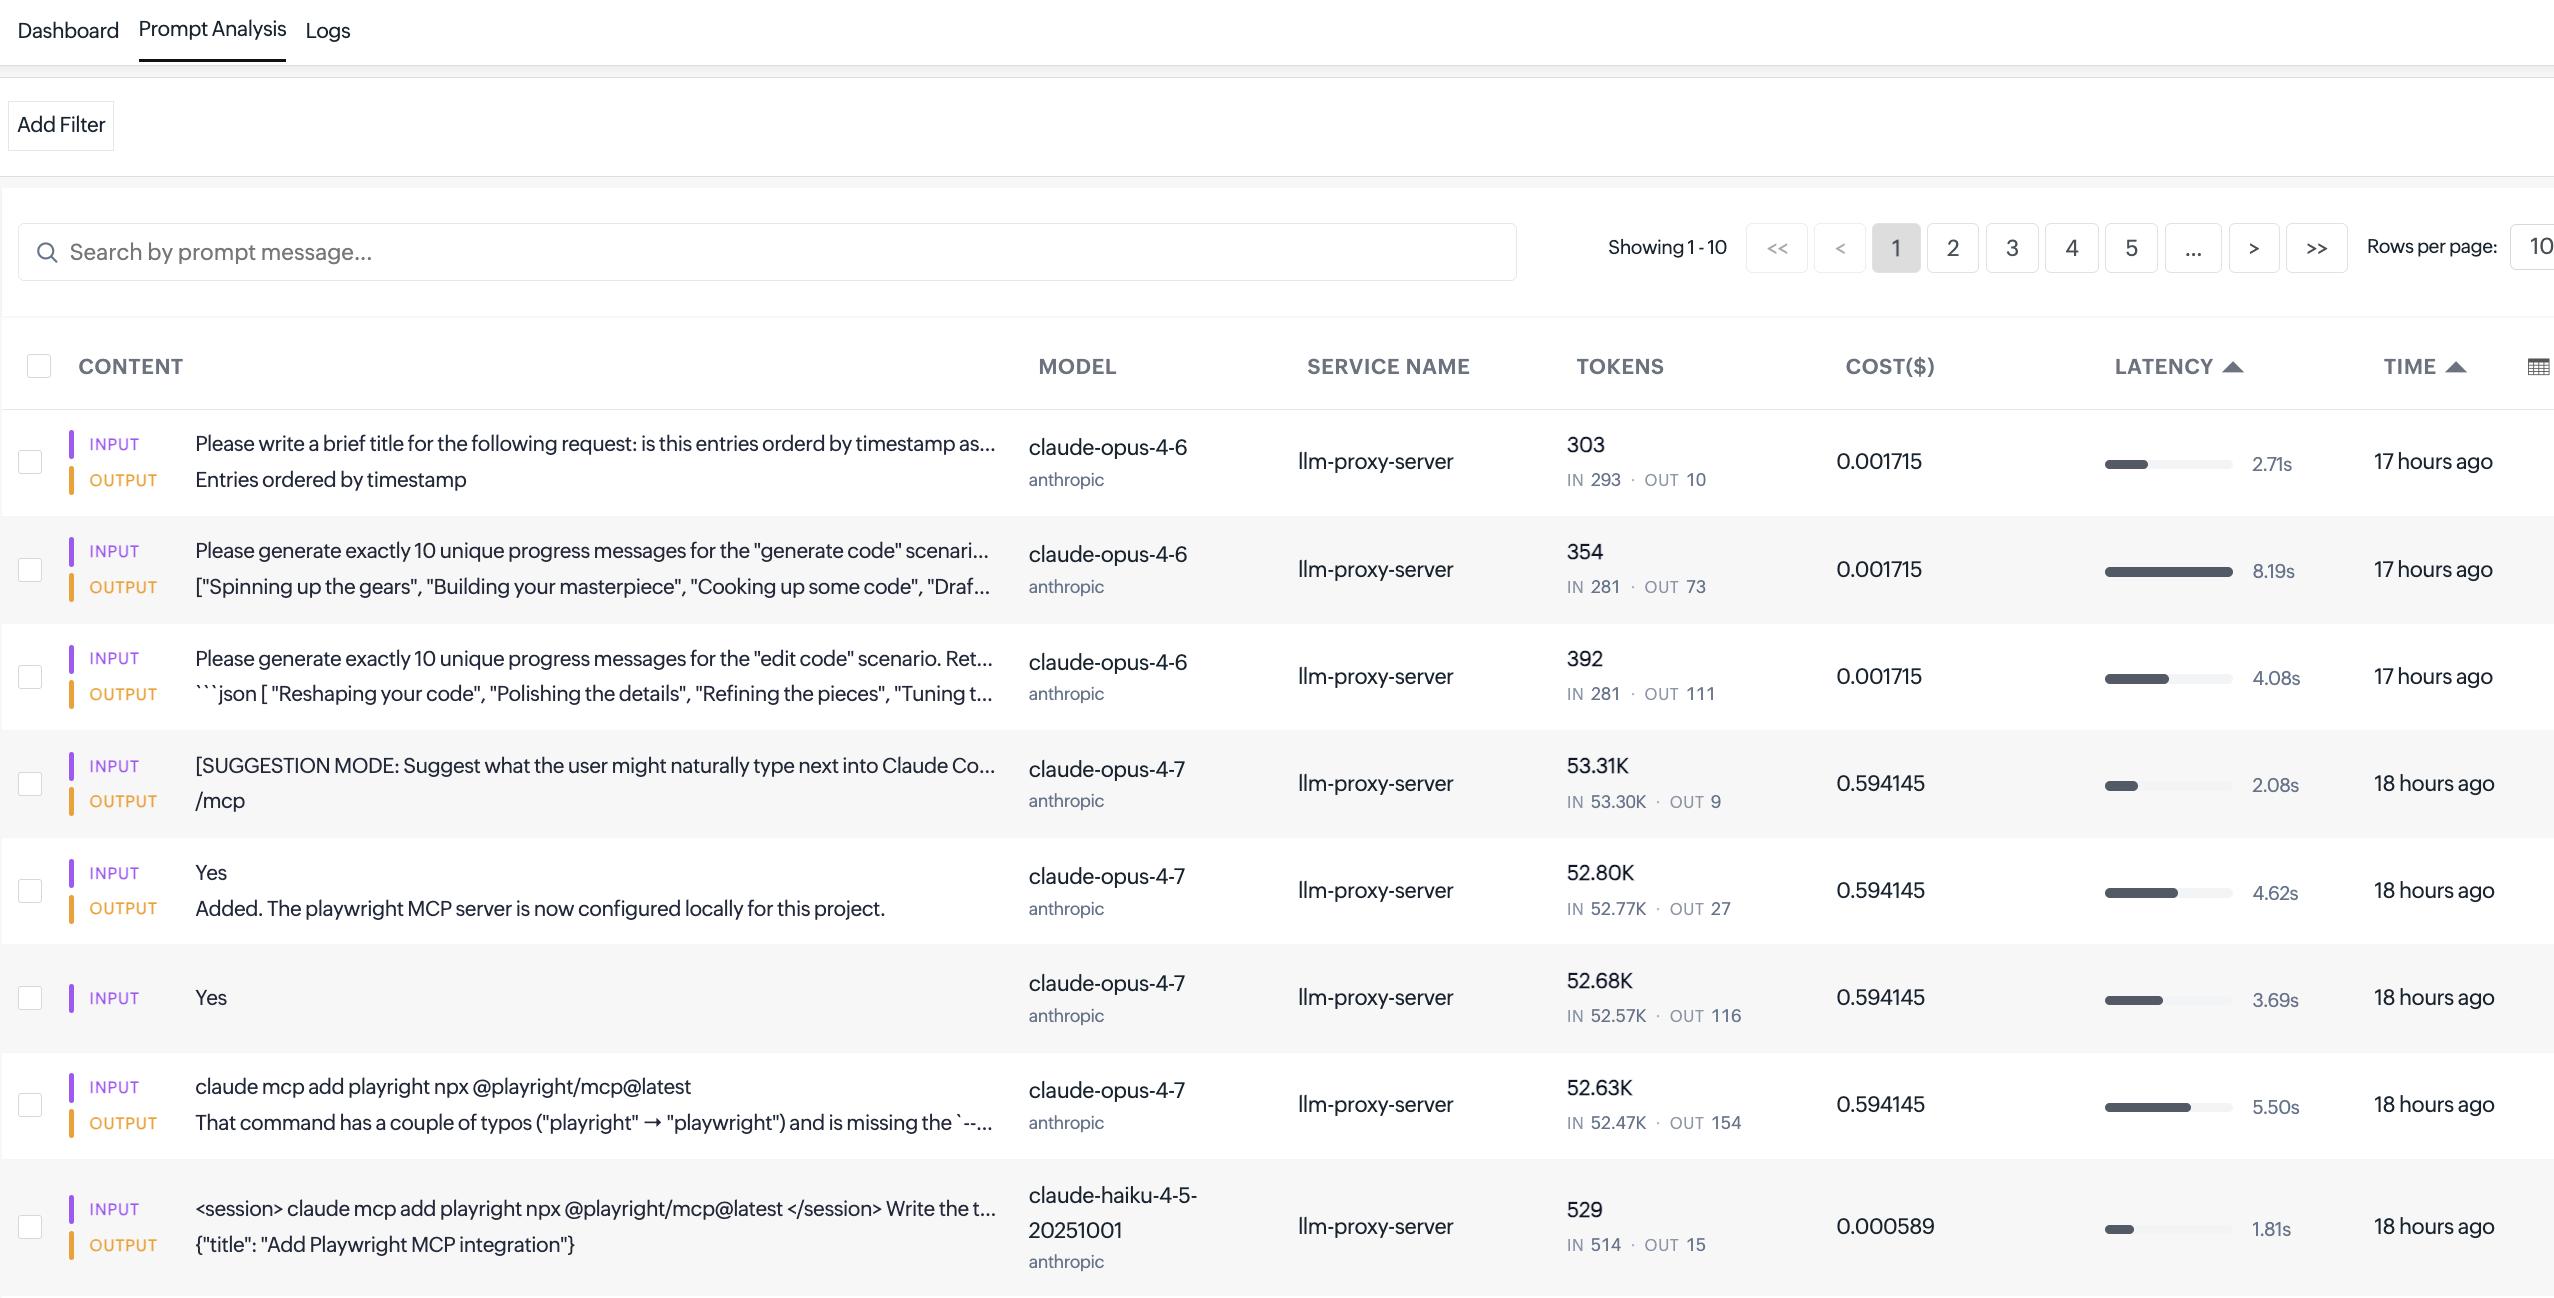
Use the search field to search for a prompt message and locate specific LLM interactions. The records display information such as the prompt content, model, service, token usage, cost, latency, and request time, based on the data available for each request.
View prompt details
Click any record in the Prompt Analysis tab to view detailed information about the selected LLM interaction. The details pane displays an overview of the request, including the model and provider, request duration, input and output token usage, cost, and request time. It also displays the captured Input and Output for the request.
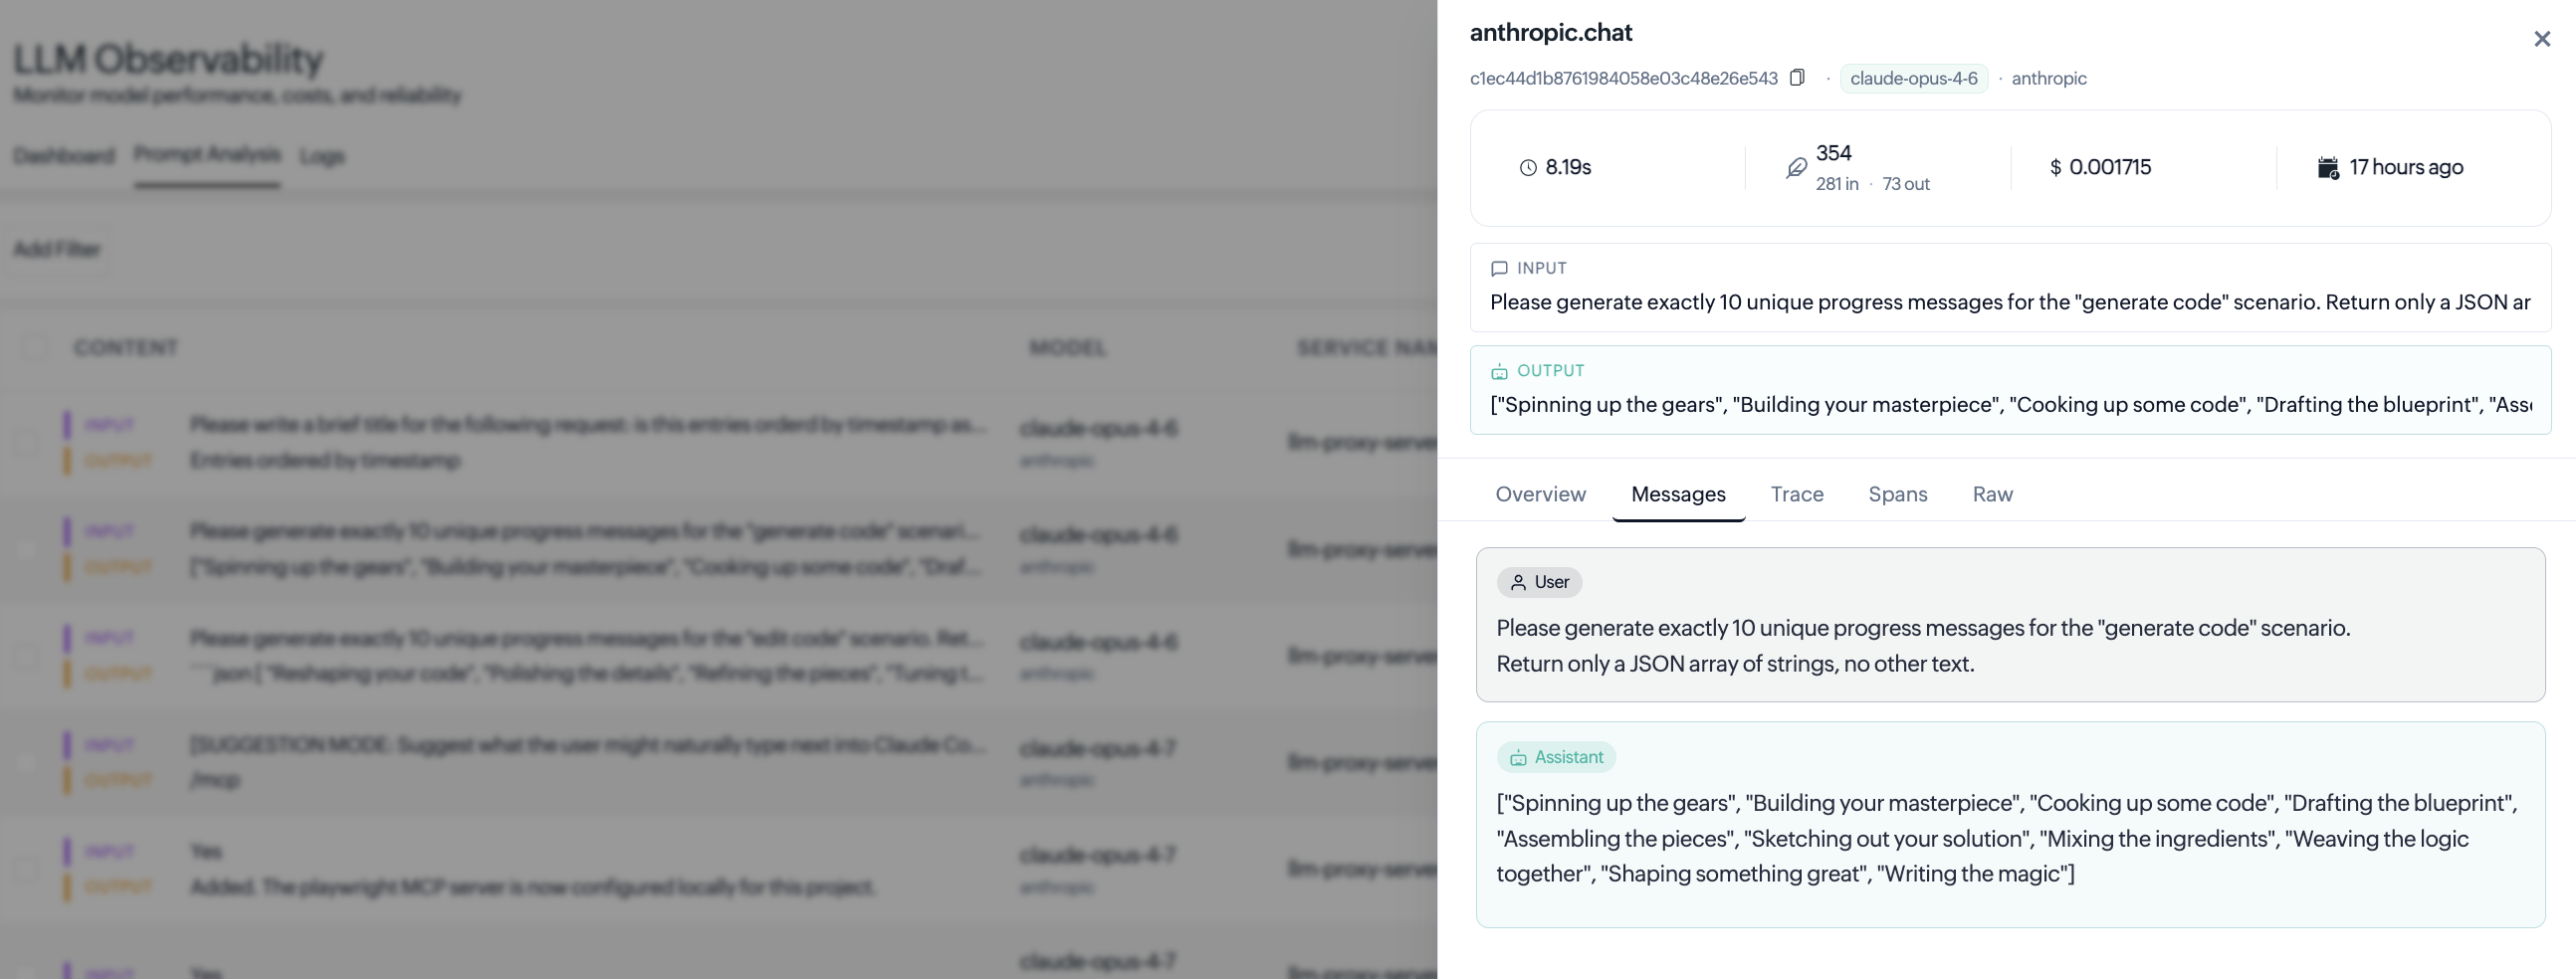
The following tabs provide additional information about the selected interaction:
Overview
The Overview tab displays the key details of the selected LLM request, including the trace ID, root span, start time, duration, model, vendor, span count, token usage, cost, and status.
Messages
The Messages tab displays the complete conversation history associated with the selected LLM request or event. It can include user messages, assistant responses, agent calls, tool calls, and skill usage captured during the interaction.
Trace
The Trace tab displays the complete application trace that contains the selected LLM event as a timeline. It shows the sequence and duration of operations involved in the request, including the LLM call and other related application operations within the same trace.
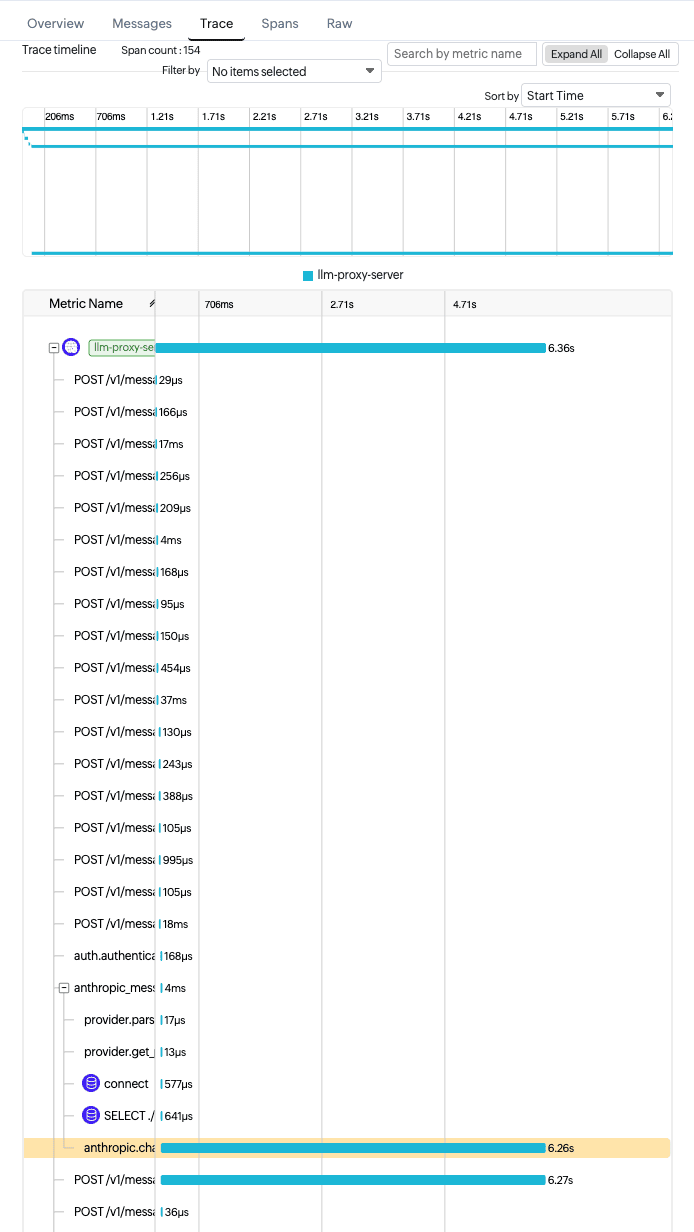
Use this view to understand where the LLM request occurs in the overall application flow and identify operations contributing to the total response time. The selected LLM event is highlighted in the trace, allowing you to correlate its duration with preceding and subsequent operations and investigate latency or performance bottlenecks across the request flow.
Spans
The Spans tab lists the spans associated with the selected LLM interaction along with details such as the span or operation name, model, and duration. Use it to inspect individual operations within the trace.
Raw
The Raw tab displays the raw telemetry data captured for the selected LLM interaction and exported by the respective SDK, including available trace, token, model, vendor, event, and related request attributes.
Use these views to move from aggregated LLM metrics to individual requests when investigating high latency, increased token consumption, unexpected costs, errors, or specific model responses.
Note: Prompt content is displayed only when the corresponding content is available for the captured request. Otherwise, No content available is displayed.
Logs
The Logs tab provides access to the log information associated with LLM activity.
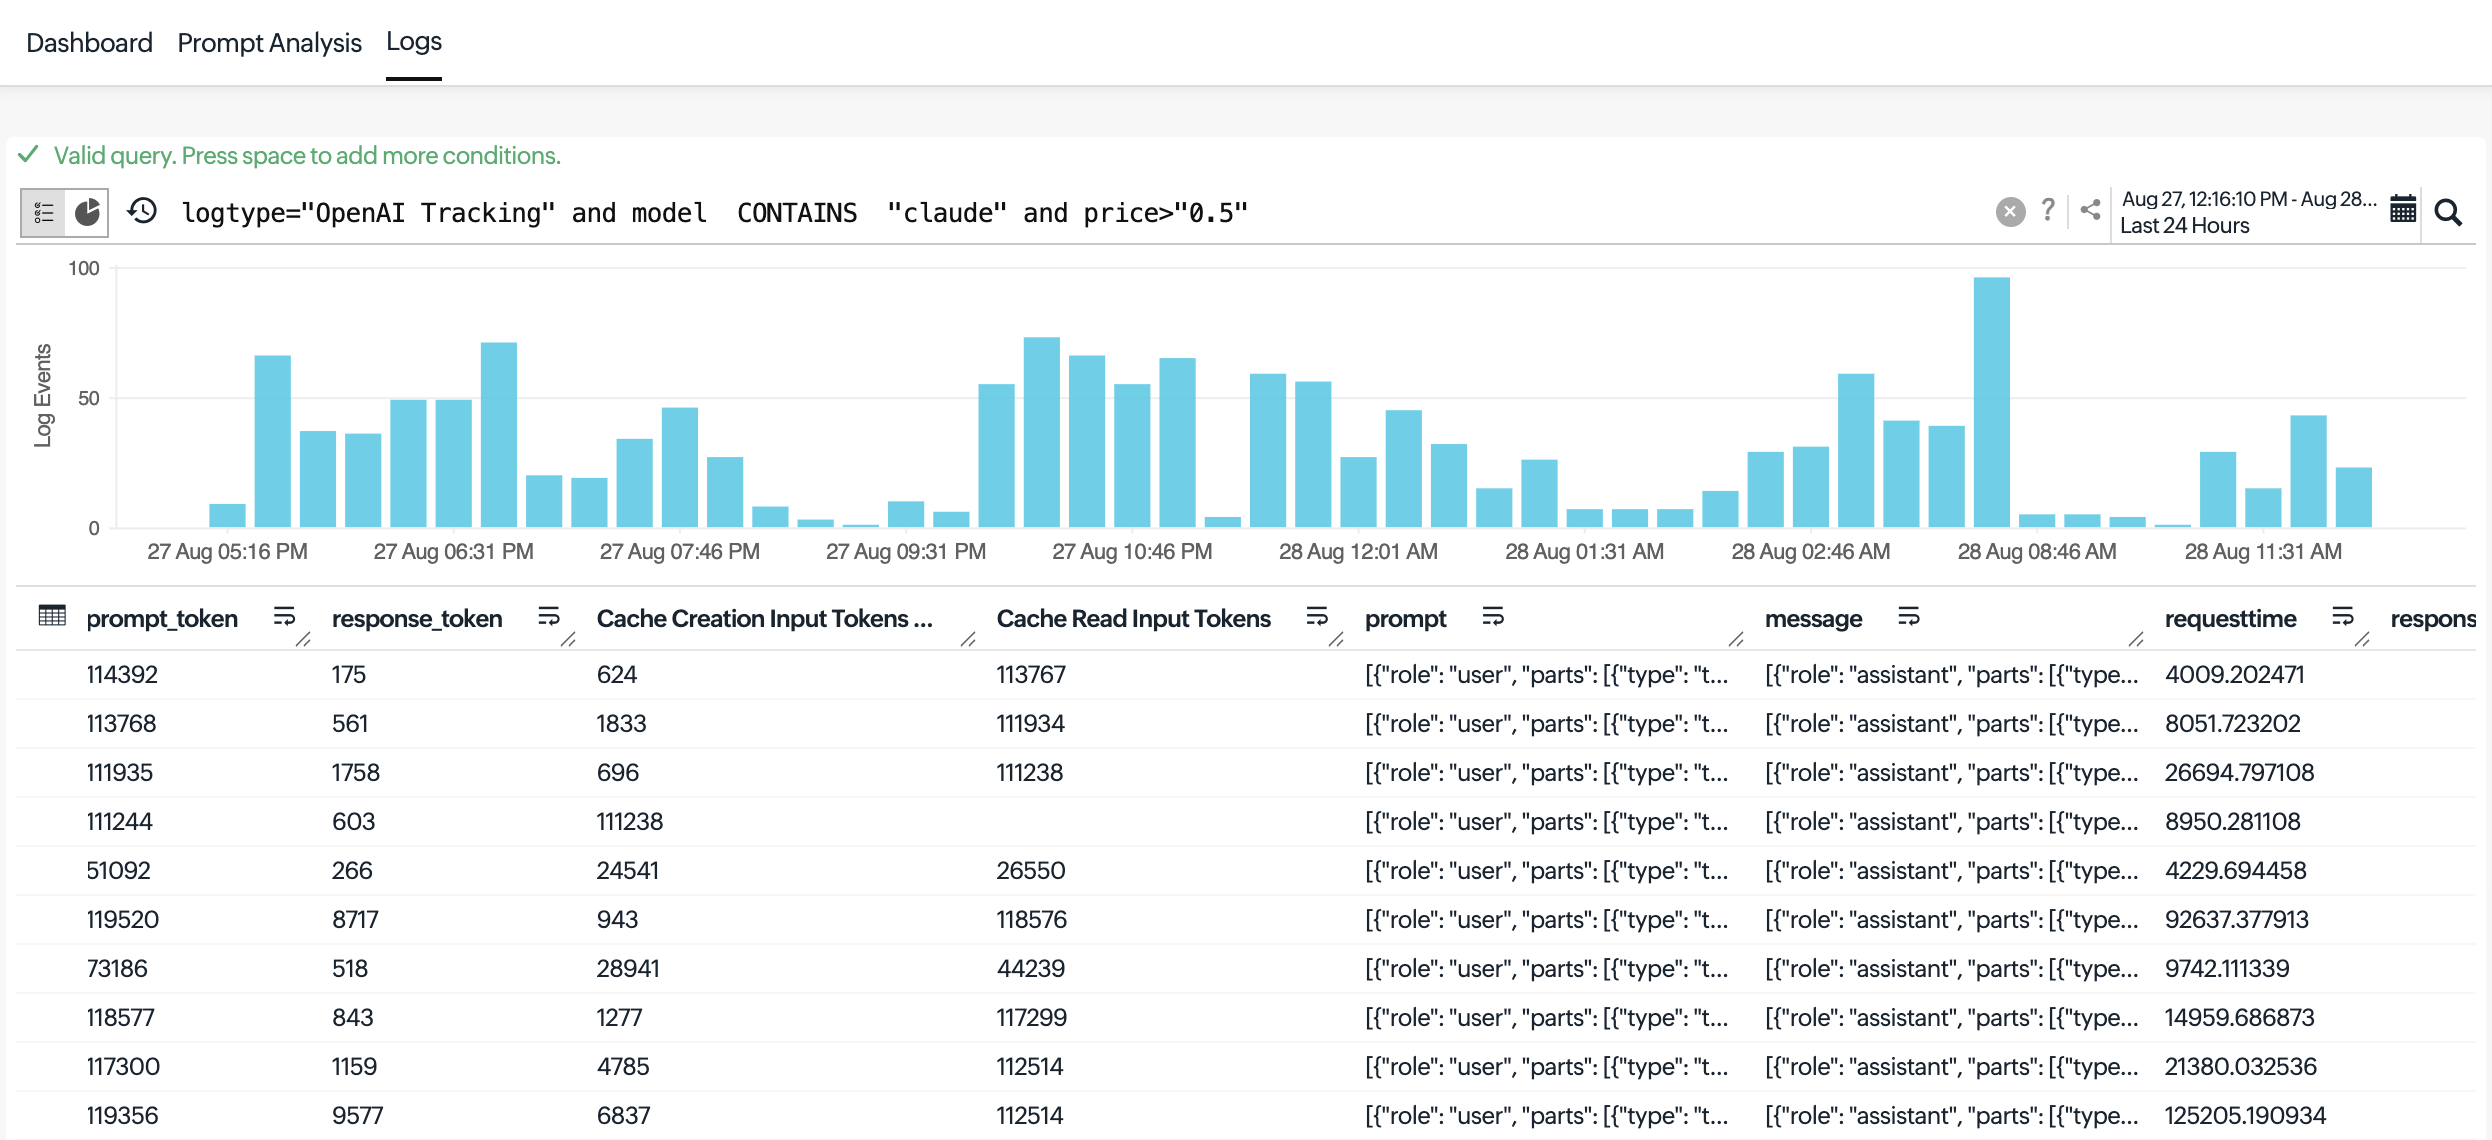
Use the log search interface to query the available LLM-related logs for a selected time range. This provides an additional troubleshooting view when investigating LLM requests and related errors.
You can modify the query and time range to narrow the log data you want to investigate.
Using LLM Observability for troubleshooting
The different views in LLM Observability can be used together to investigate LLM-related issues.
For example, when you notice increased latency:
- Check Avg Latency to determine whether overall request latency has increased.
- Review Response Time by Model to identify the affected model.
- Check Latency Percentiles to determine whether the increase affects typical requests or only slower requests.
- Compare the models in Model Performance Comparison.
- Use the Prompt Analysis tab to investigate individual interactions.
- Review the Logs tab for additional information related to the affected requests.
Similarly, when investigating increased LLM costs, review Derived Total Cost and Avg Cost / Request, identify the contributing model from Cost by Model, and correlate it with Input Token Usage by Model, Output Token Usage by Model, and Tokens Per Call by Model.
By correlating these metrics, Site24x7 LLM Observability helps you understand LLM performance and utilization from an overall model level down to individual interactions.