Performance report of Java agent
This performance report evaluates the impact of APM Insight Java agent on a Java 11-based E-commerce store, highlighting memory consumption, CPU usage, response time overhead, and network bandwidth consumption.
Test configuration
- The test application is an e-commerce store built on the Spring framework.
- It runs on Java 11 and is connected to a MySQL database.
- The test was run for an hour, with the application set to receive 2,000 HTTP requests per minute.
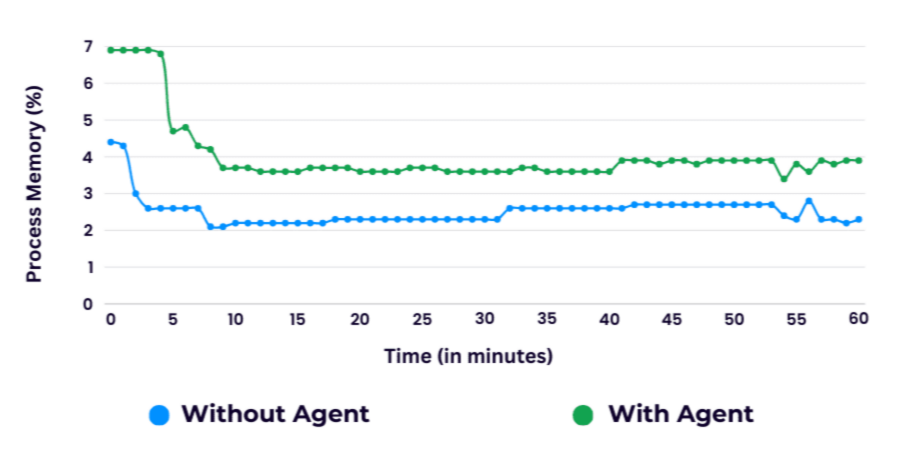
Memory consumption
- The APM Insight Java agent consumes 100 MB to 800 MB of memory to track all transactions served by the application server.
- The worst-case consumption of around 800 MB may occur when the agent is running on the server with the maximum capturing limits for transactions, traces, exceptions, and so on.
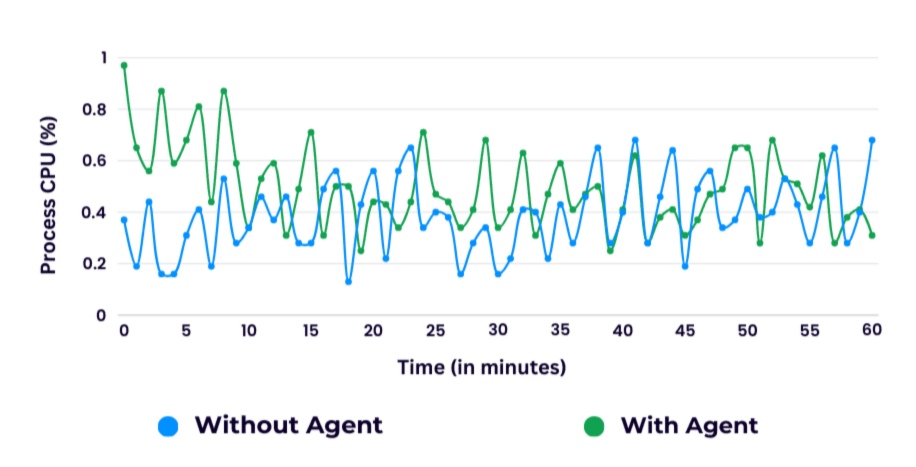
CPU consumption
The APM Insight Java agent results in a maximum of 2% more CPU consumption for the Java application (process) than the same process when run without it.
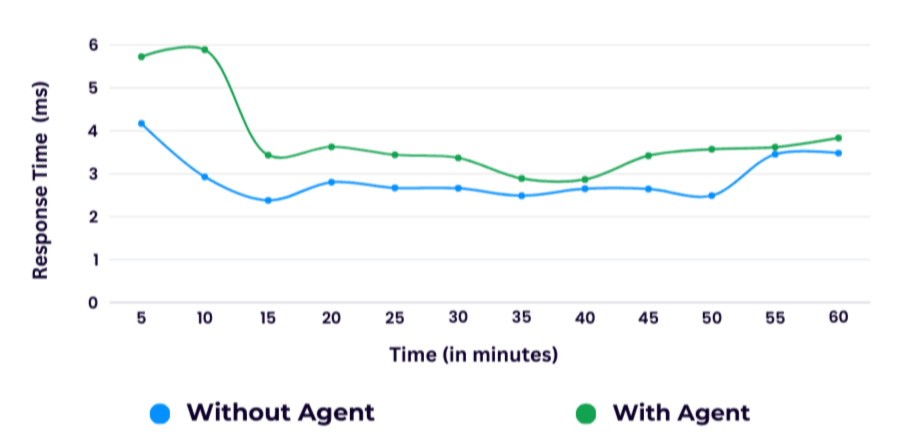
Response time overhead
- If the APM Insight Java Agent is configured to track all method calls according to the agent's default instrumentation, the response time overhead is 3.5% - 3.7% of the actual response time.
- The overhead in response time is directly proportional to the number of method calls that are instrumented. If many classes/methods are configured to be instrumented with custom instrumentation, the overload is expected to increase.
Network bandwidth consumption
- There is only one-way HTTPS communication between the APM Insight Java agent and the Site24x7 server at a frequency of one minute.
- The agent consumes a bandwidth of five MB per hour at the maximum.