Export Flows
Export your network traffic (NetFlows) to Site24x7 to monitor the traffic flows and bandwidth performance in real time. Choose an On-Premise Poller, execute the export commands, choose your devices and interfaces, and get started easily.
Prerequisites
- NetFlow analyzing using Site24x7 requires an On-Premise Poller (version 4.6.0) to be installed in the network being monitored. Add an On-Premise Poller.
- The device should be able to export flows to Site24x7.
Adding a device to monitor NetFlow
You can set up devices to export flows for network traffic analysis by following the six steps below:
- Choose an On-Premise Poller
- Configure the devices to export flows
- Choose a credential
- Choose devices
- Organize your monitors and configure profiles
- Verify your entries and export flows for monitoring
Step 1: Choose an On-Premise Poller
- Log in to your Site24x7 account.
- Go to Admin > Inventory > Add Monitor.
- On the Add Monitor page, click Flow Export under NetFlow. This will take you to the Flow Export page.
- The first step is to select an On-Premise Poller (Fig. 1). On the On-Premise Poller tab, you can select an On-Premise Poller from the list or install a new one. Click Next.
NoteThe Network Module should be enabled for the On-Premise Poller that you choose. If it is not, enable it.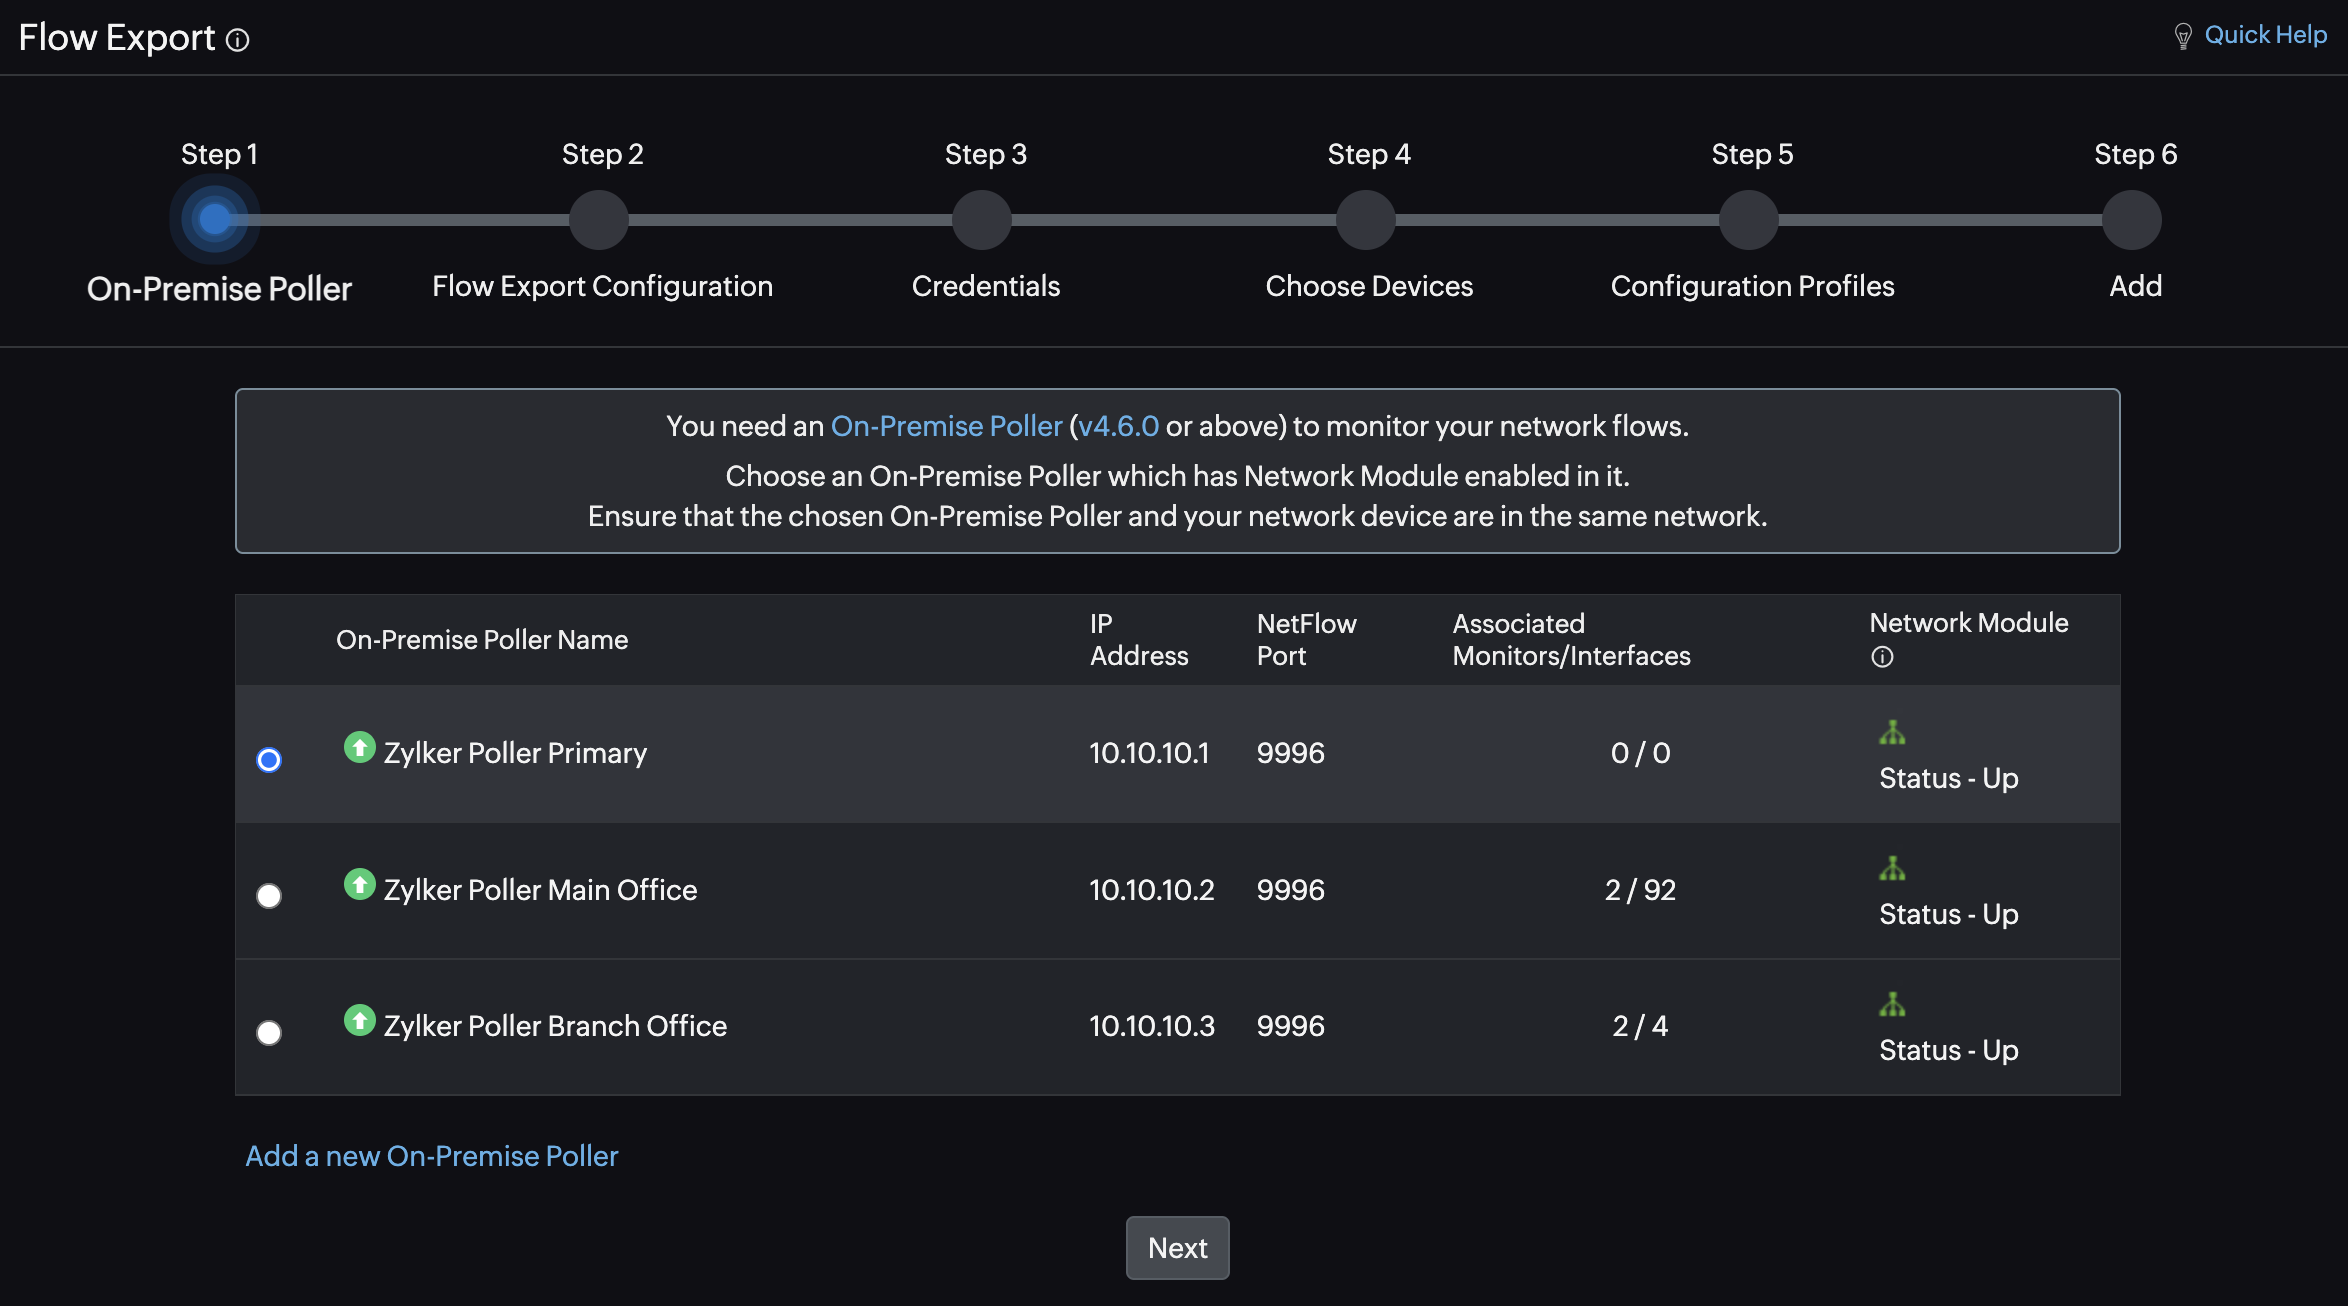
Figure 1. Step 1: Choose an On-Premise Poller.
Step 2: Configure the devices to export flows
You have to configure your devices to export flows to the Site24x7 On-Premise Poller. If you have already configured this, you can skip this step and move to Step 3.
If you have not yet configured flow exporting for your devices, then you can configure it via any of the following ways:
- Option 1: If your device supports configuration through the graphical user interface (GUI) console, you can configure it from there. This doesn't require any command executions, and you do not need to do anything in the Site24x7 client for this. Configure flow exporting through the GUI and move to Step 3.
- Option 2: If your device doesn't support configuration through the GUI, you can choose automatic configuration in Site24x7. Provide your SSH/Telnet and SNMP credentials, which Site24x7 will use to configure flow exporting securely and automatically for you.
- Option 3: You can also choose to do everything manually in Site24x7 by copying and executing the given commands.
In Site24x7, you can toggle to choose either automatic or manual configuration (Fig. 2).
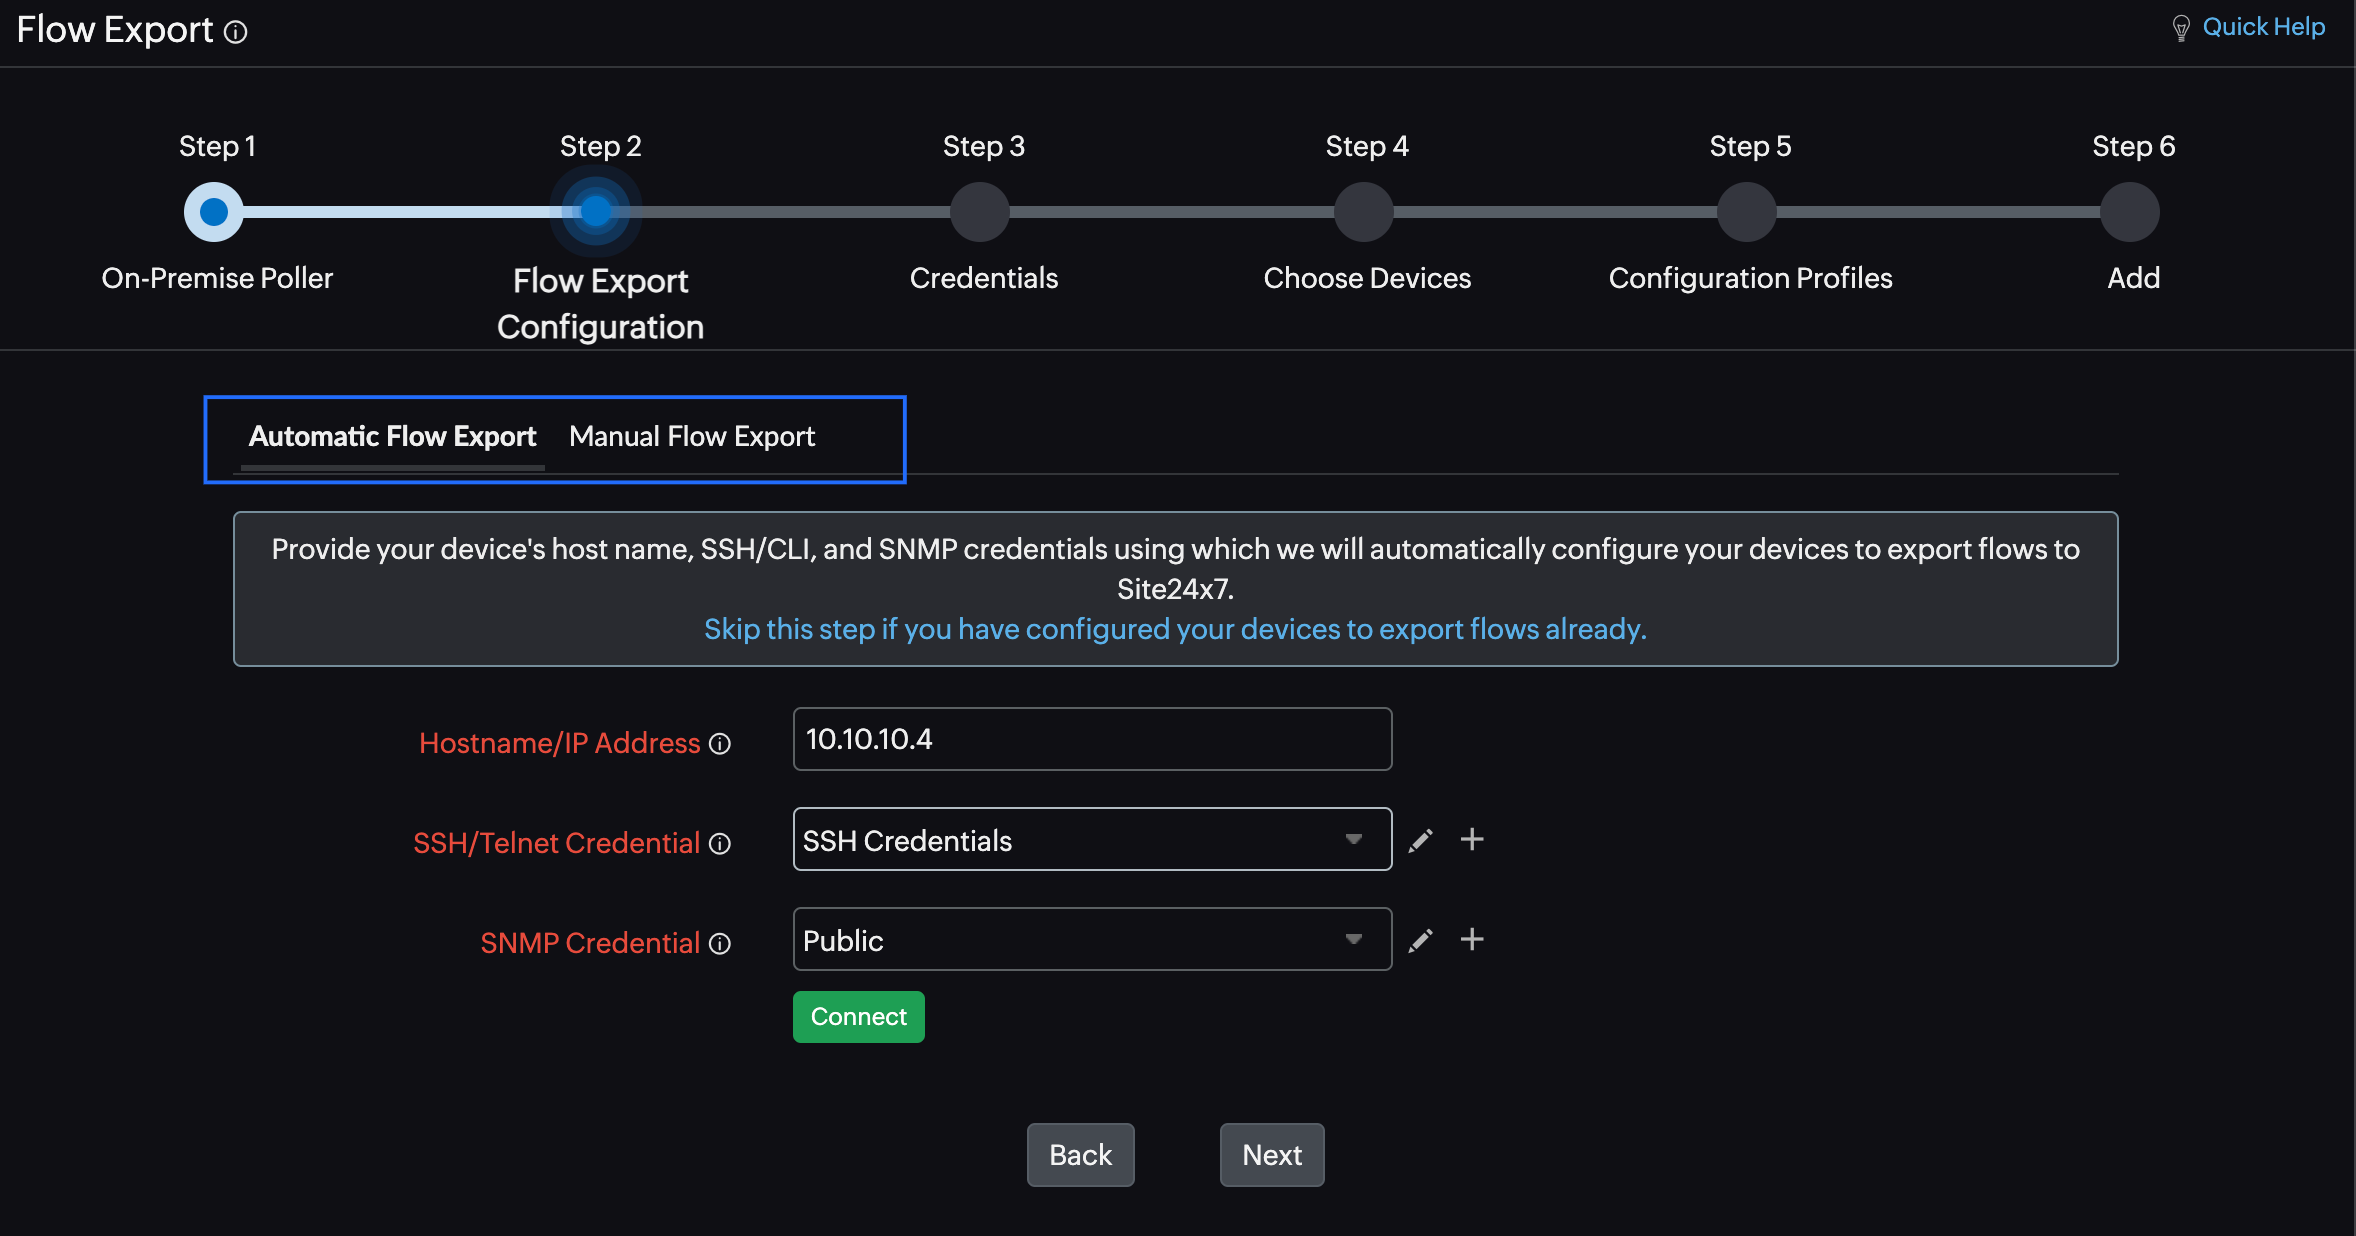
Figure 2. Step 2: Configure the devices to export flows.
Automatic Flow Export Configuration
Provide the following details to configure your devices to export flows to Site24x7 automatically.
- For Hostname/IP Address, enter the hostname or IP address of the device you want to analyze the flows of.
- For SSH/Telnet Credential, choose the appropriate SSH or Telnet credentials that can automatically fetch flow export data. Edit the existing credentials by clicking the pencil
 icon, or add a new credential by clicking plus + icon.
 - For SNMP Credential, select the SNMP credential that can be used to fetch the device details (including the Type and Model for identifying the right set of commands) and the interface details (like the Interface Name, In Speed (bps), and Out Speed (bps)). Edit the existing credentials by clicking the pencil icon, or add a new credential by clicking plus + icon.
- Click Connect for Site24x7 to connect and verify the credentials. You can view the Test Credentials Result on the screen. If any of the tests failed, troubleshoot and fix them based on the insights provided.
- Once Site24x7 has successfully connected, follow the steps below (Fig. 3).
- For Source Interface, select the source interface needed to export flows.
- For Flow Export Interfaces, select the interfaces for which you would like to monitor the flows.
- For Device Vendor/Type, select the device vendor or the device type for the device that's exporting flows.
- For Command Set, select a suitable predefined set of commands for the chosen device or vendor type.
- For Export Commands, check the attributes in the commands and click Execute Commands.
- Wait for the execution result. You can check if the flow export configuration was successful from here. If the configuration failed, retry by executing a different Command Set.
- If the result is a success, click Next.
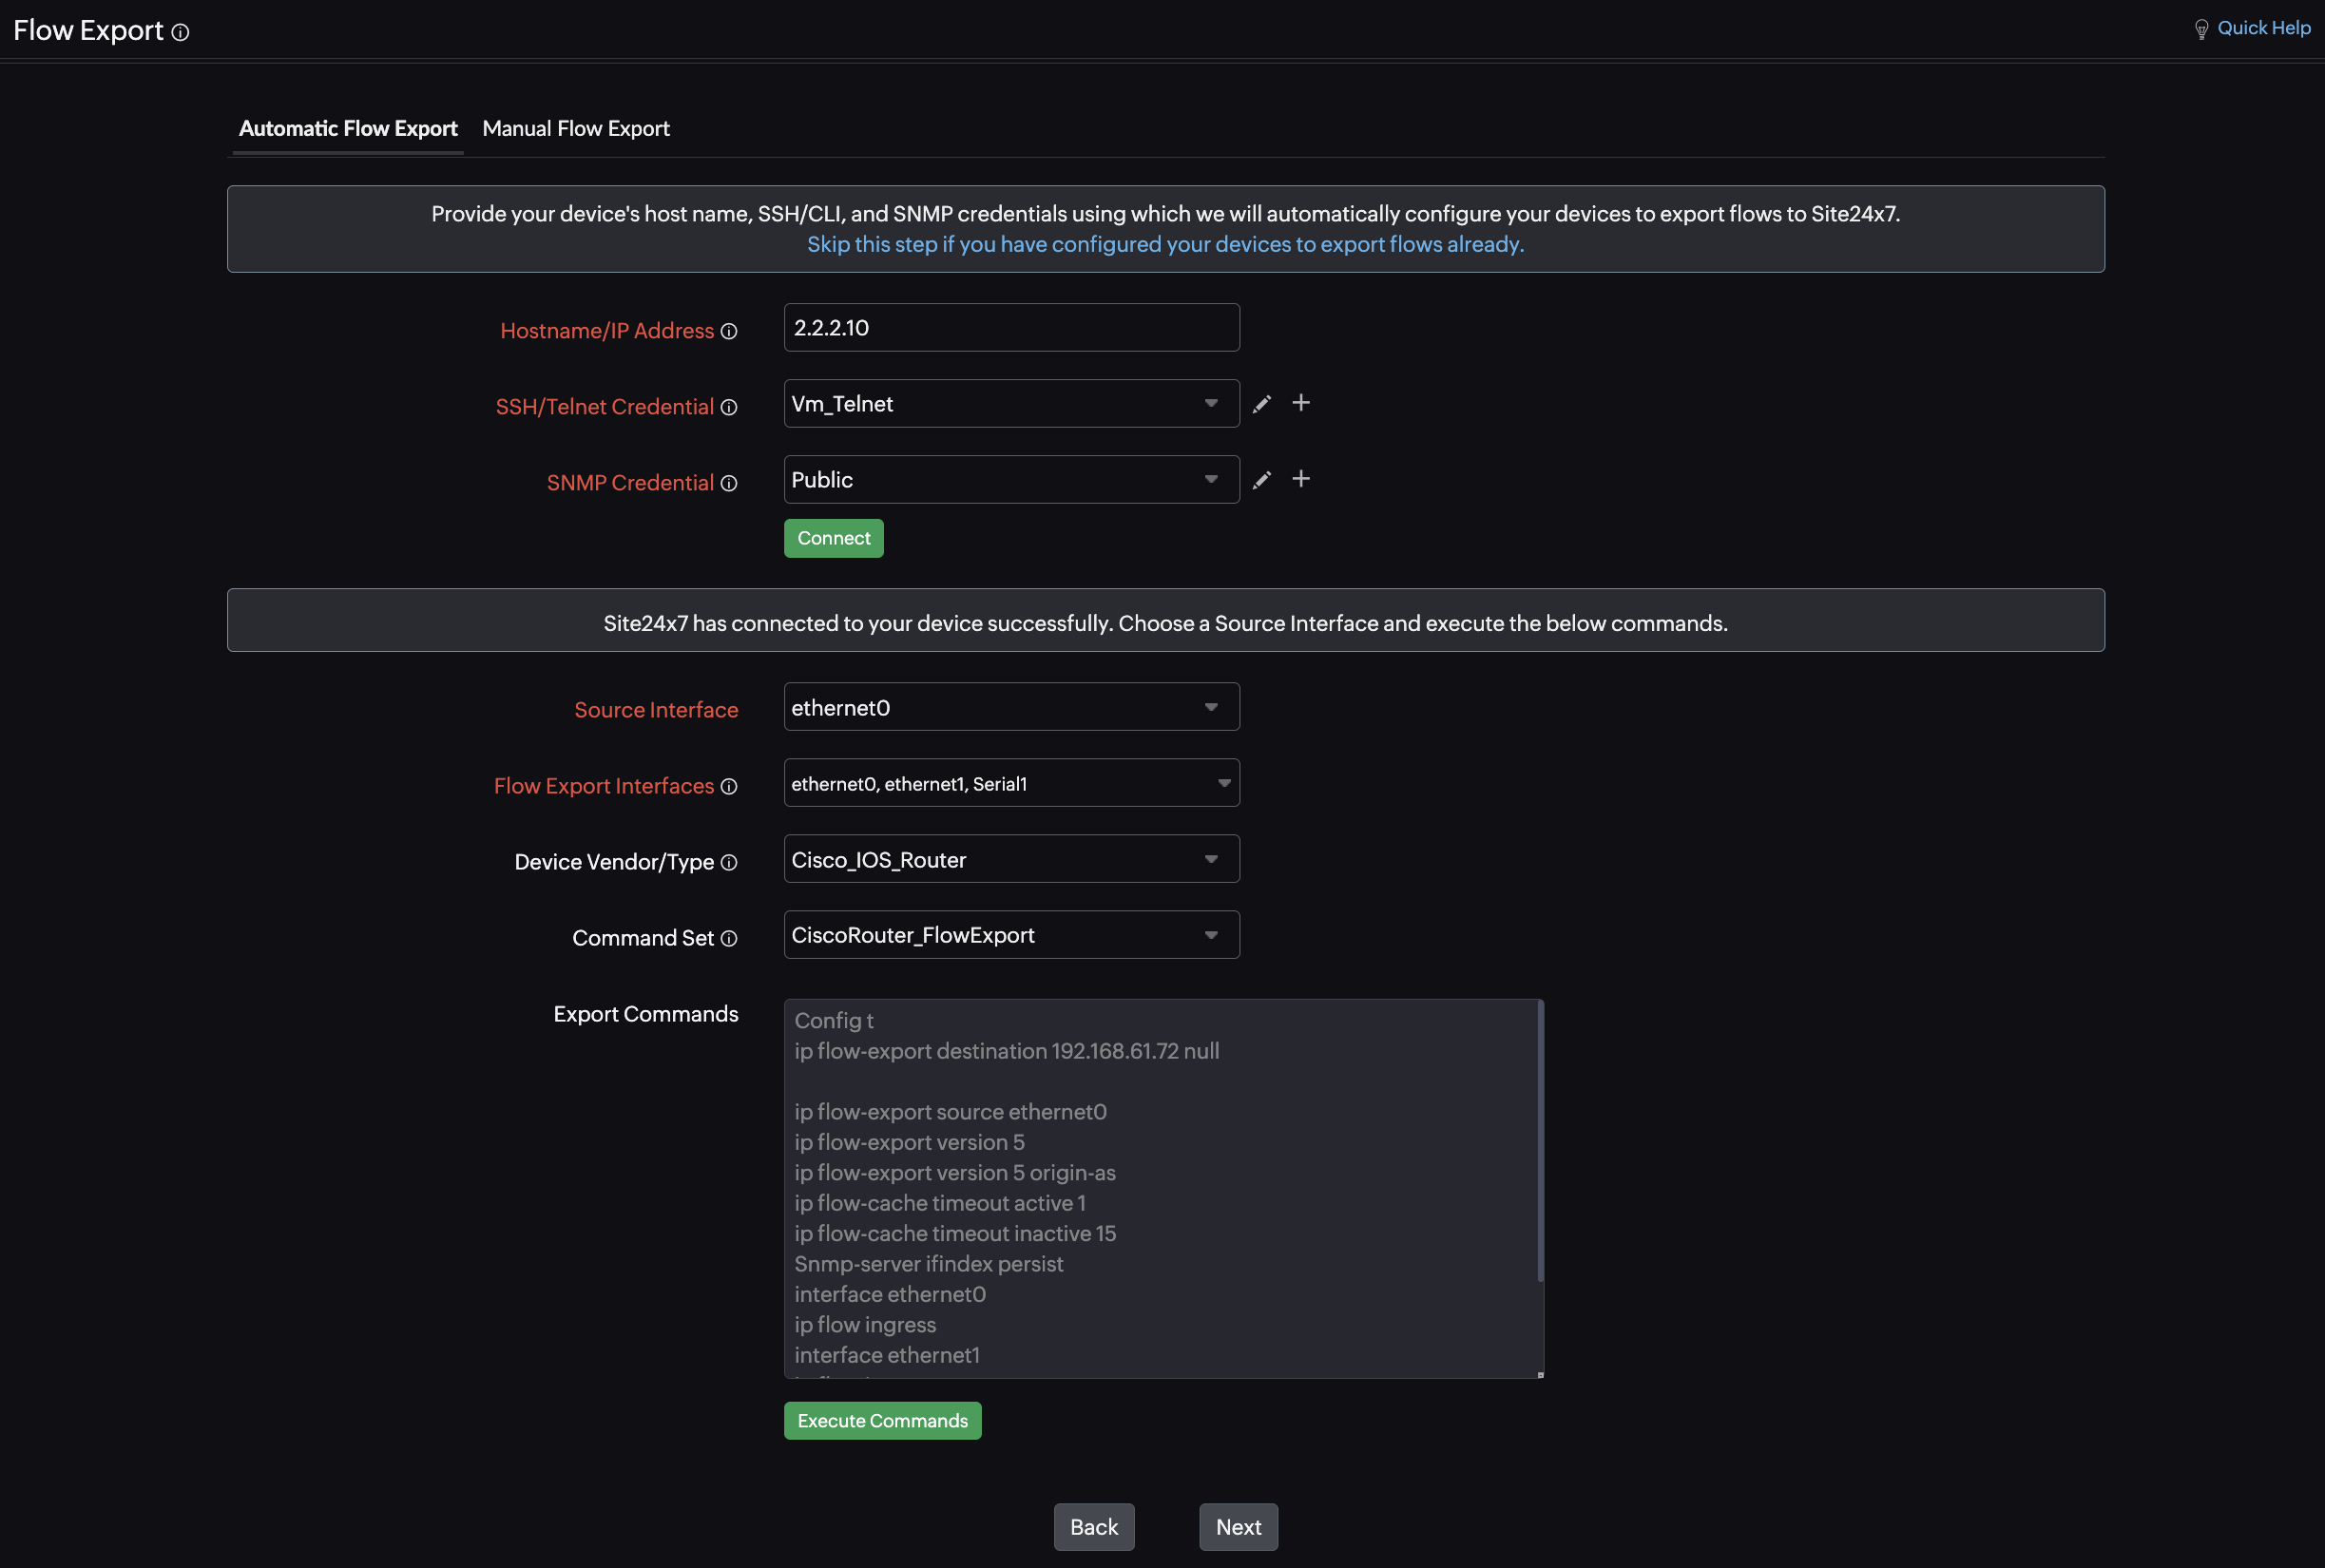
Figure 3. Automatic flow export configuration.
Manual Flow Export Configuration
Select the device details to display a set of commands. You can manually copy and paste the commands on your device to export flows to Site24x7.
- For Device Vendor/Type, select the device vendor or the device type for the device that's exporting flows (Fig. 4).
- For Command Set, select a suitable predefined set of commands for the chosen device or vendor type.
- For Description, view a description to define the chosen command set.
- For the given Export Commands, replace the necessary attributes, like the interface name and source interface name, and click Copy to Clipboard. Execute these commands on your device to configure it to export flows to Site24x7.
- Click Next.
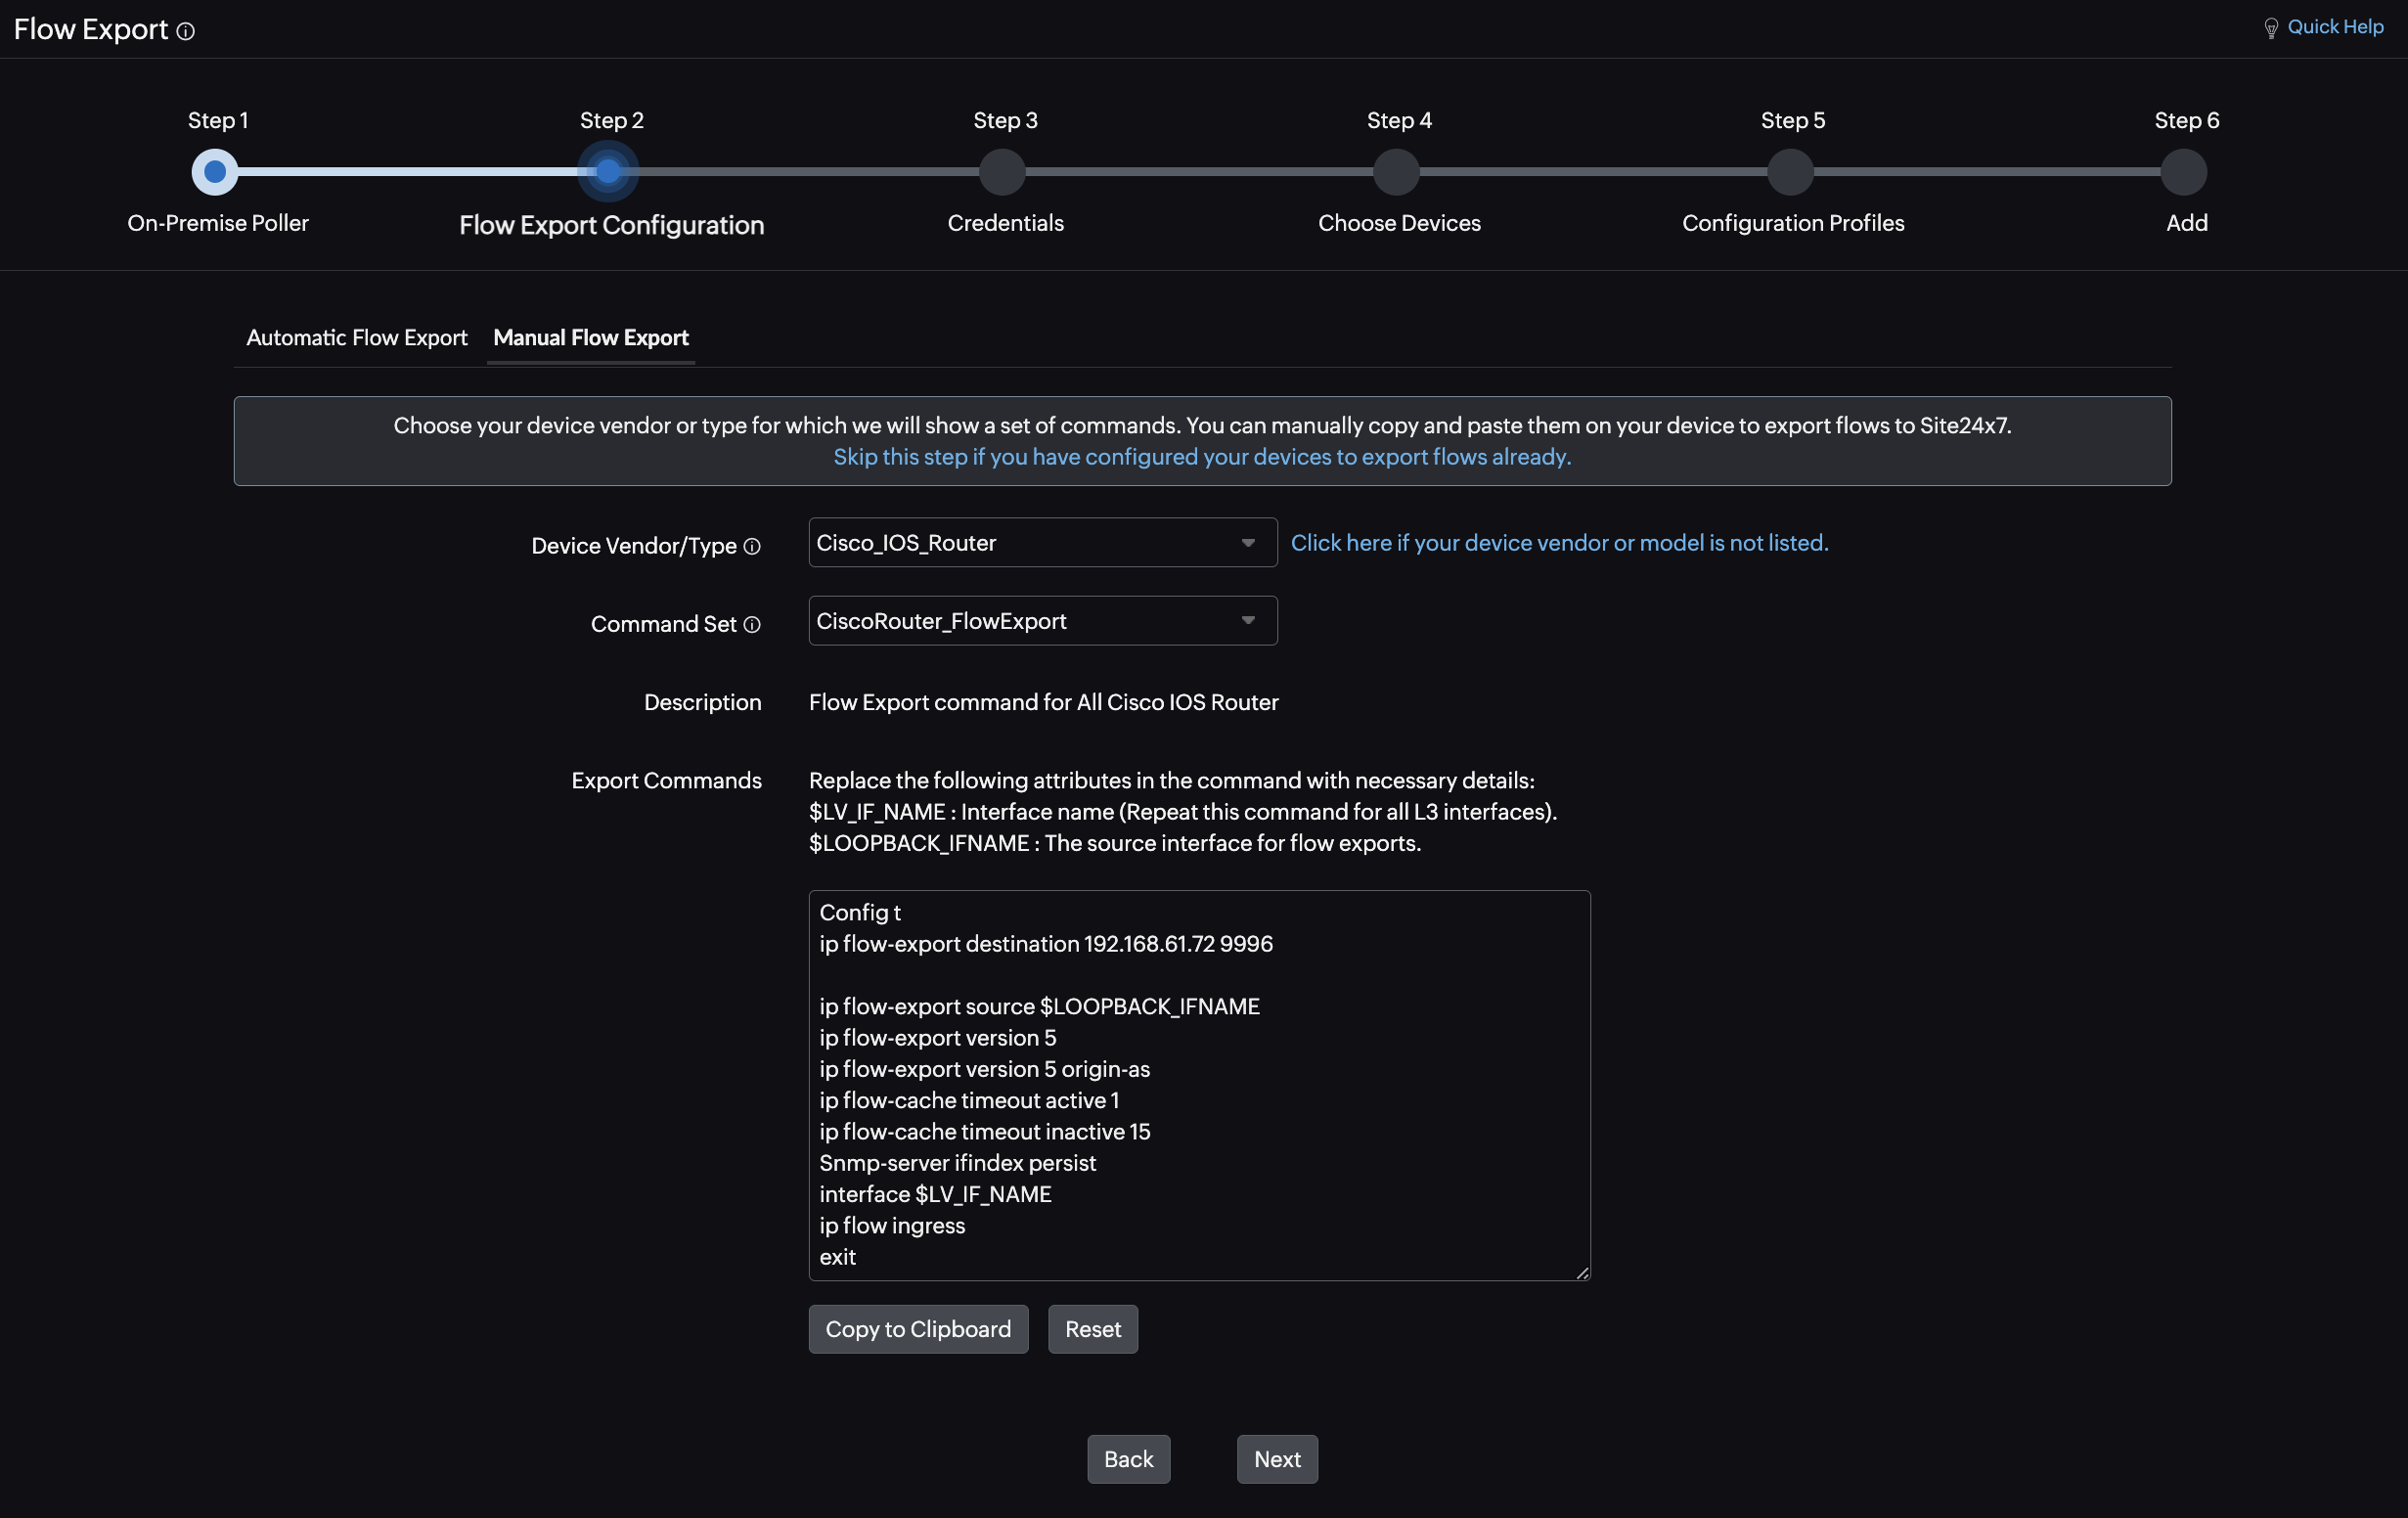
Figure 4. Manual flow export configuration.
Step 3: Choose a credential
Credentials help Site24x7 use SNMP to pull details like interface names from the devices.
- Select a credential applicable for most of the devices to fetch their interface names.
- You can also add new ones by clicking Add a new SNMP Credential (Fig. 5).
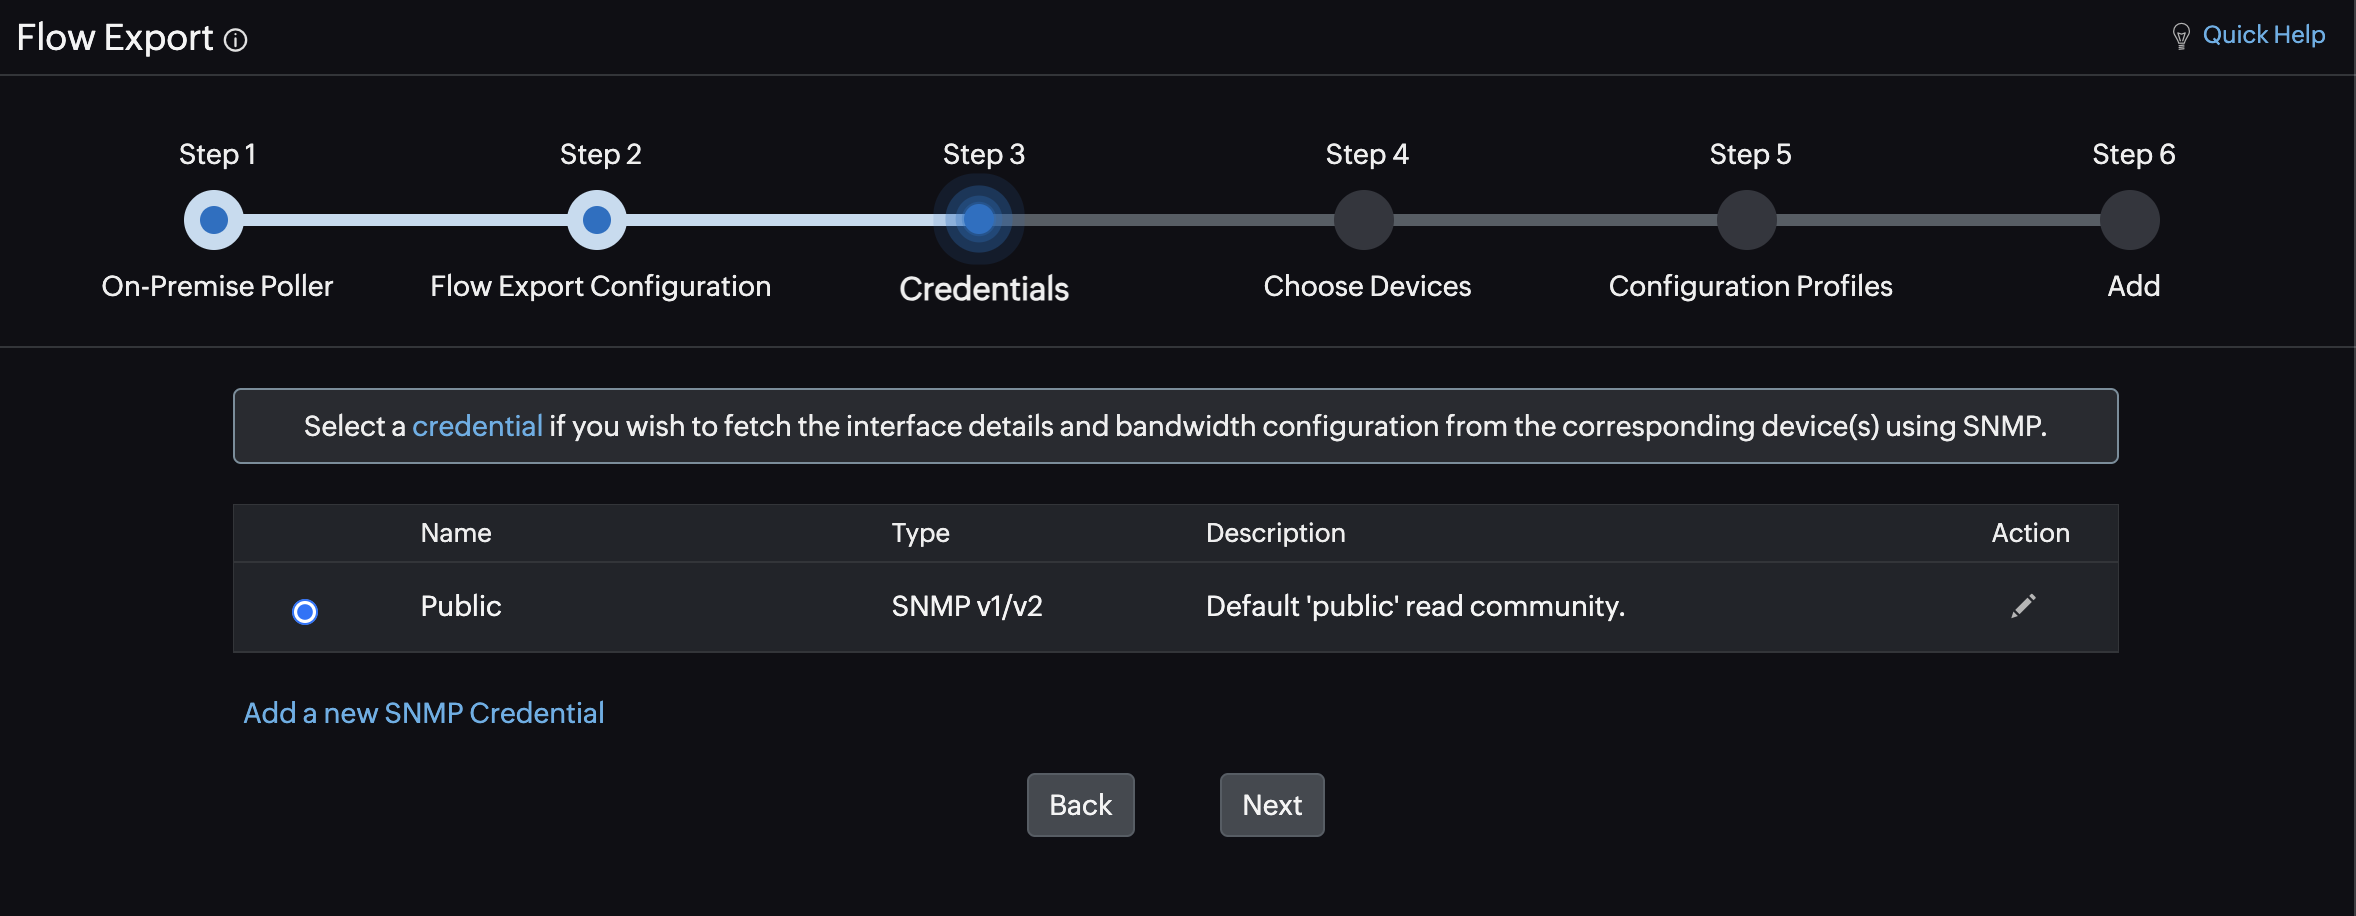
Figure 5. Step 3: Choose a credential.
Step 4: Choosing devices
Once you execute the commands on your devices, the devices will start exporting flows to the Site24x7 On-Premise Poller, which can cause a delay in Site24x7 fetching the list of devices. Wait for a few minutes. If Site24x7 can fetch the interface name using the credential chosen in Step 3, the credential will be listed under the Credential column. Otherwise, the credential value will be listed as None Associated. You can click the pencil ![]() icon beside the credential of each interface to select a different one.
icon beside the credential of each interface to select a different one.

Click the pencil ![]() icon beside the Interface Name, In Speed (bps), and Out Speed (bps) to edit the values. You can also select individual interfaces on a device and fetch the flow data by selecting the appropriate check boxes beside the interfaces and clicking the Fetch button (Fig. 6).
icon beside the Interface Name, In Speed (bps), and Out Speed (bps) to edit the values. You can also select individual interfaces on a device and fetch the flow data by selecting the appropriate check boxes beside the interfaces and clicking the Fetch button (Fig. 6).
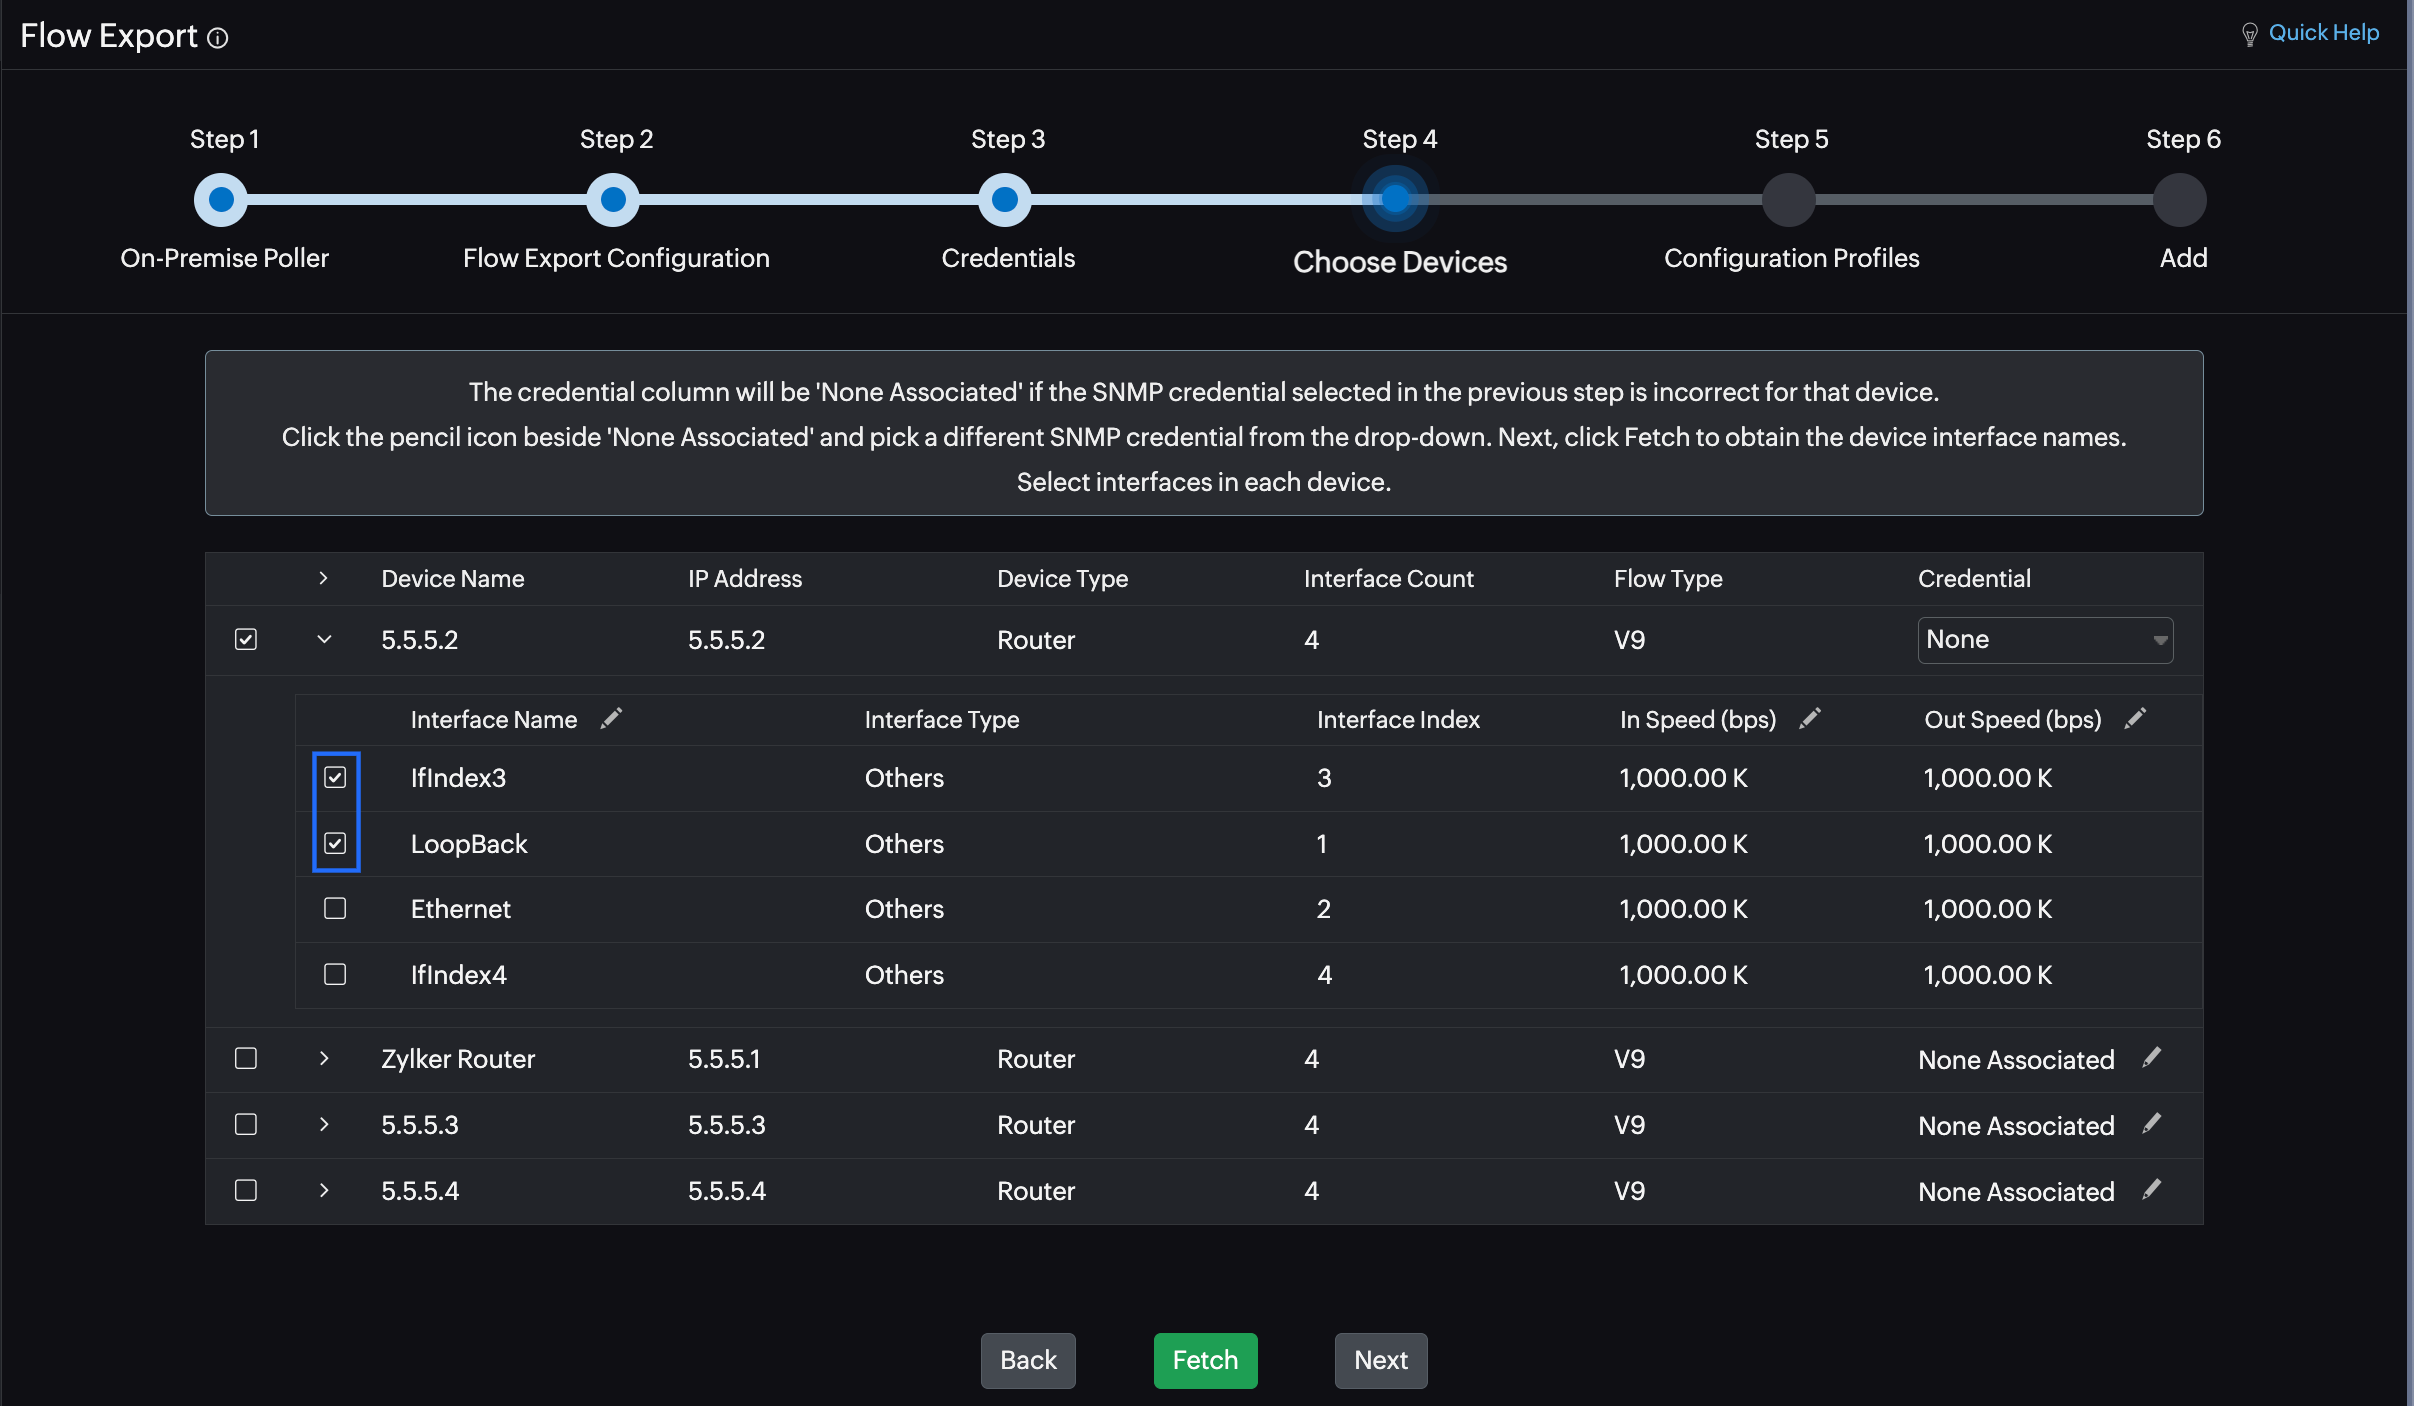
Figure 6. Step 4: Choose devices.
No flows received
If you see the message No flows received, it means that the On-Premise Poller didn't receive any flows. Click Back and check if you configured your devices to export flows properly, or click Resync. If you still don't receive any flows, troubleshoot to verify the configuration.
Once the flows are received, the list of all the devices exporting flows to Site24x7 will be displayed. You can view details like the Device Name, IP Address, Device Type, Interface Count, Flow Type, and Credential for every device. You can also view the Interface Name, Interface Type, Interface Index, In Speed (bps), and Out Speed (bps) for every interface on each device.
- Select the desired devices and interfaces.
- Click Next.
Step 5: Organize your monitors and configure profiles
Configure profiles and organize your monitor for ease of use.
- Under Monitor Groups and Dependency (Fig. 7), configure the following:
- Associate with Monitor Group(s): Associate the NetFlow monitor with a Monitor Group. Select an existing Monitor Group or create a new one by clicking the plus + icon beside the field.
- Dependent on Monitor: Select a dependent monitor of your choice from the drop-down list. Site24x7 will suppress alerts for the configured NetFlow monitor if the dependent monitor is already down. You can add up to five monitors as dependents.
- Under Configuration Profiles, configure the following:
- Threshold and Availability: Select a Threshold Profile from the drop-down list, use the default one available, or create a new one to get notified when the resources cross the configured threshold and availability.
- Tags: Associate your monitor with a predefined Tag or multiple Tags to help organize and manage your monitors creatively.
- IT Automation Templates: Select an IT Automation Template to be executed when there is a change in the state of the NetFlow monitor. The defined action will get executed when there is a state change, and the selected user groups will be alerted.
- Execute IT Automation during Scheduled Maintenance: Besides automating repetitive tasks with IT Automation tools, you can also schedule automations to take place one after the other when an incident occurs. Click the check box if you wish to execute this.
- Under Alert Settings, configure the following:
- User Alert Group: Select the user group that needs to be alerted during an outage, or add multiple users to a group.
- Notification Profile: The Notification Profile helps you configure who gets notified and when in the event of downtime. Choose a Notification Profile from the drop-down list, use the default one available, or create a custom one.
- Click Next.
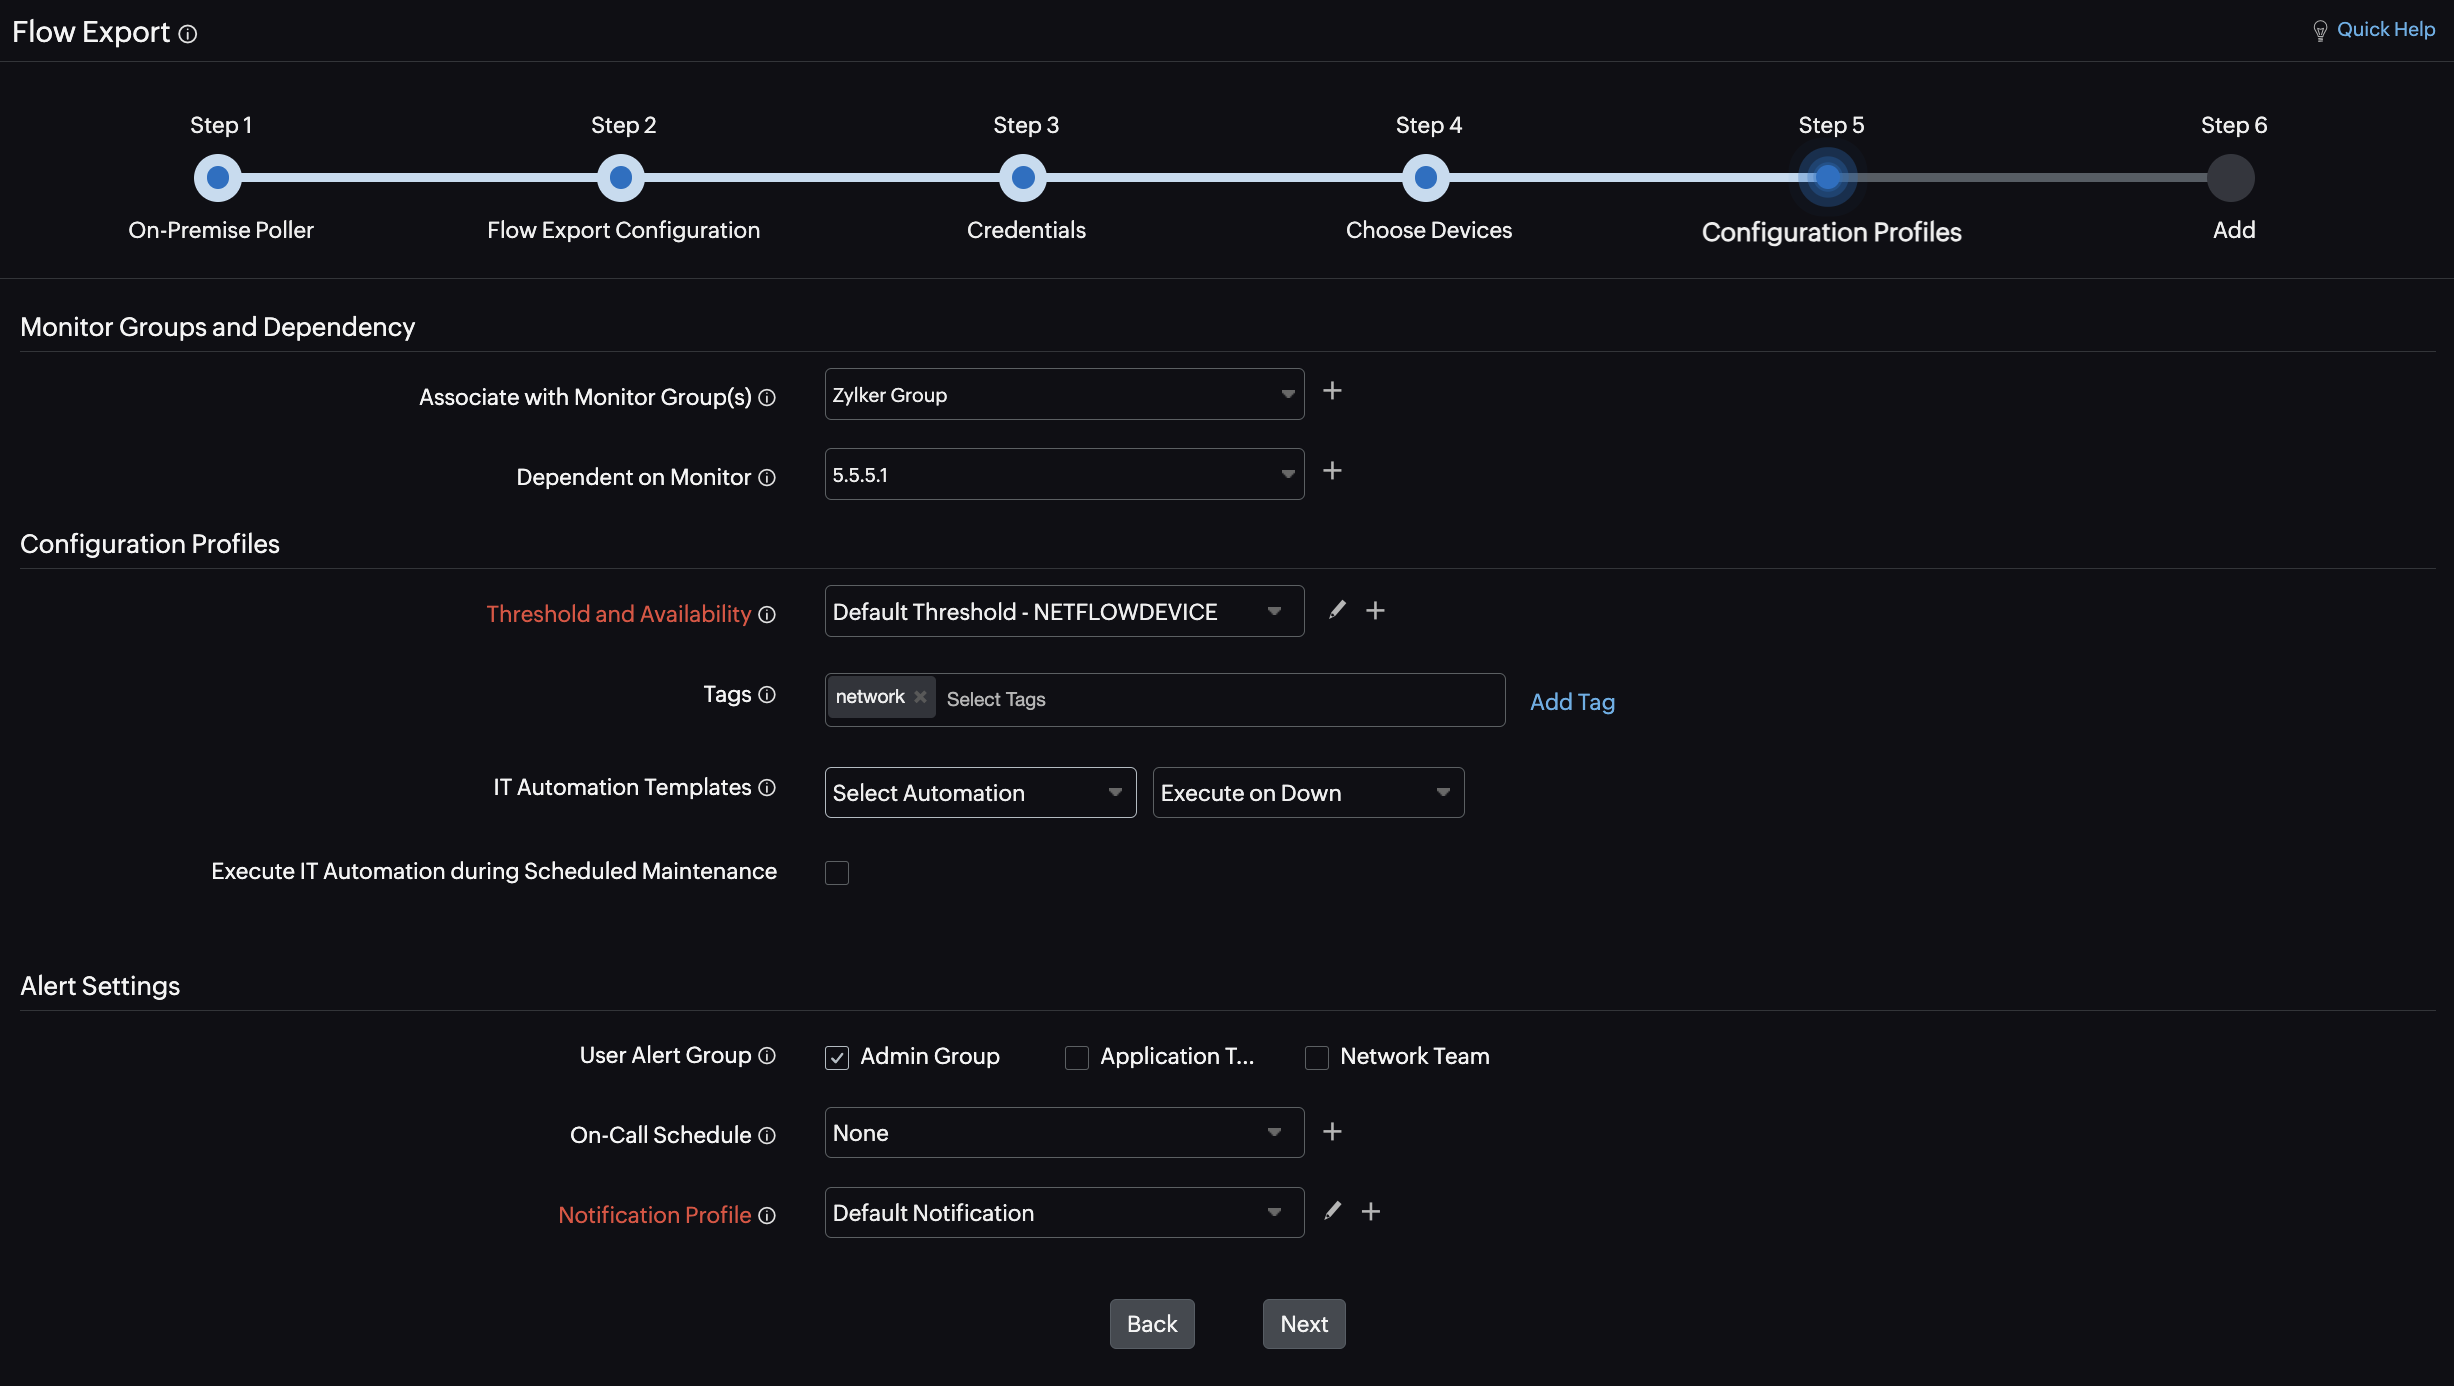
Figure 7. Step 5: Organize your monitors and configure profiles.
Step 6: Verify your entries and export flows for monitoring
- Verify the details on the Add tab.
- Click Add at the bottom of the page (Fig. 8).
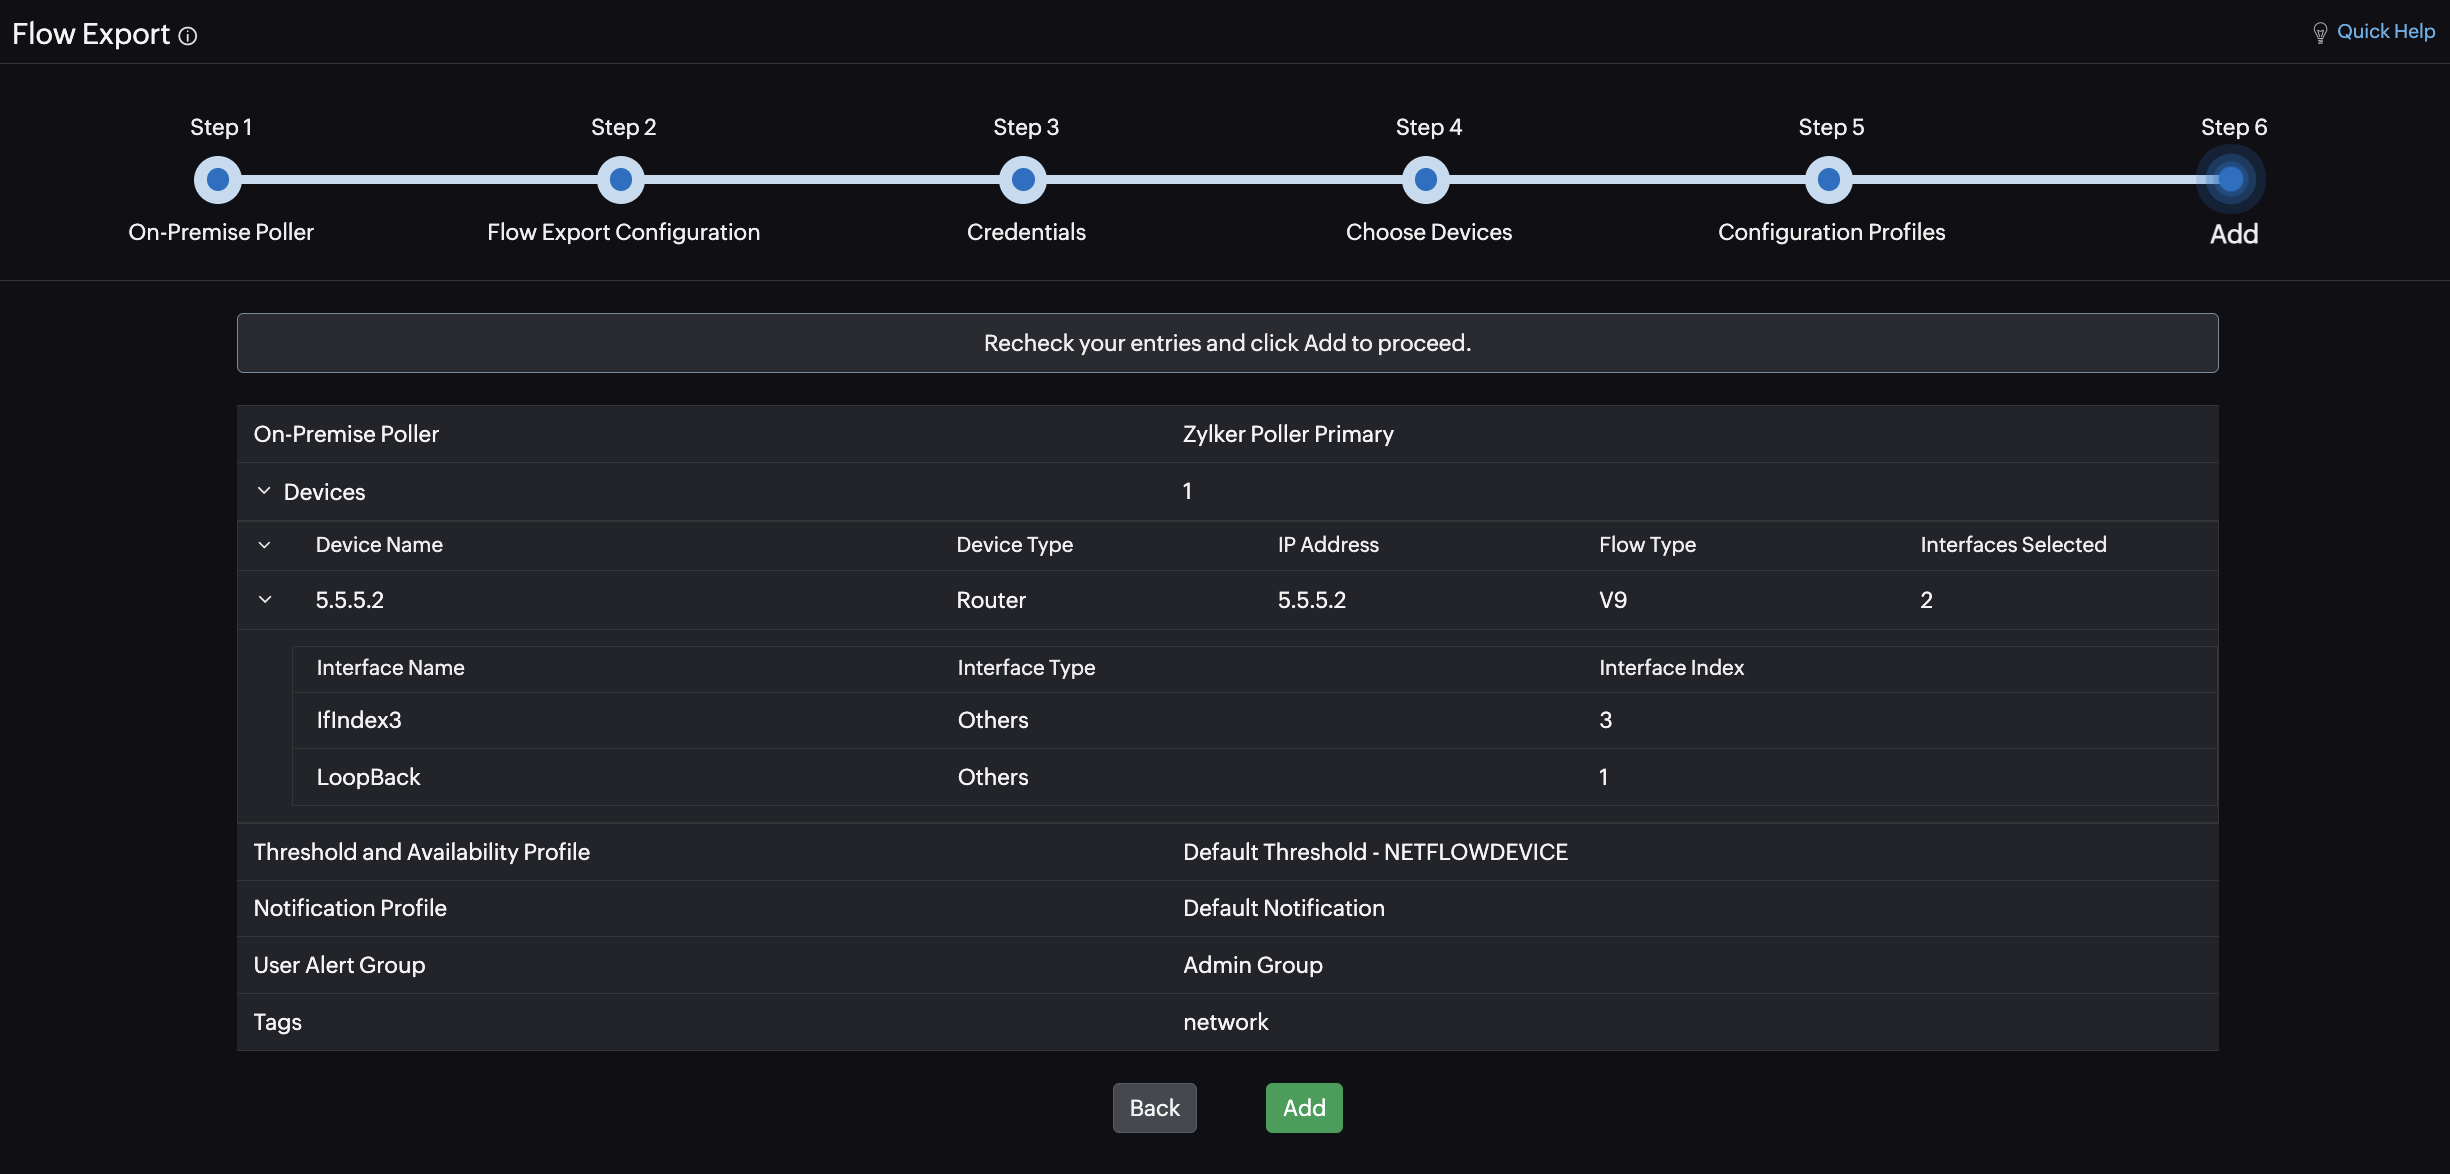
Figure 8. Step 6: Verify your entries and export flows for monitoring.
Related Articles
-
On this page
- Prerequisites
- Adding a device to monitor NetFlow