Help Performance Metrics VMware Monitor
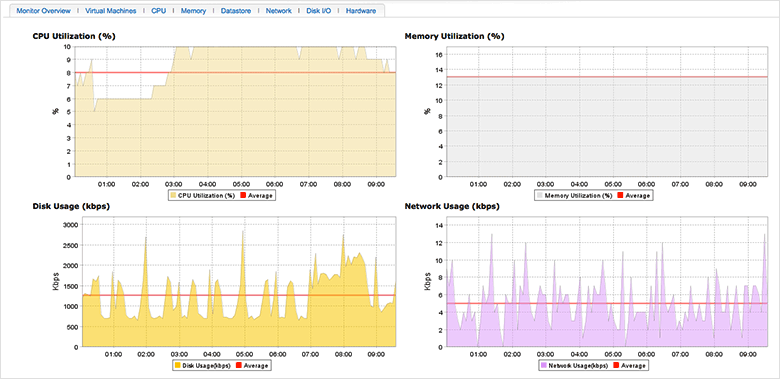
The VMware ESX/ESXi servers are monitored based on the parameters or the attributes listed below. These attributes provide detailed information about the functioning of the monitors of VMware ESX/ESXi server. Thresholds can be configured based on these monitoring data.
| Metrics | Description |
| CPU Utilization | The total CPU utilization across the system along with the average value in percentage. |
| Memory Utilization | The total memory utilized across the system along with the average value in percentage. |
| Disk Usage | Disk usage of ESX/ESXi server along with the average value in kilobytes per second |
| Network Usage | Network usage of ESX/ESXi server along with the average value in (kilobytes per second) |
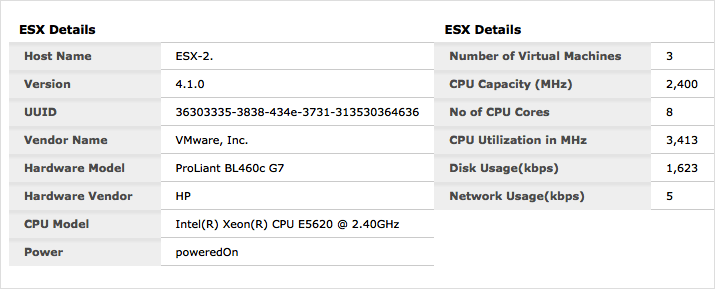
| ESX Details | |
| Host Name | Name of the ESX/ESXi server host |
| Version | Version of the ESX/ESXi server |
| UUID | The Universally Unique Identifier number for your distributed server |
| Vendor Name | Name of the server vendor |
| Hardware Model | Model name of the machine where the virtual server is installed. |
|
Hardware Vendor |
Name of the vendor who provided the physical machine where the virtual server is installed |
| CPU Model | Overall specification of the CPU |
| Power | Server power status (PoweredOn or PoweredOff) |
| Number of Virtual Machines | Number of VMs discovered in the physical machine |
| CPU Capacity | The overall CPU capacity in Mega Hertz |
| No of CPU Cores | Number of CPU cores present in the server |
| CPU Utilization | The total CPU utilization across the system along with the average value in percentage |
| Disk Usage | Disk usage of ESX/ESXi server along with the average value in kilobytes per second |
| Network Usage | Network usage of ESX/ESXi server along with the average value in (kilobytes per second) |


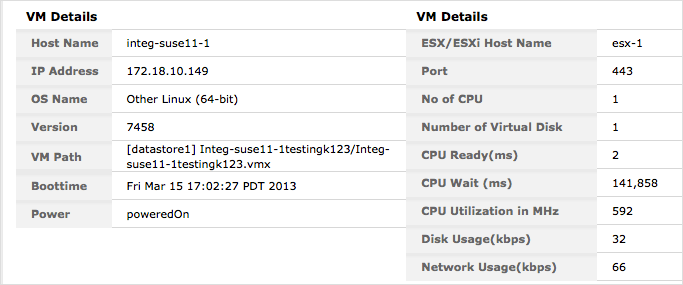
If you have added a separate VM, instead of the ESX Details table, VM Details table will be shown
| Metrics | Description |
| Host Name | Name of the VM server host |
| IP Address | IP address of the VM server host |
| OS Name | Name of the Operating System in the Virtual Machine |
| Version | Version of the OS in the Virtual Machine |
| VM Path | Path to the VM |
| Boottime | Time taken to boot the server |
| Power | |
| ESX/ESXi Host Name | Name of the parent ESX/ESXi server host |
| Port | Port number where the VM is running |
| No of CPU | Number of CPU cores present in the server |
| Number of Virtual Disk | Number of virtual disks available in the Virtual Machine |
| CPU Ready (ms) | Time a VM is waiting to be scheduled onto a physical (or HT) core by the CPU scheduler, in Milli Seconds |
| CPU Wait (ms) | Total CPU time spent in wait state in Milli Seconds |
| CPU Utilization in MHz | The total CPU utilization across the system along with the average value in percentage. |
| Disk Usage (kbps) | Disk usage of a virtual machine along with the average value in kilobytes per second |
| Network Usage (kbps) | Network usage of a virtual machine along with the average value in (kilobytes per second) |

Virtual Machines
This tab will show all the virtual machines discovered under each ESX/ESXi server. This view provides an overall idea of the availability, CPU Utilization(%) and Disk Utilization (%) of all the virtual machines.

CPU
This tab will show the metrics about CPU Utilization details of the cores.
| Metrics | Description |
| CPU Core Name | Names of the CPU Cores present in the machine |
| CPU Utilization | The total utilization of the CPU core over a period of time (in %) |
| CPU Idle time | The total time that each CPU core remains in an idle state (in Milli Seconds) |
Memory
| Metrics | Description |
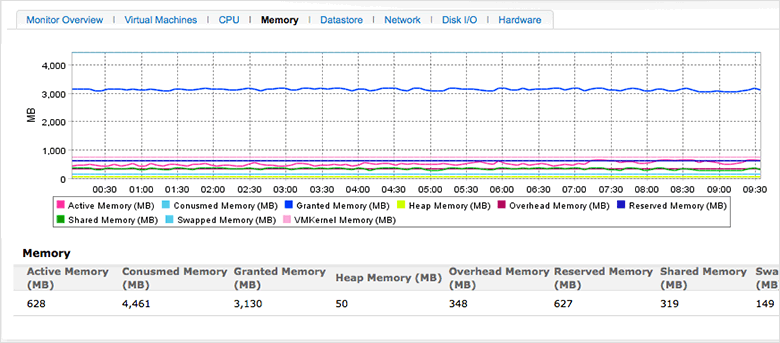
| Active Memory (MB) | Amount of memory that is actively used in Mega Bytes |
| Consumed Memory (MB) | Consumed memory is the value got by subtracting the total memory from free memory. Displayed in Mega Bytes |
| Granted Memory (MB) | The value of physical memory granted in Mega Bytes |
| Heap Memory (MB) | Amount of memory allocated for heap in Mega Bytes |
| Overhead Memory (MB) | Sum of overhead memory across all VMs displayed in Mega Bytes |
| Reserved Memory (MB) | Amount of memory currently utilized to satisfy minimum memory values set for all VMs in Mega Bytes |
| Shared Memory (MB) | Amount of memory shared between virtual machines in Mega Bytes |
| Swapped Memory (MB) | Amount of memory that is swapped in Mega Bytes |
| Memory Utilization (%) | The total utilization of memory over a period of time in percentage |
| VMKernal Memory (MB) | Amount of memory used by the VMKernel in percentage |

Datastore
This tab shows the metrics related to the data stores of the server.
| Metrics | Description |
| Name | Name of the datastore |
| Type | Type of datastore (example: VMFS or VMware File System) |
| Read Latency (ms) | The average time taken for a read from the datastore (ms) |
| Read Rate (kbps) | The rate at which data is read from the datastore (kbps) |
| Write Latency (ms) | The average time taken for a write to the datastore (ms) |
| Write Rate (kbps) | The rate at which data is written to the datastore (kbps) |
| Free (GB) | The free space of this datastore in Giga Bytes |
| Used (GB) | The used space of this datastore in Giga Bytes |

Network
| Metrics | Description |
| Name | Name of the network interface card (NIC) of the host |
| Data Received Rate (kbps) | The rate at which this NIC receives data(Kbps) |
| Data Transmit Rate (kbps) | The rate at which this NIC transfers data (Kbps) |
| Packets Received | Number of network packets received by this NIC |
| Packets Transmitted | Number of network packets transmitted by this NIC |
Disk I/O
This tab shows the disk Input/Output stats of the ESX/ESXi server.

| Metrics | Description |
| LUN | LUN denotes the Logical Unit Number associated with the physical disk |
| Bus Reset | The number of SCSI-bus reset commands issued during the collection interval. |
| Aborted Commands | The number of aborted SCSI commands during the collection interval. |
| Read Latency (ms) | The average time taken during the collection interval to process a SCSI read command issued from the Guest OS to the virtual machine (ms). |
| Read Rate (kbps) | Disk read rate of this LUN (Kbps) |
| Reads | Number of reads to this LUN |
| Write Latency (ms) | The average time taken during the collection interval to process a SCSI write command issued by the Guest OS to the virtual machine (ms). |
| Write Rate (kbps) | Disk write rates of this LUN (kbps) |
| Writes | Number of writes to this LUN |
Hardware
Shows you the metrics pertaining to the physical hardware where the server is running.
| Metrics | Description |
| Power | Name of the power device used and the corresponding reading in Watts |
| Fan | Name of the system board fan and the corresponding value in % |
| Temperature | Components and their corresponding running temperature value in Degree Celcius |
| Processors | Details of the processors |
Help Performance Metrics VMware Monitor
Site24x7 is a service by Corp.
