Are third-party tools necessary to monitor your VMware infrastructure?

Monitoring every resource in your VMware environment is crucial to avoid sudden issues and ensure proper capacity planning. Although VMware offers its own monitoring suite, organizations frequently seek out third-party monitoring tools. The start of this trend dates back to the early days of vSphere, and it has only continued to increase. This is because third-party tools provide monitoring for the compute, storage, network, and analytics aspects of VMware environments, all from a single interface.
Analyzing the process of VMware monitoring by resource, like ESX/ESXi hosts, VMs, and datastores will shed light on what more can be achieved by using a storage, health, and performance monitoring tool.
The more-than-just-monitoring experience
VMware offers an enterprise-level virtualization and cloud computing tool that enables organizations to manage data center and desktop applications at different levels of their hierarchy. Any amount of unavailability or performance degradation in a VMware environment can be costly, taking a toll on the entire business. Monitoring your VMware environment from a second point of view is always a viable option.
Moreover, by sticking to the management software that comes with the product, you may not know if you’re being delivered what you actually paid for. You can also obtain a better monitoring experience with visual aids like graphs and dashboards, as well as additional information like guest disk details, by looking beyond vSphere.
A look at different VMware resources and why they need to be monitored with third-party tools
Compared to vSphere, many monitoring tools provide features that are either a must-have or simply make the monitoring experience better. Here's an exhaustive list of additional features found in third-party tools that simplify your monitoring, categorized by infrastructure component.
ESX/ESXi hosts:
Monitoring the performance and health of ESX hosts for longer durations helps you analyze the trends and patterns for spikes in usage. If you want to view ESX host monitoring data for different timelines, i.e. for configurable timelines, you need a third-monitoring tool. Viewing ESX data without vCenter, especially more than an hour's worth of data, also requires a third-party tool. Another simple use case, viewing the details of VMs associated with a host along with the ESX core metrics—without switching tabs, isn’t possible with VMware’s native monitoring.
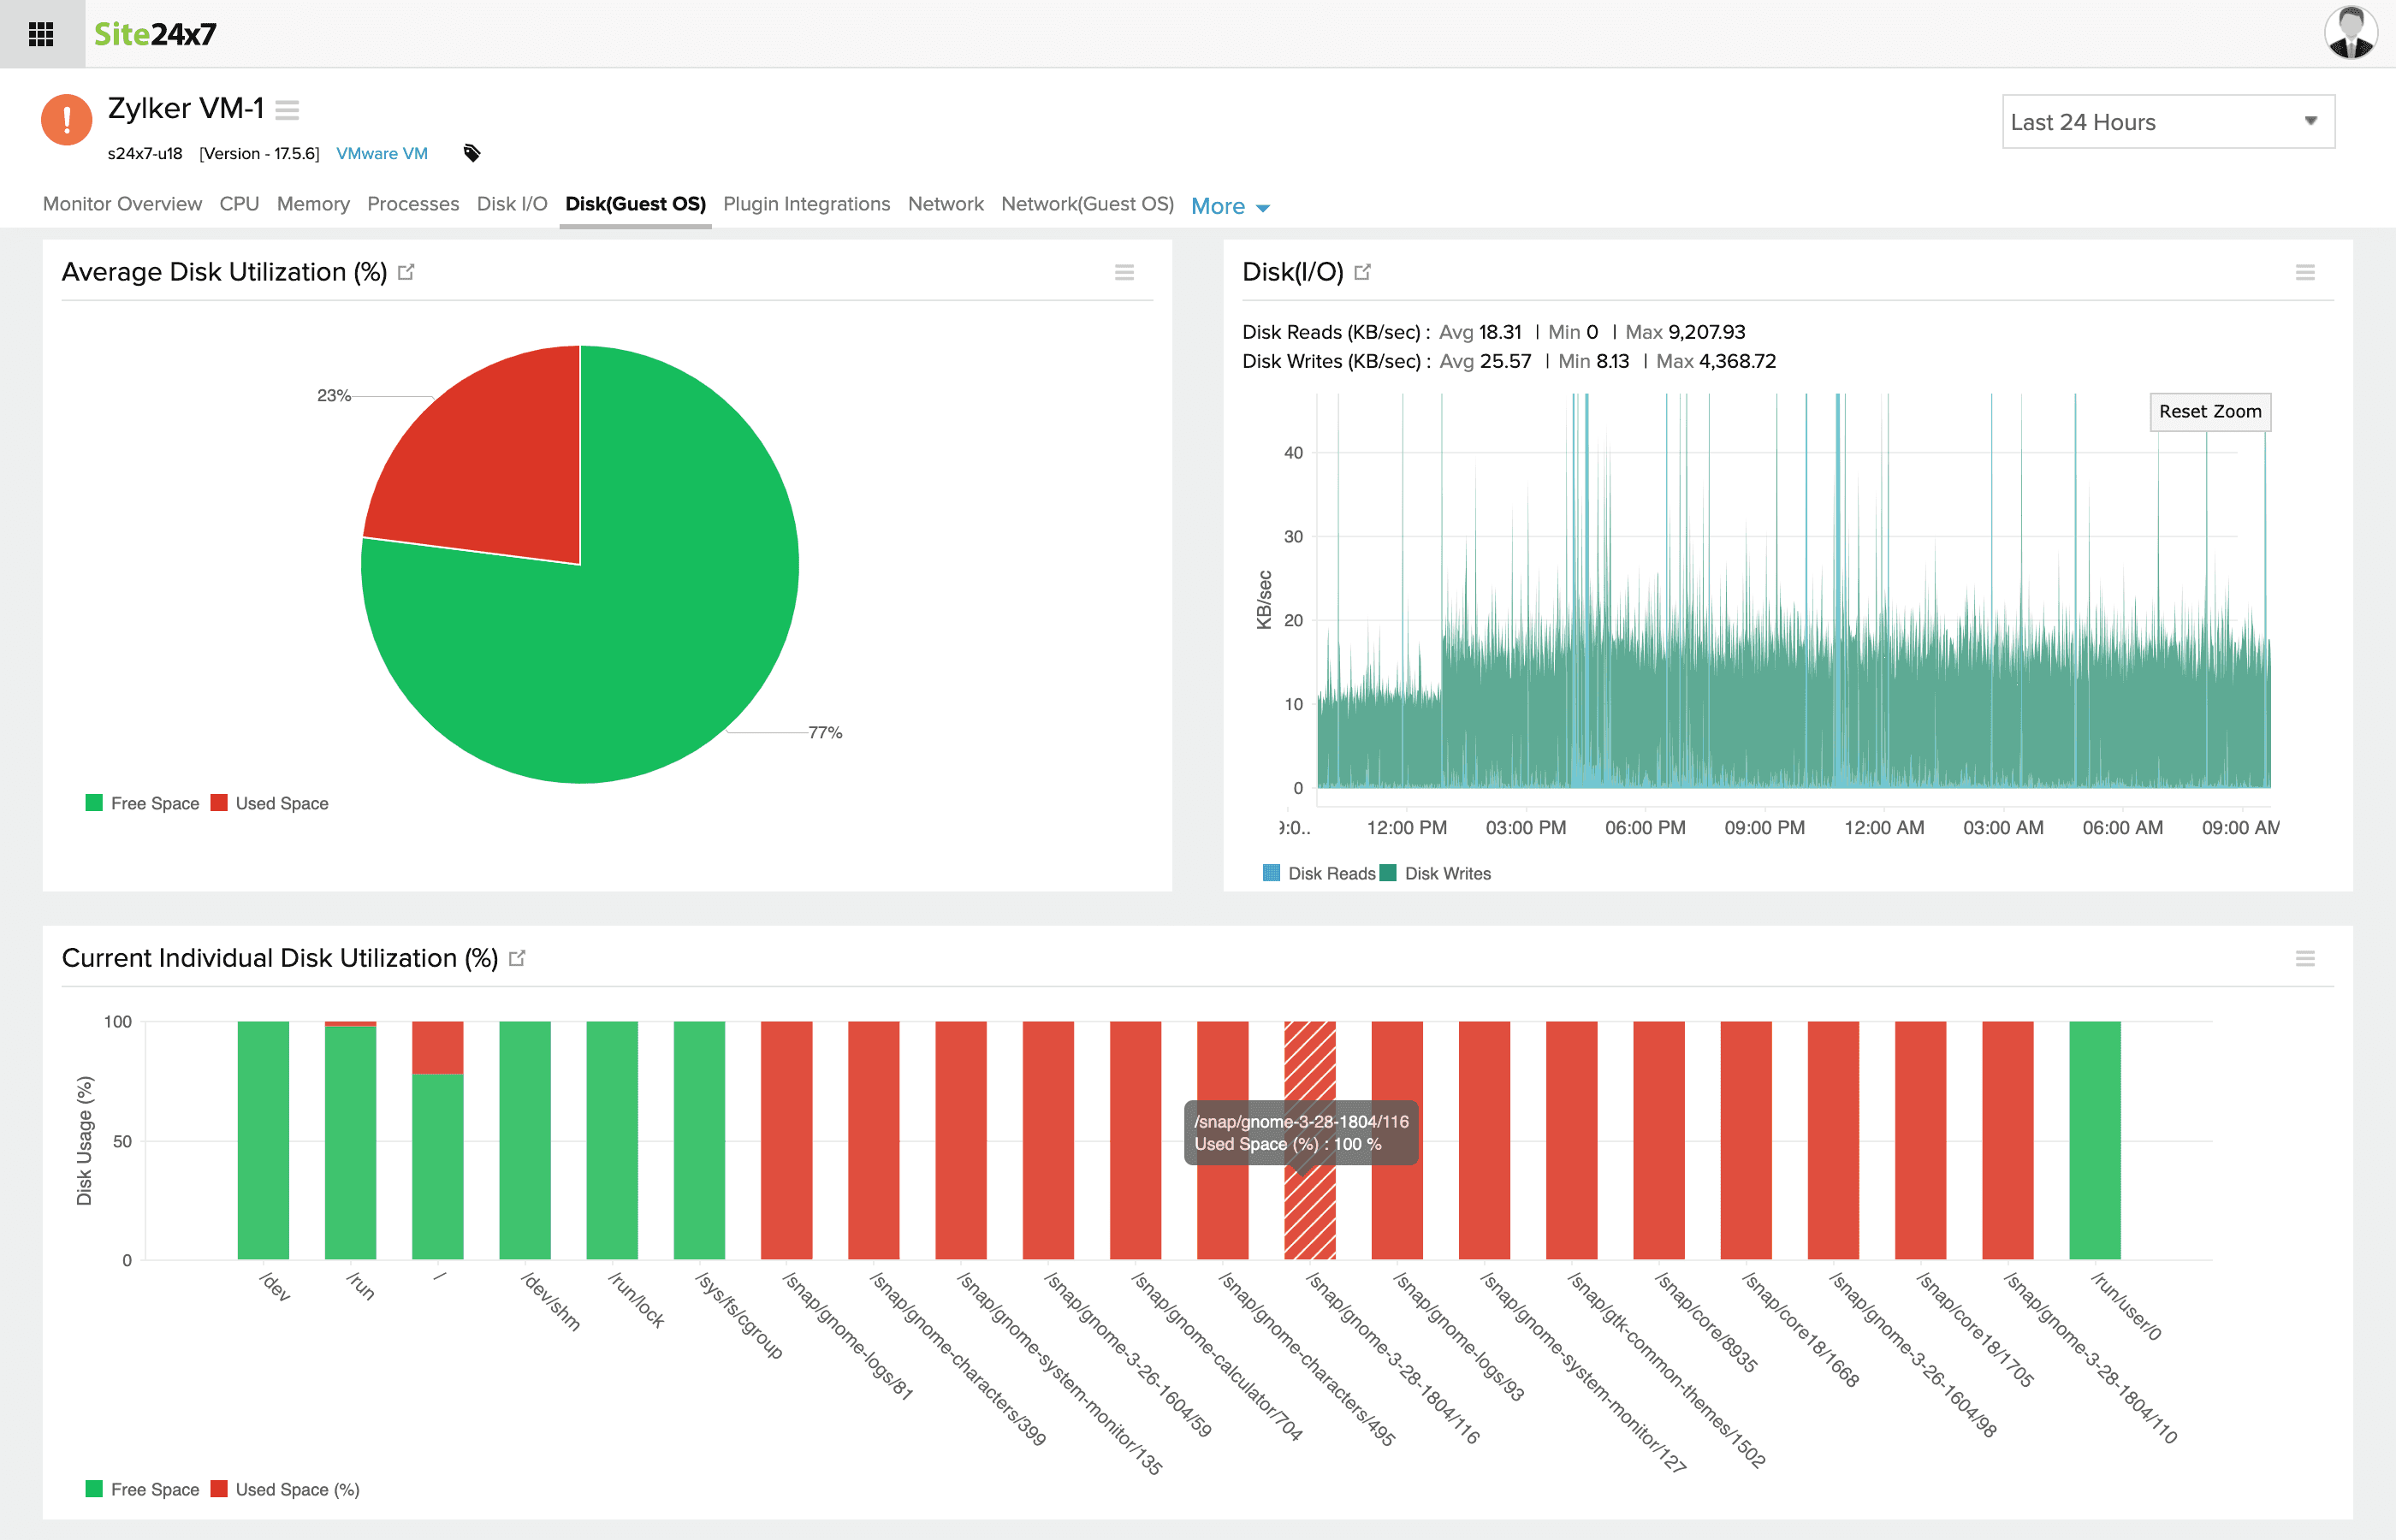
Virtual machines (VMs):
Guest disk details are important metrics for VMs. To plan resource allocation, it’s important to analyze the VM usage trend, which is greatly influenced by the guest disk partition and other performance metrics of the guest disk, at the OS level. It's also essential to monitor the disk partition in a VM, for which provisioned space and reclaimable space are key metrics.
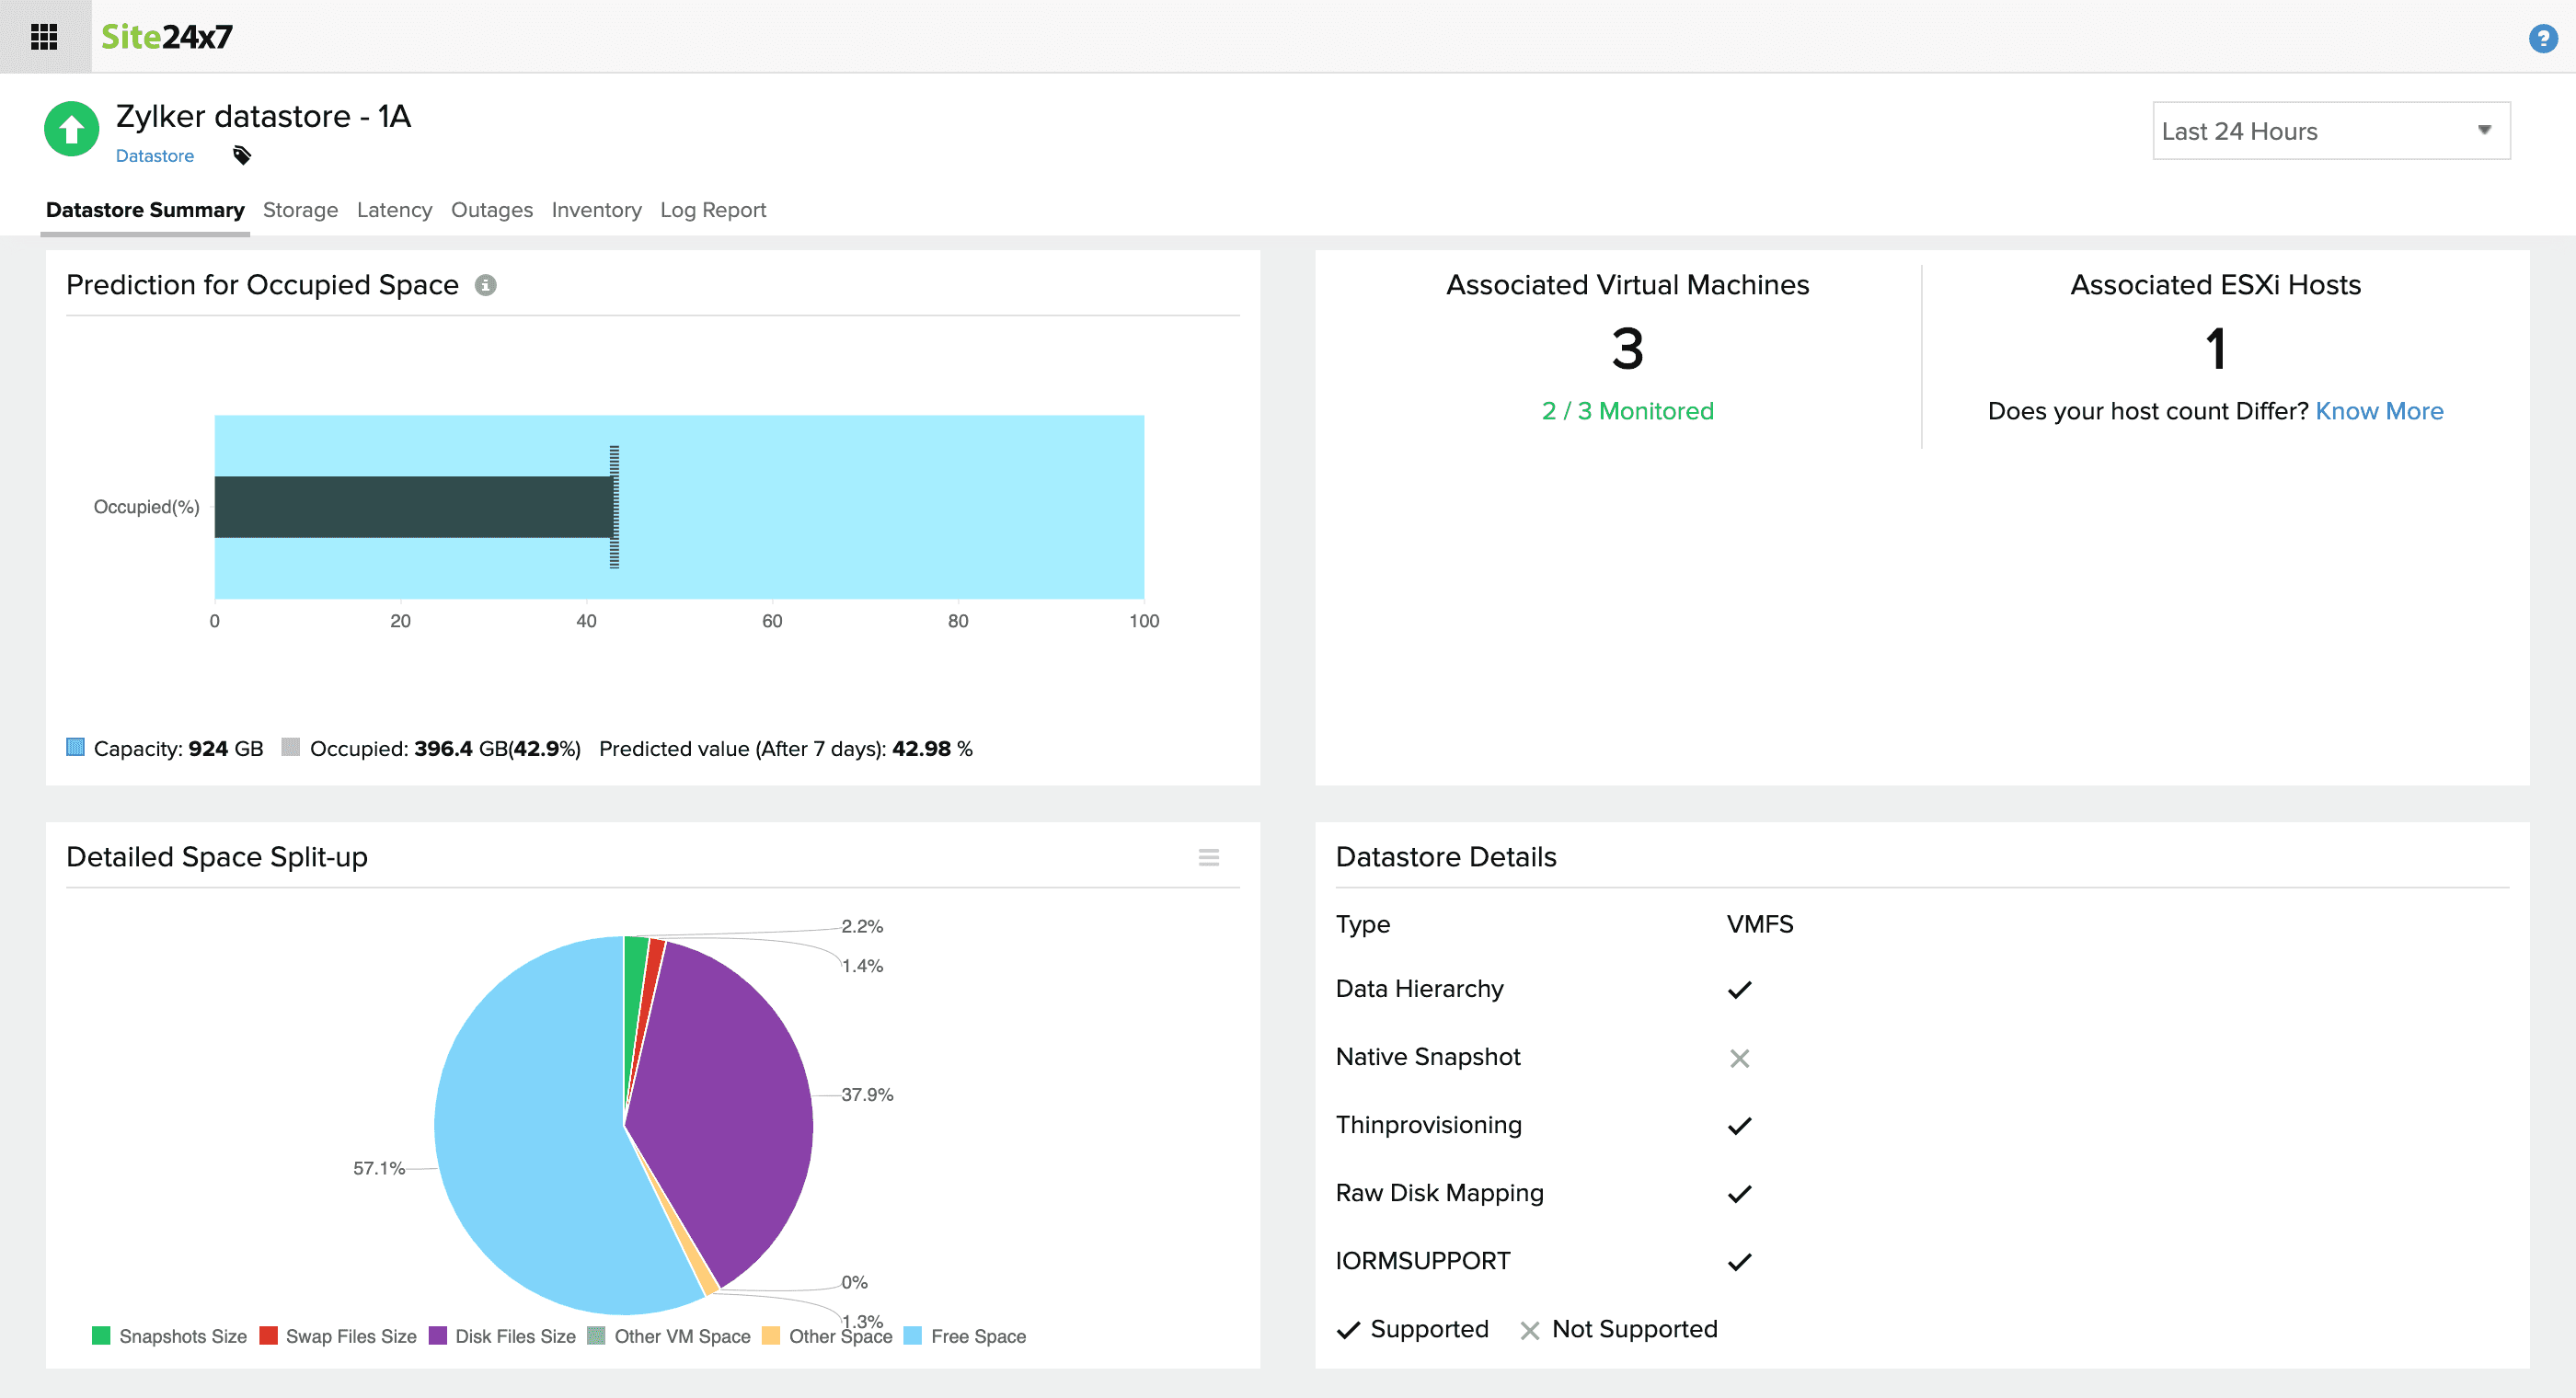
Datastores:
Since datastores are the key storage entities in a VMware environment, it's always important to keep track of their occupied space. Snapshots can use up disk space very quickly. You need to monitor current usage while forecasting future trends for available space, space used by snapshots, and disk space, and this can only be achieved with an AI-powered tool. On a similar note, historical data on free space is also essential to analyze when and what used up storage space in the past.
Seeing a datastore’s read/write rate, the operations of various VMs that use it, and its latency in the same tab helps you understand how each VM uses that datastore.
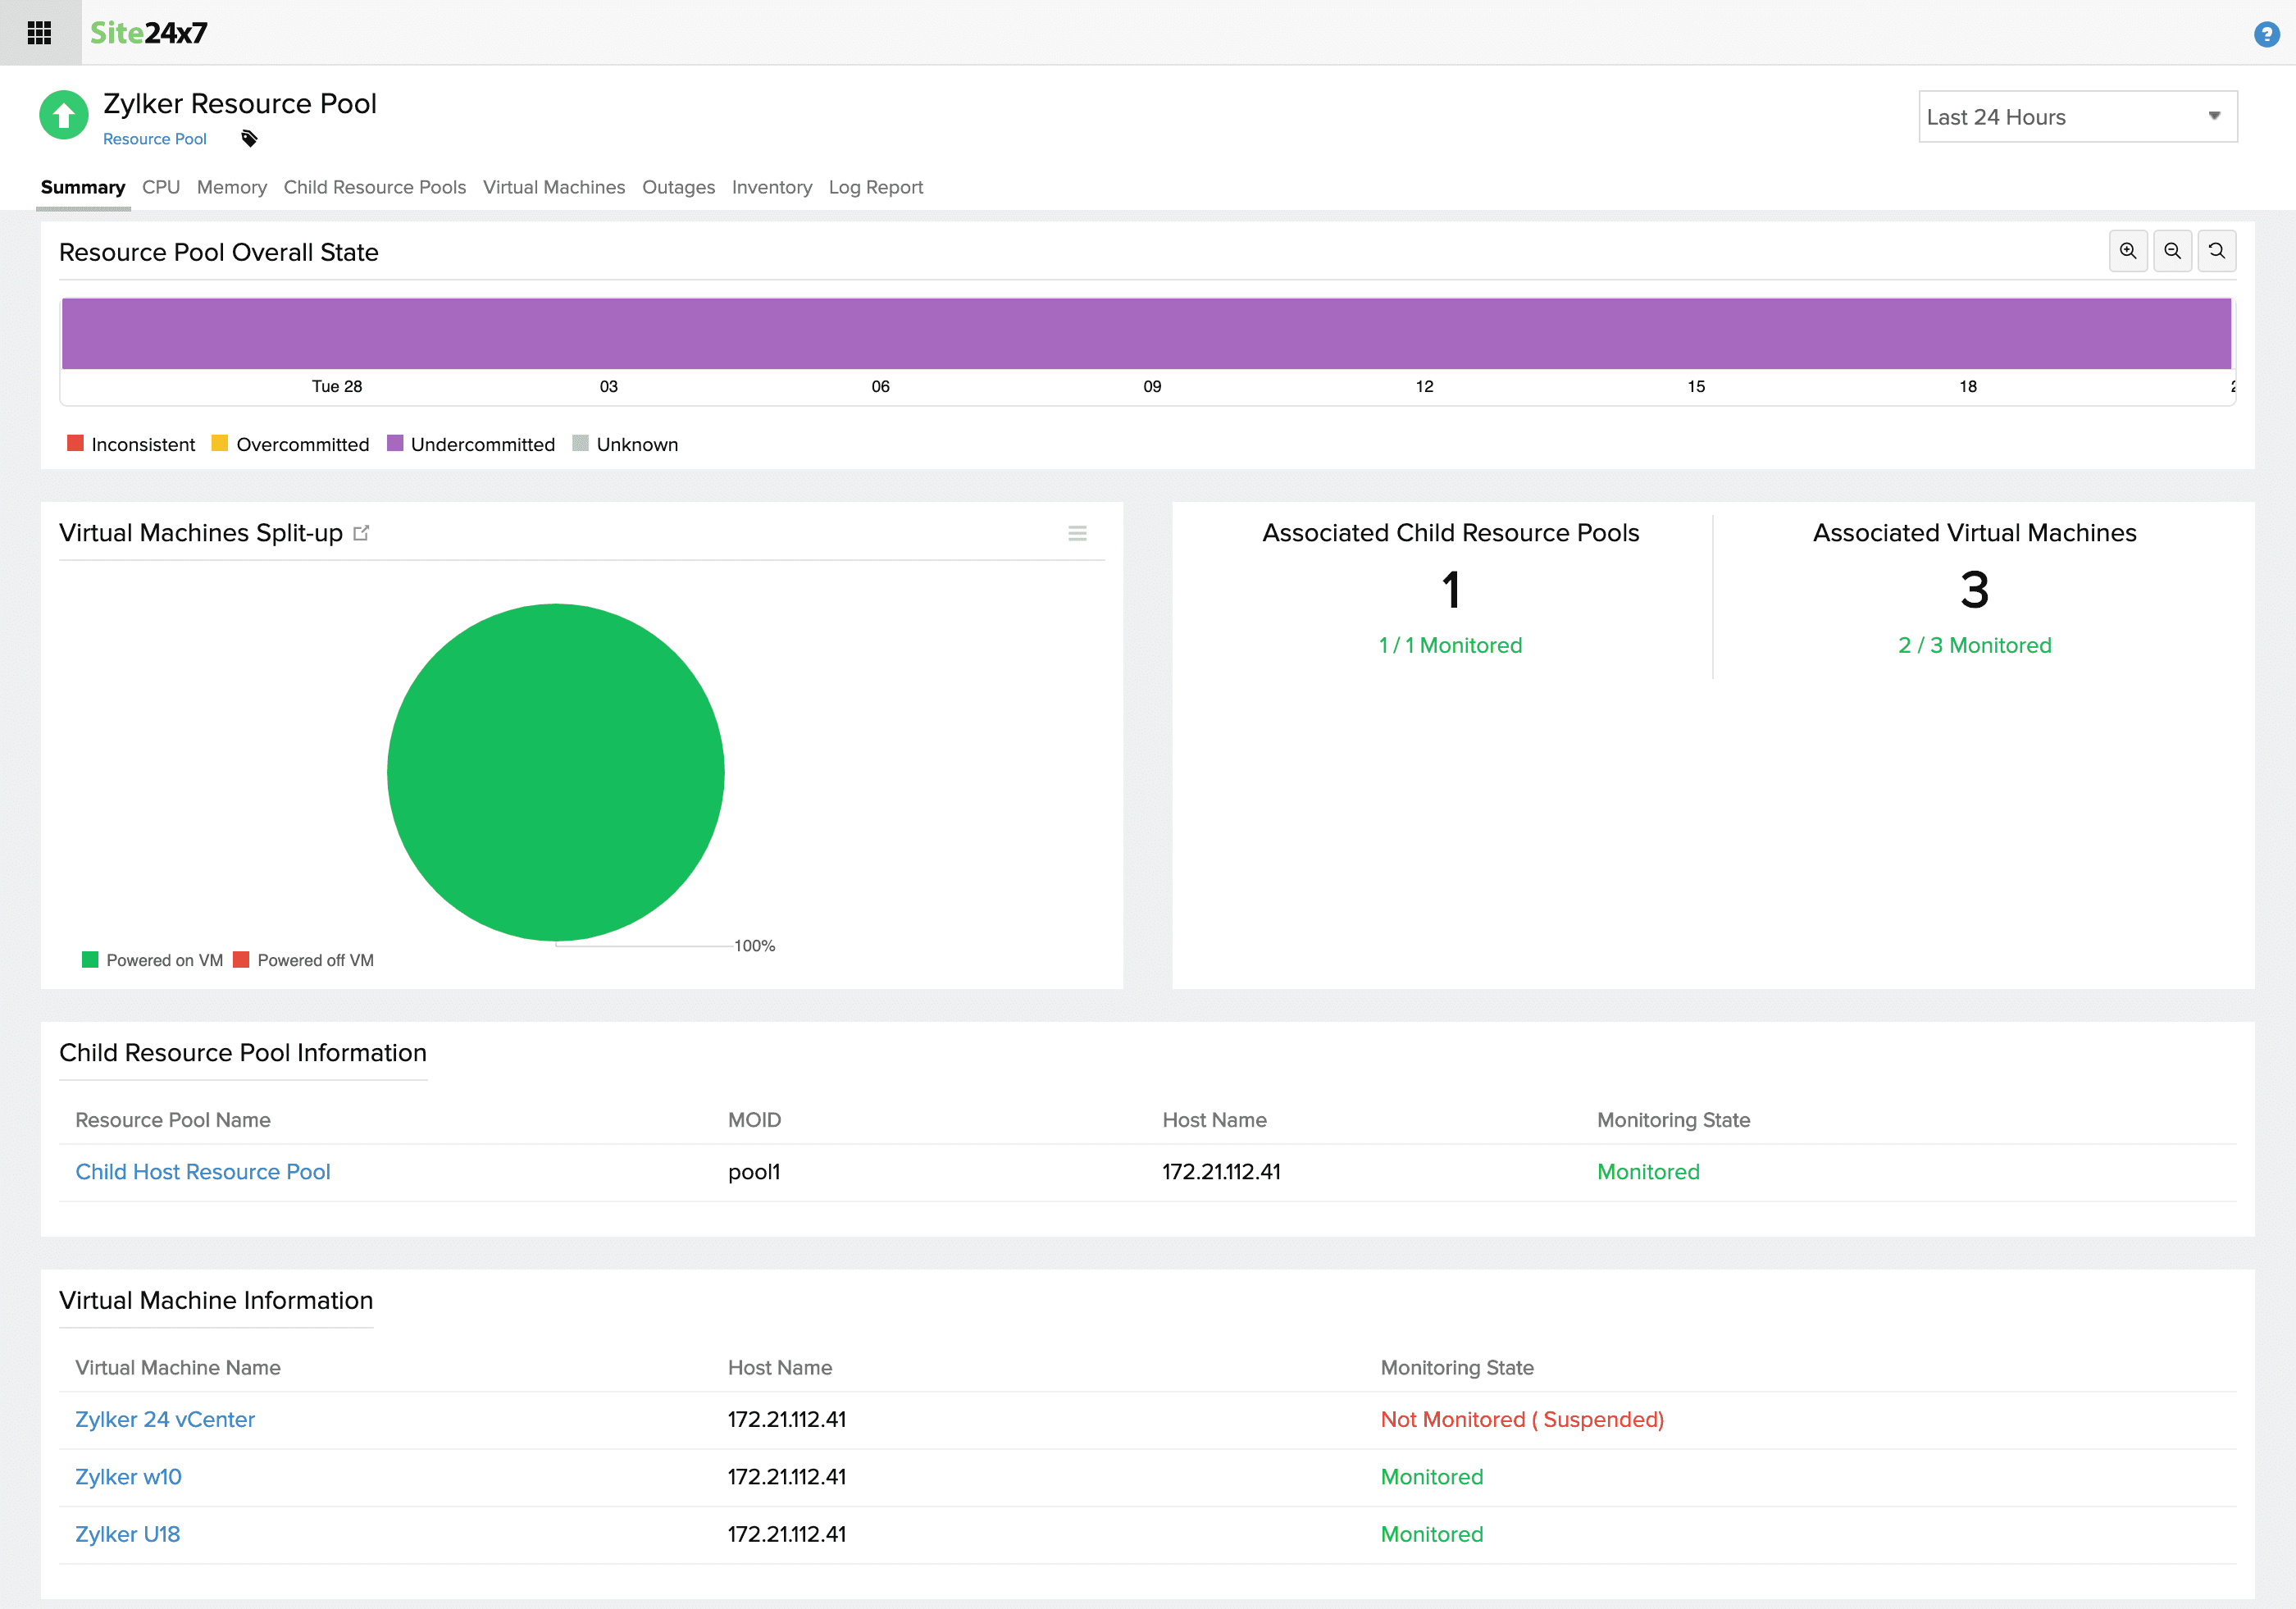
Resource pools:
As their name indicates, resource pools are the resource reserves, and it's important that they are always under-committed to avoid performance issues. Monitoring just the resource pool may not be complete, because you’ll miss out on the resource pool's overall tree state, its child resource pools, and the child VMs that use it. Monitoring the CPU and memory utilization of all your resource pools from a single pane would offer comprehensive monitoring, and you’ll only find that kind of functionality in a third-party tool.
After the adoption of vSphere HA and DRS, organizations should be particularly concerned about monitoring resource pools at the cluster level and not just the ESXi host level. Third-party monitoring tools solve that particular issue by offering flexibility on how to monitor resources.
Features complimenting monitoring
In addition to the resource-level features mentioned above, only third-party monitoring tools provide the intuitive views needed to simplify the monitoring experience. Custom dashboards, timeline-based views for monitoring, scheduled reports, threshold configurations, and third-party integrations for alerting are just a few noteworthy features.
What's special about Site24x7?
Site24x7 is one such comprehensive monitoring tool that provides monitoring for a wide range of virtual infrastructure components as part of its all-in-one monitoring portfolio. Site24x7 VMware Monitoring offers complete visibility into vSphere environments with intuitive graphs and includes all the above features for a full-fledged monitoring experience.
With threshold configuration, notification profiles, and integrations, you’ll receive alerts on issues like almost depleted resources and imminent downtime through different channels of your choice. AI-powered predictions, like a seven-day forecast of datastore and VM space, and IT automation to automate incident remediation are two powerful features that only Site24x7 provides.
Simply monitoring your virtual infrastructure may not be sufficient to troubleshoot and debug performance issues. Learn what all metrics should you correlate to better understand your VMware environment from our white paper.
Get a personalized demo and start using Site24x7 to monitor your virtual infrastructure.
P.S. Learn about Site24x7 Remote Infrastructure Monitoring.