AWS: How did we monitor the cloud in 2019?
We had a busy 2019 with a substantial number of Amazon Web Service (AWS) integrations into Site24x7, each providing a seamless monitoring experience for our customers. The increasing number of paid AWS monitors is proof that we enhanced the monitoring expectations in 2019. In case you missed any updates about the AWS monitoring platform, here's a year-end review:
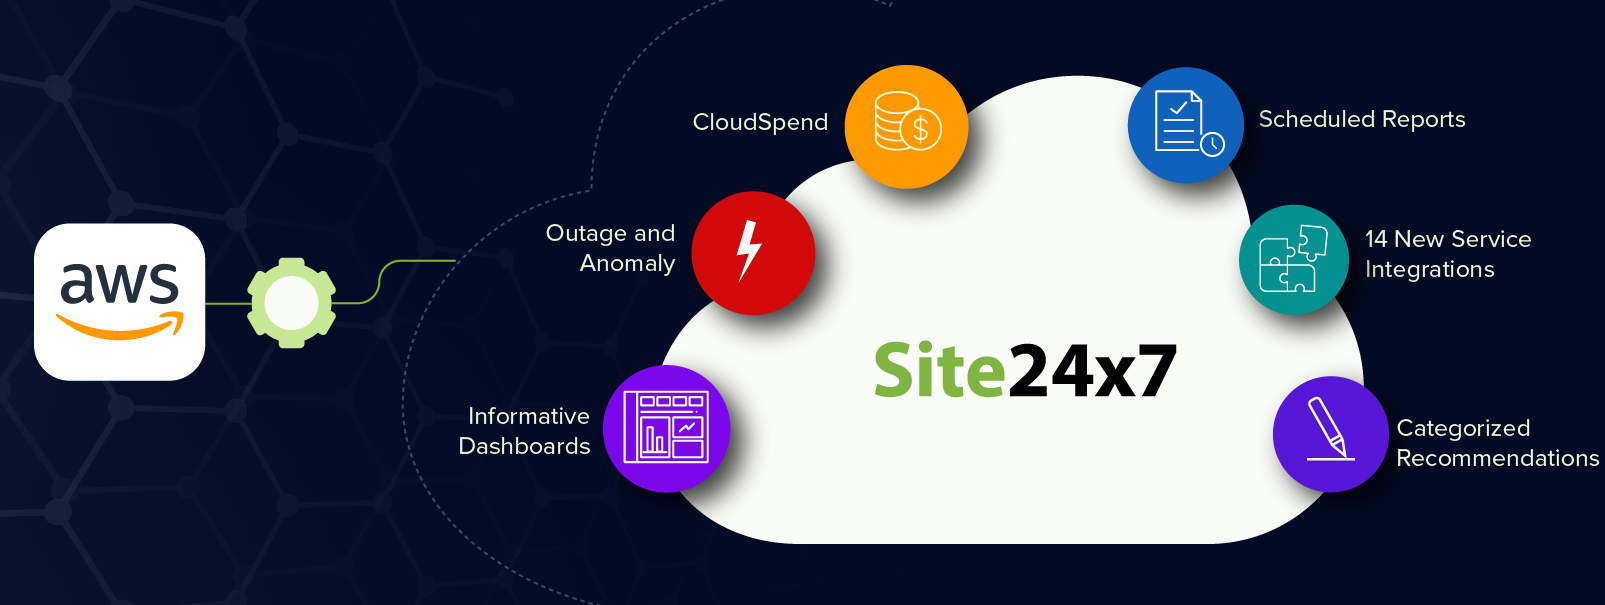
CloudSpend
Adding another feather to our cap is the release of CloudSpend, a cloud cost management solution that helps you track cloud costs accrued in AWS. CloudSpend comes with customized labels called Tag Profiles that can be created for region, service, resource, or instance type. AWS costs can also be viewed by linked accounts, or grouping cloud costs based on different teams, customers, or projects across business units. Plus, create budgets to monitor overspending, and schedule customized reports to be delivered to your inbox.
AWS monitoring best practices
To provide our customers with a cohesive AWS monitoring strategy, we are constantly on a mission to share the best practices and have added 58 new best practices to our existing list. Plus, you can schedule the guidance reports to be delivered in your inbox at a frequency (daily, weekly, monthly, quarterly) and a reporting time, you choose.
Recent AWS integrations
The year went by observed a release of fourteen new services in our AWS monitoring platform. We started 2019 with four major service integrations: StepFunction, WAF, Route53, and Elastic Map Reduce. These services ensure you gain full-stack visibility into your scalable cloud DNS web service, a big data platform, or a cloud-based web application firewall, all from a unified dashboard.
We understand that your demands continually evolve while commissioning the EC2 instances. To cater to your needs, we have now integrated the EC2 Auto-Scaling group to easily monitor the addition and removal of EC2 instances in groups according to the conditions you define.
Lightsail instance monitoring is another unique monitoring experience integrated at Site24x7. We provide you with agentless Lightsail instance monitoring that enables you to keep an eye on your lightweight instances used for popular content management systems (CMSs) like WordPress, Drupal, or even custom sites.
Kubernetes has recently become the town talk, but the time-consuming cluster management process is a huge obstacle for many organizations. Amazon EKS lets you create Kubernetes clusters in the cloud in no time. Plus, with Site24x7's integration, you can track your Amazon EKS at the cluster, node, and namespace level for complete visibility.
Other key service integrations that provide you with tailor-made reporting to have all the information you need to monitor your cloud service include ElasticSearch, KMS, CloudSearch, NAT Gateway, WorkSpaces, Neptune, and Certificate Manager.
Notable feature releases and enhancements
As a customer-centric organization that builds its products by meeting customer needs, we anticipate customer "wants" and add them to our product roadmap. The following feature releases and enhancements came to us from your constant feedback:
- Container insight support extended for Amazon ECS monitoring
- Choose the number of days (one to 30) you would like to hold the resource before termination, and receive an alert on resource termination
- Inventory reports that provide a summarized view of all your active monitors in a single click, and scheduled to be delivered to your inbox
- Extending multiple polling frequency based on tags
- Outage and anomaly reporting at individual Amazon account level
- Revamped Infrastructure dashboard with NOC view at each Amazon account level
- Inventory widgets in a custom dashboard
We hope we exceeded your expectations in 2019. We're incredibly excited to deliver on our promise to provide you with a hassle-free user experience in 2020 for your AWS monitoring ecosystem.
Gain insight into Site24x7's year in review 2019 here.
At a high level, I would request to make some cosmetic changes that would bring some consistency on how information is displayed.
There is inconsistency between the number of monitors displayed per AWS account at "All accounts" level view and the individual account level view. In my case at All accounts level it displays I have 387 monitors for my rfsprod account, whereas when I click on rfsprod account, in the inventory dashboard it shows, I only have 356 monitors for the same account (see the attached screenshots). What a confusing message!
I believe that at the all account level it shows all the monitors including the suspended ones (in an automated system, it is expected that we will have suspended monitors in AWS e.g. due to auto scale operation). It would make much more sense if that information is displayed at the all account level i.e. 387 total, 356 active and 31 suspended monitors. And, when I click on those active or suspended ones, it should take me to the relevant monitors.
At all accounts level tiles, when I click on a tile, nothing happens. However, if I click on the little arrow on top right corner of the tile, it takes me to that particular account. Isn't it inconsistent when compared to other type of monitors in site24x7? The expected behaviour, when I click on the tile, it will take me to that account in the same tab and if I click on the arrow on the top right corner, it should take me to that account in a new tab. That would make consistent behaviour, as in the case of other type of monitors.
When I click on an AWS account, it displays tiles for various aws monitor types e.g. S3 bucket, lambda function etc and it displays the number of monitors of that type in that tile, which is great. If I have excluded a particular type of AWS resource for not to be monitored, there is a link in those tiles to "Enable integration". However, there is no such link called "disable Integration" in the tiles for resource types which are already monitored. Its needed, because its consistent and allows a customer to easily disable (for whatever reason) instead of going to account configuration, which is an unnecessary pain.
Consistency does help customers to learn and use product easily.
When adding AWS account, there is no way I can add a tag to all the monitors for that AWS account. Although, site24x7 does automatically add an account tag, however, these tags cannot be used in configuration rule, it does not show up. So, whats the use of those account tags? Pl allow customers to use it or add tags at the time of adding AWS accounts.
Kind Regards,
Ash
Hi Ash,
Thanks for reaching out with your feedbacks.
We will check on all your concerns and see if we can improve the user experience accordingly.
Regards,
Ananthkumar K S
Can I suggest another improvement here (again inconsistent with other products)?
When I click on any of the products e.g server, network etc, the top tile shows the total number of monitors, how many up, how many down and how many trouble etc (see attached screenshot). This is a very vital and handy information. Why this is missing from cloud (I only use AWS, I can't tell whether its there for Azure or GCP, but certainly missing for AWS)? It should be there / per account.
Kind Regards,
Ash
Hi Ash,
Kindly post any requirement that you may have . We will try to validate and provide it.
With respect to your requirement on count for Up, Down , Trouble etc , we show this view in the overall list view of Server or APM as all the monitors are listed under one view. But , in case of Amazon monitors , there can be multiple Amazon accounts. Due to this , this view is placed under each type of service like EC2 , RDS etc. We will think on how we can accommodate this request of yours .
Regards,
Ananthkumar K S