
Greetings from Site24x7!
The year 2023 was eventful for us at Site24x7. We hope our releases and updates enhanced your user experience and ensured your monitoring journey has been smooth, easy and productive.
As we wrap up another year, we are indebted to you for choosing us as your monitoring solution and appreciate your suggestions and feedback that are so important for helping us fine-tune our products.
As we wrap up another year, we are indebted to you for choosing us as your monitoring solution and appreciate your suggestions and feedback that are so important for helping us fine-tune our products.
Here's a glimpse of a few of the updates the Site24x7 team released in the internet services, web transaction (browser), and real user monitoring spheres.
Internet Services
In the internet services monitoring realm, our releases and enhancements were developed to ensure a better monitoring experience for you.
- The new File Upload and gRPC monitors help you track availability and enhance performance.
Two new monitors, namely, File Upload and gRPC, were released in 2023.
The File Upload monitor helps track the availability and response of your multipart API endpoints from multiple locations. This monitor helps you to get alerted if the API response values does not validate against the specified RegEx/XPath/JSONPath assertions. This monitor ensures that your files are uploaded without any errors. By adding a gRPC monitor, you can ensure that the cross-platform open source high performance remote procedure call (RPC) framework or gRPC services are available. The can be done by configuring Health Status Checks and checking the performance of the services with the help of Behavior or Functionality Checks from gRPC monitoring. - Poll Now reports ensure you gain visibility into location-based metrics for your monitors in real-time.
A Poll Now report helps you gain insights on your monitors’ performance- and availability-related metrics from all configured locations. - The Add Bulk URLs option saves you time and simplifies the process of bulk monitor creation.
We released a new Add Bulk URLs option for a couple of internet services monitors to help you add your sitemaps, individual URLs, URLs in CSV format, and more for continuous monitoring. Say, for instance, that you want new URLs to be added for monitoring, and you want to delete others from the sitemap. This can be achieved by using the continuous check option. - Use the Exhaustive CDN reports to drill deep and fine-tune the performance of your CDNs.
A CDN helps reduce latency and improve the user experience by correctly rendering content. With our CDN reports, you can optimize the performance of your websites by obtaining location-specific performance data, and by identifying the domains with high response times and frequently missed resources.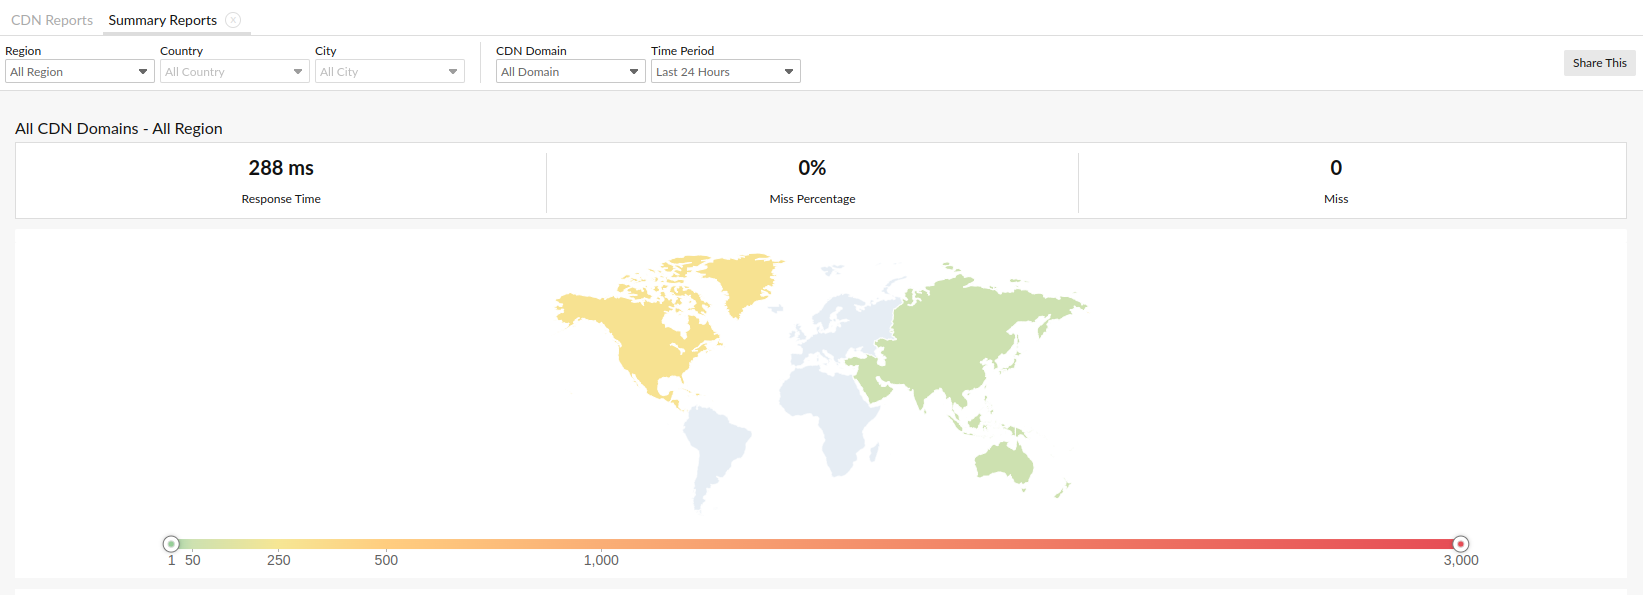
- Enhancements for the REST API and REST API Transaction monitors.
- We brought in AWS Signature support for authenticating the endpoints hosted on the AWS API gateway.
- We introduced a set of standard HTTP methods and options to use custom HTTP methods, like PROPFIND, PROPPATCH, CONNECT, OPTIONS, TRACE, to monitor various APIs like CalDav or CardDav, and to perform calendar API monitoring or Contact API monitoring.
- Gain visibility into granular details related to your site or application with our new integration.
If you have internet services and application performance monitors (APM) created in Site24x7 for the same website or application, you can obtain application trace details that help debug your resources. With this seamless integration, you can view details on method calls, database queries, or exceptions related to the application that might affect the user experience. This is supported for Website, REST API, REST API Transaction, and Web Transaction (Browser) monitors. - Leverage the Lighthouse report to gain insights about web page speed (browser) monitors.
A lighthouse report can be valuable for a website by providing insights and actionable recommendations to improve key aspects of performance, accessibility, SEO, and more. You can now view a detailed lighthouse report for the URL you've used for creating the webpage speed monitor.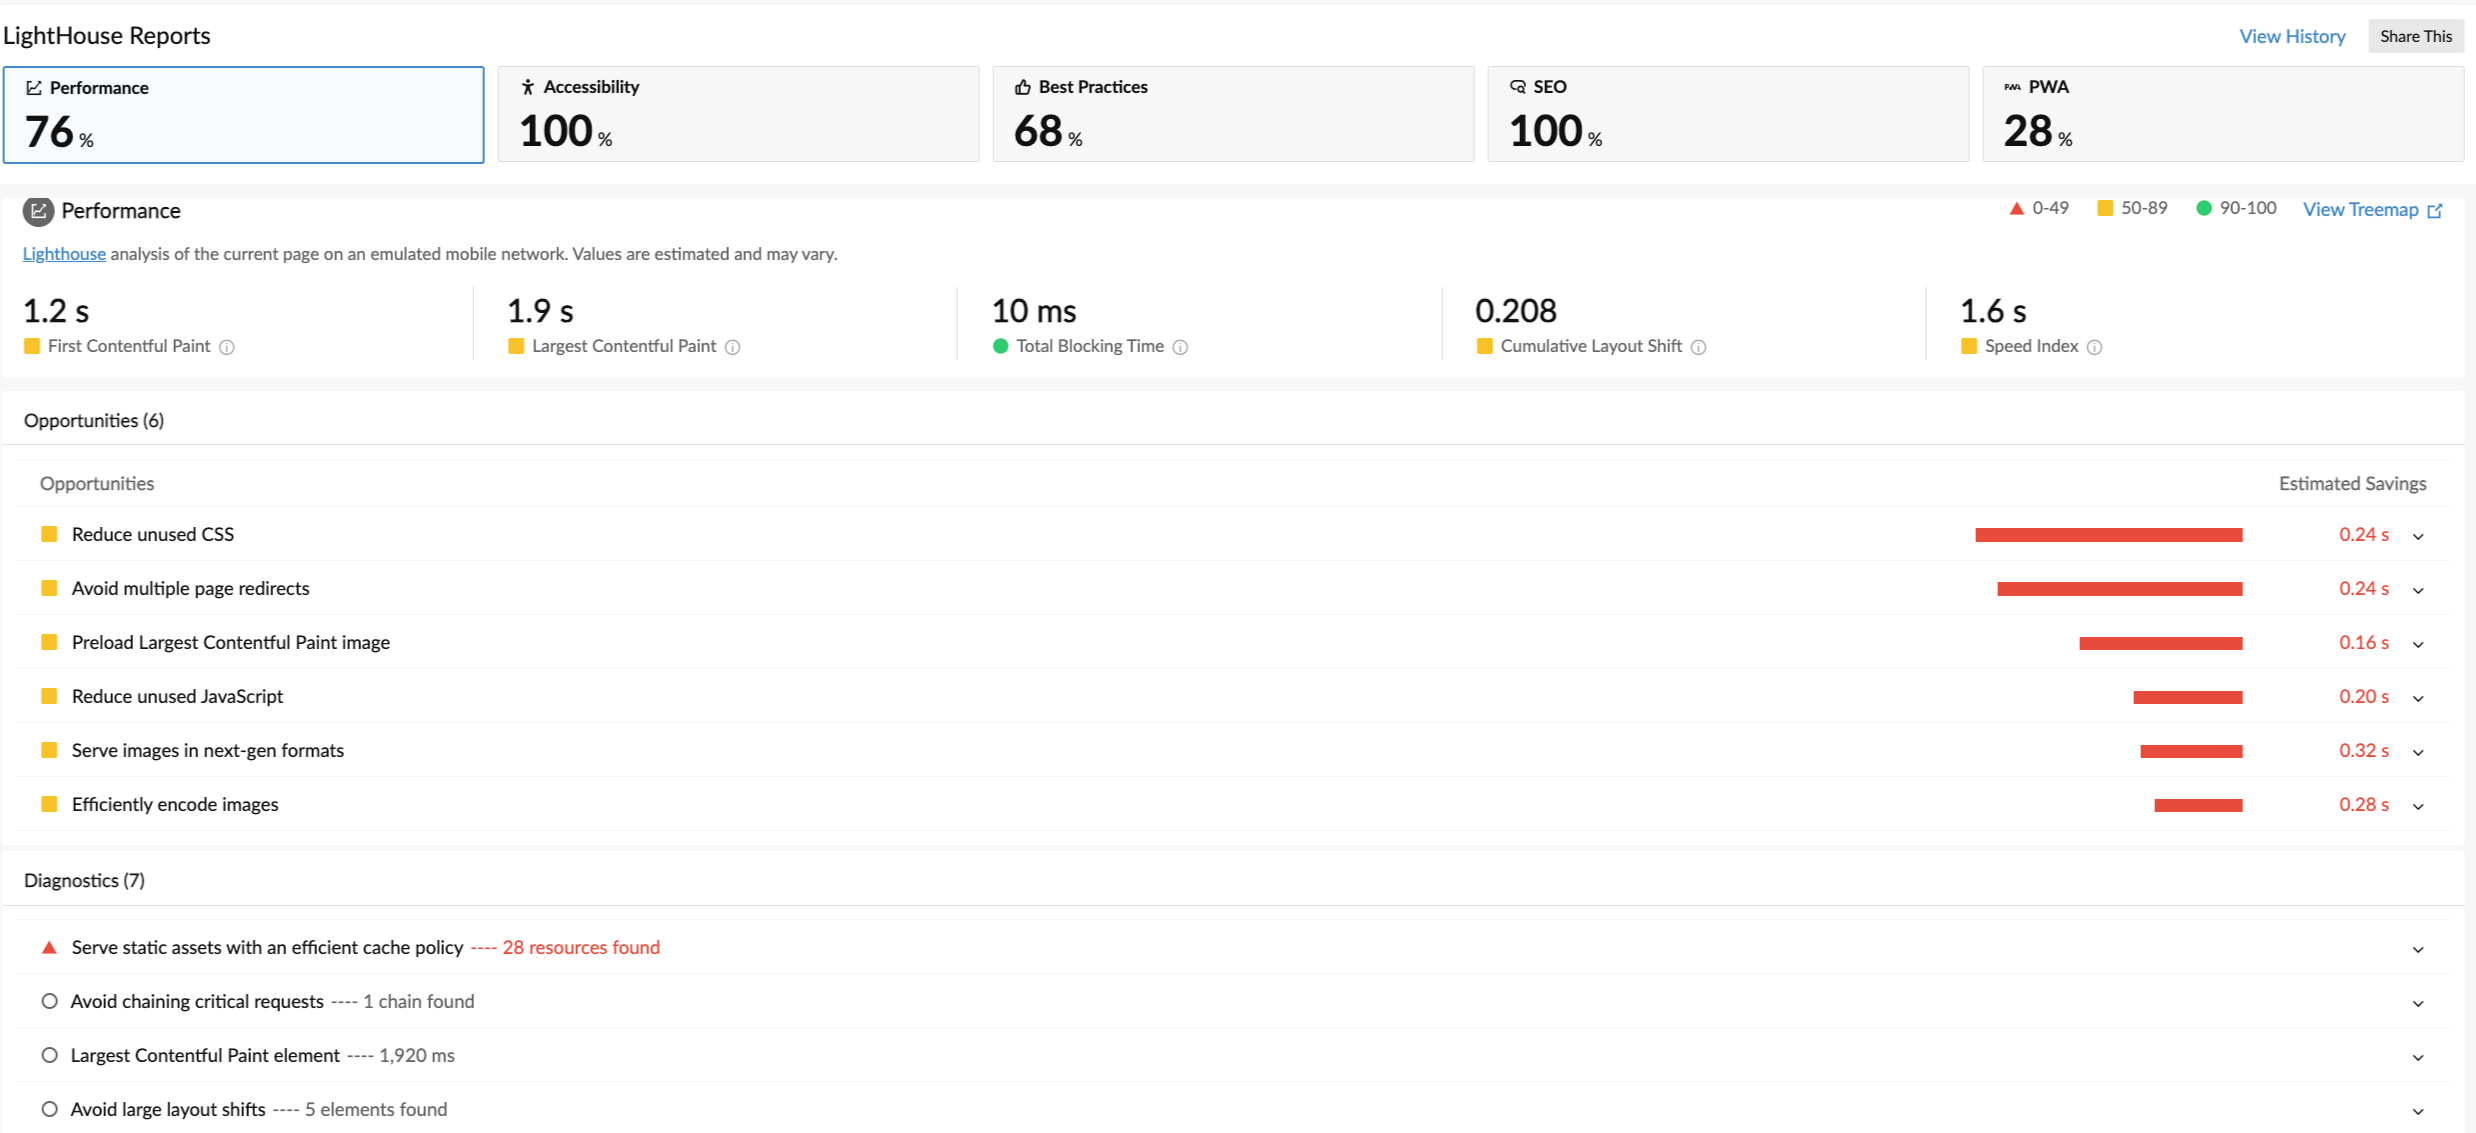
- Explore enhanced TCP protocol support for DNS monitors.
In addition to UDP support, we've introduced the option to use the TCP protocol to query your DNS servers. This approach enables you to transfer a large amount of data efficiently. - Discover additional performance metrics recently added for mail delivery monitors.
New performance metrics were released to help you analyze the performance of your mail delivery monitors like DNS time, response time, connection time for SMTP and POP/IMAP, or mail delay. You can obtain these details using the detailed graphical representation in the monitor summary page. - Receive more attribute-level response time details about your internet service monitors.
This year we've added options that help you obtain more details on attribute-level data for Website, Web Page Speed (Browser), and Web Transaction (Browser) monitors. With this update, you can now assess or compare the location-based variations in the attribute data and more.
Web Transaction (Browser) monitors
- As part of our efforts to provide an improved user experience for our customers, we've introduced an easy and quick method to add web transaction (browser) monitors.
- To enhance issue debugging and fix performance issues, we've made our RCA report more rich and resourceful by providing these:
- Waterfall Chart: This chart includes data like page resources summary, webpage summary, etc., that help analyze page-level performance issues and component-level performance issues.
- Transaction video playback: You can now easily play back transaction videos and view each step in a transaction clearly.
- Element-highlighted screenshot and HTML comparisons: These enable you to compare the expected screen with the rendered one, as well as compare the HTML to trace-out variations.
- Console errors: This gives details on JavaScript errors, reference errors, network errors, security issues, and warnings related to HTTPS.
Real User Monitoring (RUM)
Here are a few of the updates from the RUM sphere:
- Easy JavaScript error debugging with source maps
The JavaScript errors feature in RUM allows source map uploads that seamlessly detail the minified file with the original code through clear and readable code that shows the exact line of an error.

Some interesting titbits:
JS errors captured in,
JS errors captured in,
- United States data centers -> 4.56 billion
- European data centers -> 2.28 billion
- India data centers -> 0.3 billion
- Waterfall Analysis in Real User Monitoring (RUM)
The Waterfall Analysis chart provides invaluable insights into the list of resources used to load a page and the time taken for each resource. It enables you to see how a page is loaded and identify the requests that took the longest time, enabling you to pinpoint areas for performance optimization on that page. - Enhance user experience with new Web Vitals metrics
Experience improved webpage performance with our latest Web Vitals metrics update that emphasizes Interaction to Next Paint for seamless interactions and Time to First Byte for faster loading. Recognizing and improving these metrics ensure a more responsive and efficient user experience.
If you have any suggestions or feedback, please leave them as comments below. Check our product roadmap to learn more details about the updates planned for 2024. We're looking forward to creating a better digital experience together!
Happy New Year!
The Site24x7 team
Like (5)
Reply
Replies (0)