APIs are an integral part of all modern applications. Its functioning and responsiveness has greater impact on the performance of your application and the end-user experience. With our existing REST API monitor, you can already measure the actual uptime and performance of your API endpoint. But, most modern web applications are complex in nature with a mix of HTML and REST API calls. Sometimes workflows on a web page cannot be completed without performing an AJAX request or consuming third-party APIs. So how do you test such complex workflows? We're happy to announce that we've an all new monitoring tool called REST API Transaction monitor, with which you can measure the responsiveness of your mobile and web applications against your HTTP back-end effortlessly.
Let's run you through all the cool new features one-by-one that our REST API Transaction Monitor has to offer.
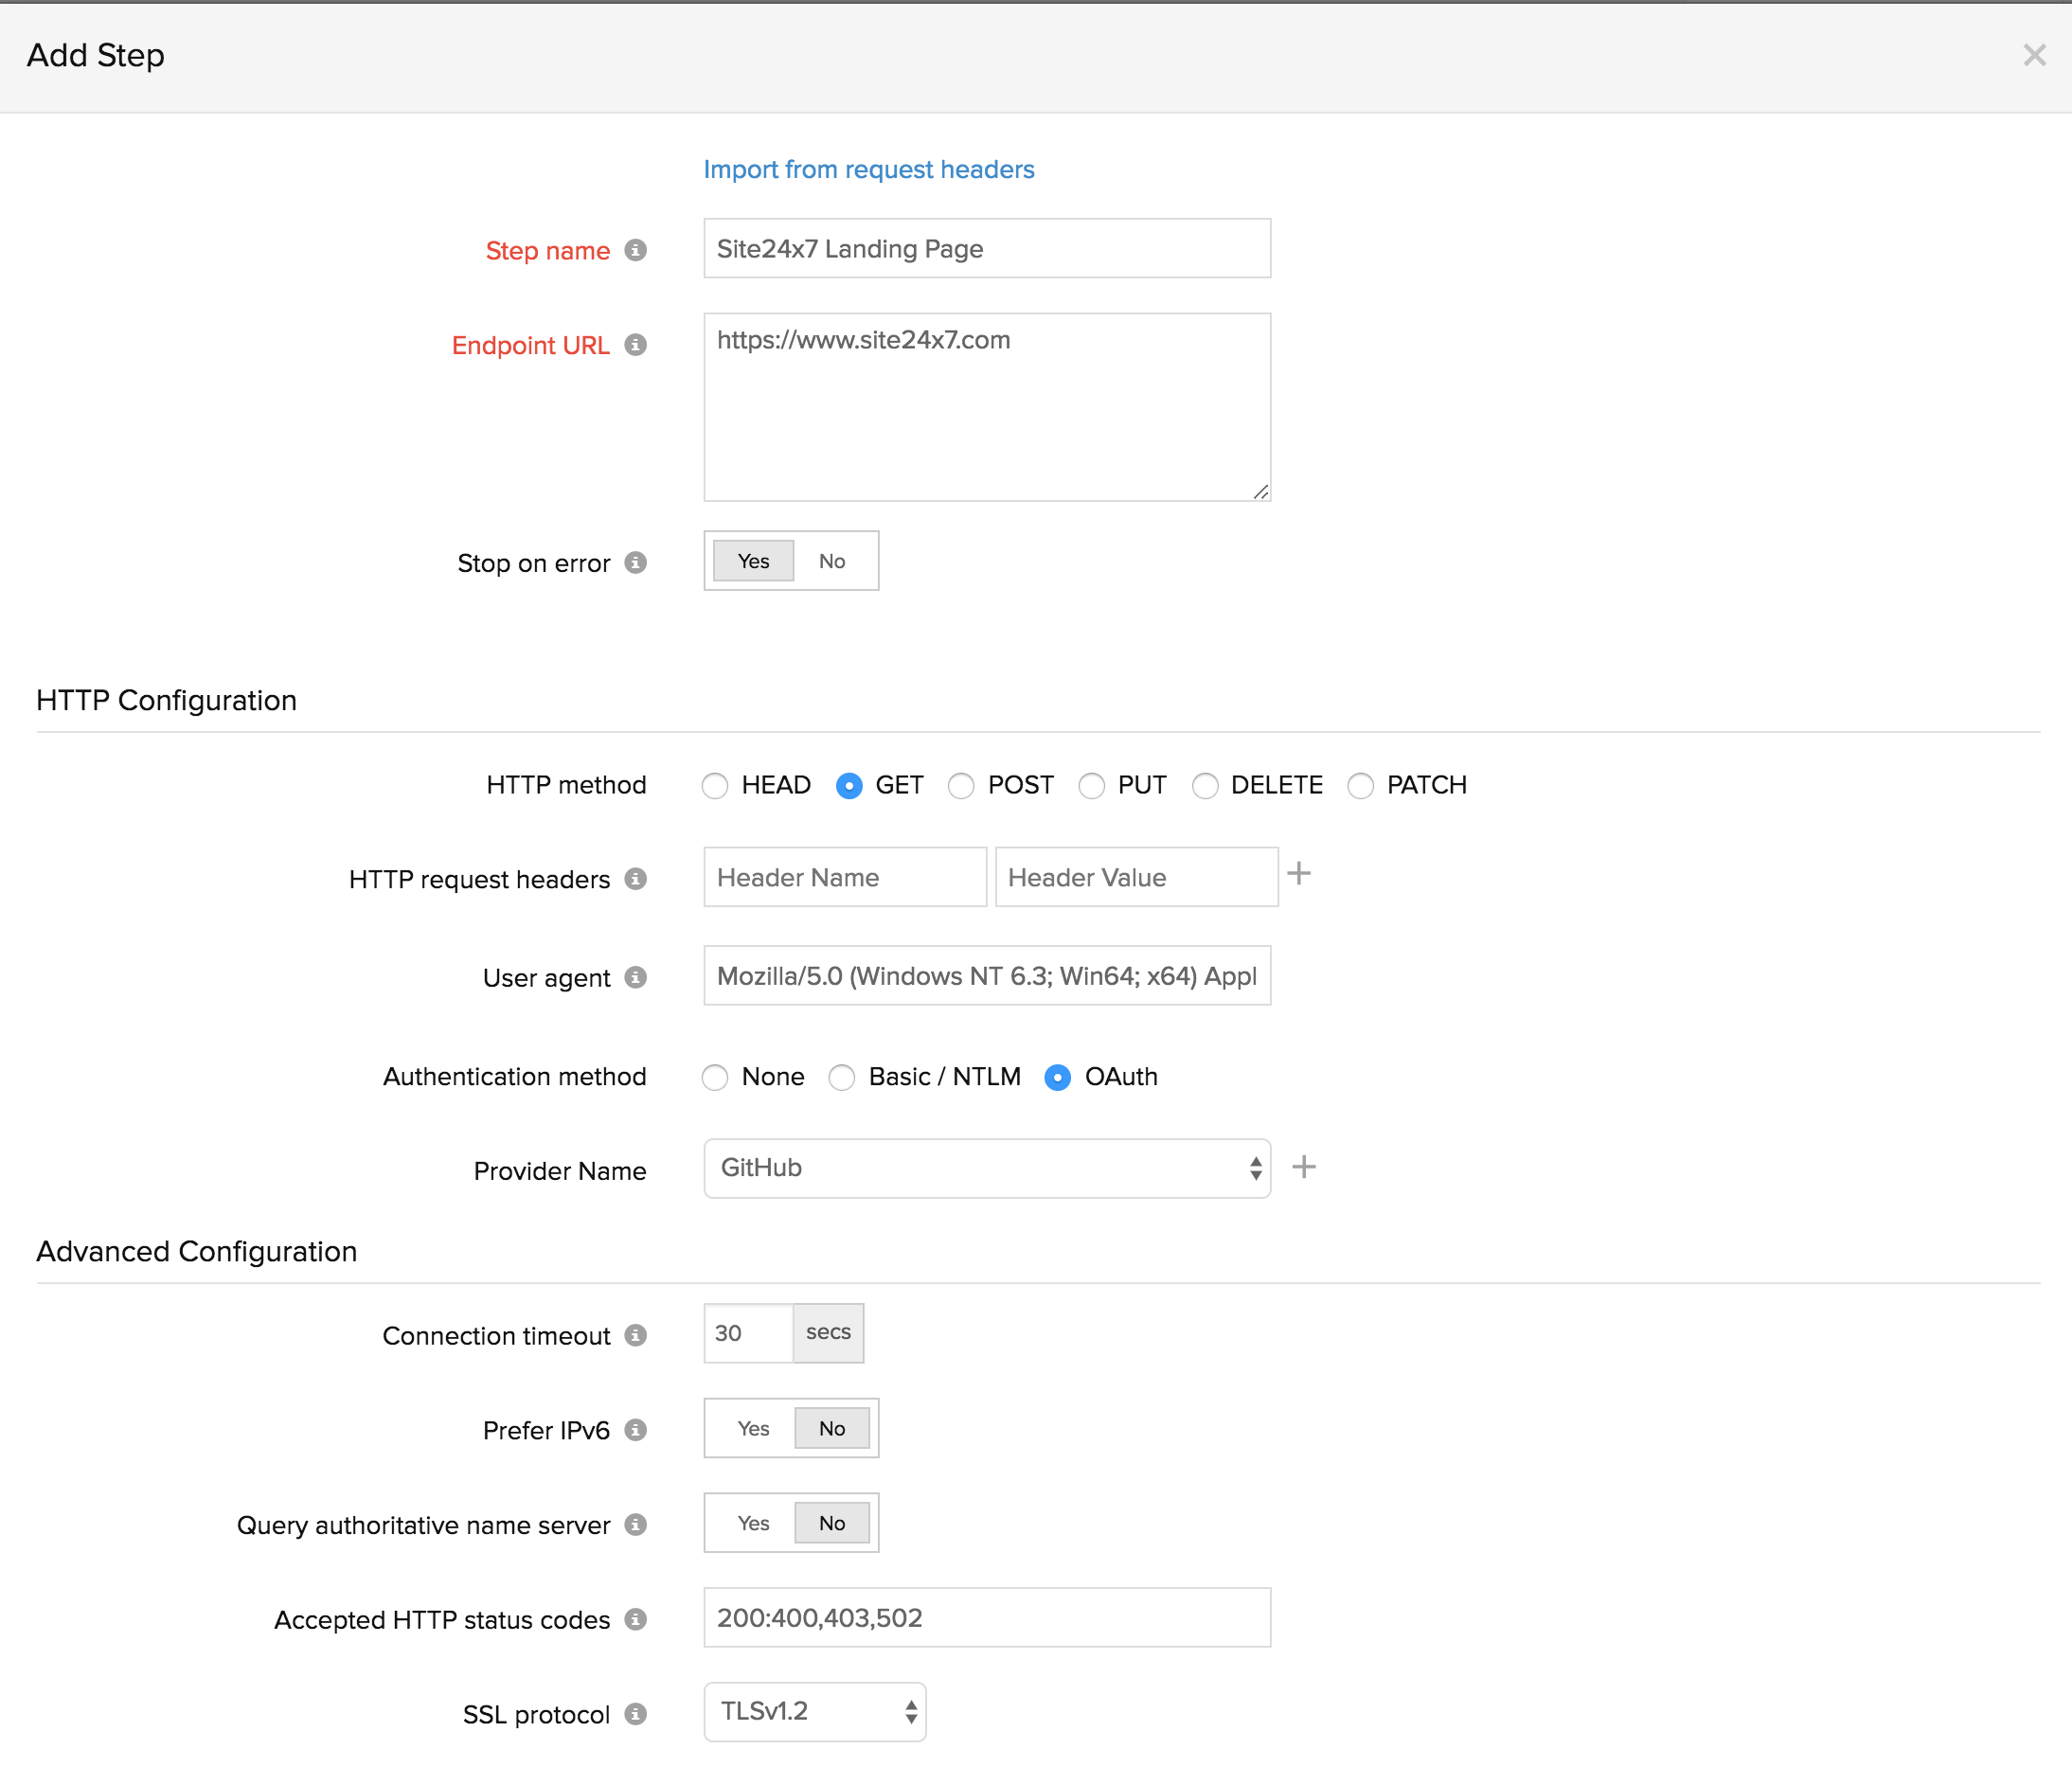
Step-based monitoring for testing the availability of chained web applications.
Mobile applications communicate primarily with REST API calls, and may use HTML web pages in-between for login. Thus, these workflows usually have multiple API calls--all chained together. Our REST API Transaction monitor lets you create a typical chain sequence, wherein multiple API calls are chained together into a single monitor. You'll be able to setup and monitor up to 25 chained transactions in the same way it operates, directly from the Site24x7 web client without the overhead of any transaction recorder. Another important characteristic of the monitor is its ability to create new transaction step by cloning an existing step. Once cloned, you can manually fine-tune the cloned step with the correct parameter values. If you wish to rearrange the order of operation, you can move the transaction steps up and down to meet your requirement.
Since the entire sequence of steps is executed in the same HTTP session, authentication cookies or other cookie data set by the application will also be persisted throughout the session. Additionally, the entire monitoring can be executed at a minimum check frequency of 10 minutes. The end-results of each transaction step can be validated with the same checks we use for website and REST API monitoring today.
Parameter forwarding to test how one API response is utilized in a successive API call.
In most cases, the availability of your application depends on a successive chain of API calls. Response fetched from one API may be a critical input for your subsequent API call to another API. If the first API call fails, the subsequent API call will not return a valid response. Let's take an example where the parameter forwarding feature in REST API Transaction monitor can be used to fetch the token from the Auth service. You can pass the token to other services as a part of the same monitor configuration. Response values can be extracted from XML, JSON or Text based input using XPath, JSONPath or Regular expressions and saved as custom parameters. These expressions can be invoked using the operation ${Parameter} in the request URL, HTTP configuration steps, or content check input fields of successive transactions. This way you'll be able to test scenarios wherein any data, including the authentication token generated in the first API call gets utilized to trigger a subsequent API call and so on.

Smart Configuration for quick set-up.
Smart configuration is an intelligent feature inside the monitor that lets you automatically populate the form fields like Endpoint URL, and header parameters during the transaction step set-up. It helps you avoid a manual set-up of a transaction step and expedites the monitor setup by fine-tuning your API requests with the right header resources. To achieve this, you have to extract request headers using your web browser developer tools, and paste your copied request headers in the "Import from request headers" field. The RAW request headers will automatically get used up in the relevant URL and parameter fields.

Test real and advanced CRUD sequences in production.
With Site24x7 you're able to measure multiple aspects of your HTTP CRUD operations in JSON, Text, XML, and Form based input. You can perform corresponding HTTP operations of GET, PUT, POST, DELETE, HEAD, and PATCH to test actual CRUD sequences in production. Additionally, APIs secured using Basic/NTLM, Client Certificates or OAuth can also be monitored.
End user experience is a critical aspect of your API performance. Site24x7 gives you the flexibility to monitor the availability of your chained API endpoints from 80+ global monitoring locations or from within your network. With our comprehensive reports, you can identify bottlenecks in response time and transaction time from all your configured locations. In addition, you can also detect SLA violations of your third-party APIs.
Set up alerts based on content checks and threshold violations.
Alerting is a core feature in every Site24x7 monitor. Using our advanced content check engine, you can validate content and detect mutilations in your Text, JSON or XML based data input. You must define custom Regex, XPath or JSONPath expression assertions to validate these responses. Additionally, you can provide advanced strategies and conditions to define threshold settings for your monitor's child attributes. Based on your alert settings and the alerting media defined by you, Trouble / Down Alerts will be automatically sent to you whenever a breach is sensed.
Now if you wish to get notified via your preferred third-party application, you can receive incident messages and root cause reports in your preferred third-party apps; we integrate with a number of third-party applications like Slack, HipChat, PagerDuty, Zapier, ManageEngine Service Desk Plus, SDP On-Demand, AlarmsOne or even via webhooks.
A must-have tool for DevOps and QA.
In today's world, applications are bound to have frequent updates and enhancements. This brings up the need to test APIs for backward compatibility checks. Using our tool, a Developer can constantly test and monitor production APIs and third-party APIs that the team relies on. Operation engineers can spot and resolve issues in the production APIs. QA engineers can detect the root cause of reported bugs and run continuous tests to find issues faster. Our REST API Transaction monitor is listed as a Basic Monitor for licensing. You can refer our API documentation to learn how to set-up the monitor remotely.
What's in the pipeline?
To bring out the best API monitoring experience to you, our developers are putting in a lot of effort in making discovery and debugging API issues faster. We'll be rolling out a slew of new updates to this feature such as:
- Quick monitor setup by offering support for Swagger definition, Postman and HTTP Archive (HAR) format
- JSON Schema Validation
Until then, share your valuable feedback to help us improve the product and offer you the best monitoring experience.
Hello Folks,
We understand that today's developers increasingly depend on many third-party API tools to ensure the optimal performance of their critical APIs. As promised earlier, we want to offer support for all those tools at the earliest.
Support for Swagger Definition and HAR
We're delighted to announce that we now provide support for HTTP Archive (HAR) and Swagger (Open API Specification) definitions in REST API Transaction Monitor. With this rollout, you can expedite the entire monitor creation process via quick import of Swagger and HAR files (only JSON format supported). It will allow you to import up to 25 API endpoints from these data in a matter-of-seconds, which you can then monitor after the set-up.

Read our user documentation to learn more about Swagger and HAR import.
We've released one more enhancement and this feature will allow you to easily validate your HTTP responses in JSON against a predefined JSON Schema. JSON Schema is a vocabulary that allows you to annotate and validate all JSON endpoints for your web service. Once a JSON Schema Validation fails, you get alerted based on the severity selected in the configuration form.
Common use cases tested during the JSON Schema validation are:
- Verifying whether values are of a certain type (e.g. integer, string, etc.)
- Ensuring the API JSON responses are structured properly
- Checking for the existence of the required keys in the JSON response
- Test whether an incorrect HTTP response (like an HTML or XML) validates against your given JSON schema.
JSON Schema validation is also released for the REST API Monitor. Let us know all your valuable feedback in the comments section.
Thanks,
Abhiram