Hi Support,
As a process monitors can be grouped aligned to the Business Service or Product. With the configuration of Threshold configuration we can setup the notification for Trouble / Critical violations but that will not be the same as there will be lag of 3 minutes or 5 minutes etc. as per configuration. This will not provide us to review the Total Violations in the specific period could be Daily/Weekly/Monthly associated with Monitor Groups/Business Services. This will only send notification once the violation has happened.
Requirement is to analyse the Total Events against any monitor within Monitor Group. Trouble & Critical Escalation report for the Monitor Group.
I hope this will be helpful for the community and is one of the key aspect of Monitoring & Event Management Process.
Thanks,
Munish
Dear Munish,
Your question is a little unclear. I assume you have set thresholds for your servers. Do you want to check the events that happen for any monitor in a monitor group in chronological order? Or are you asking for instant instant alert when the threshold violation occurs? Based on this we'll be able to understand better and guide you.
-Jasper
PM Site24x7
Hi Jasper,
Thanks for the response.
I am looking forward to schedule the reports of Daily/Weekly/Monthly Events configured for all the monitors added to the monitoring groups. This is to analyze the Events triggered for short duration as if our poll frequency is configured for 4 Minutes and Alert duration is for 1.5 Minutes then it will not trigger any notification, whereas we want to track the followings:
- Track total events for the Business Service / Product as we have created monitoring groups accordingly
- Track the Warning/Trouble Alerts created as the %age of Total Events
- Track the Critical alerts generated as the %age of Total Events
Hope I am able to clarify the requirement.
Thanks
Dear Munish,
Thanks for elaborating your points further more. We have a beta feature that allows you to see some of this though scheduling is not available in it at the moment.
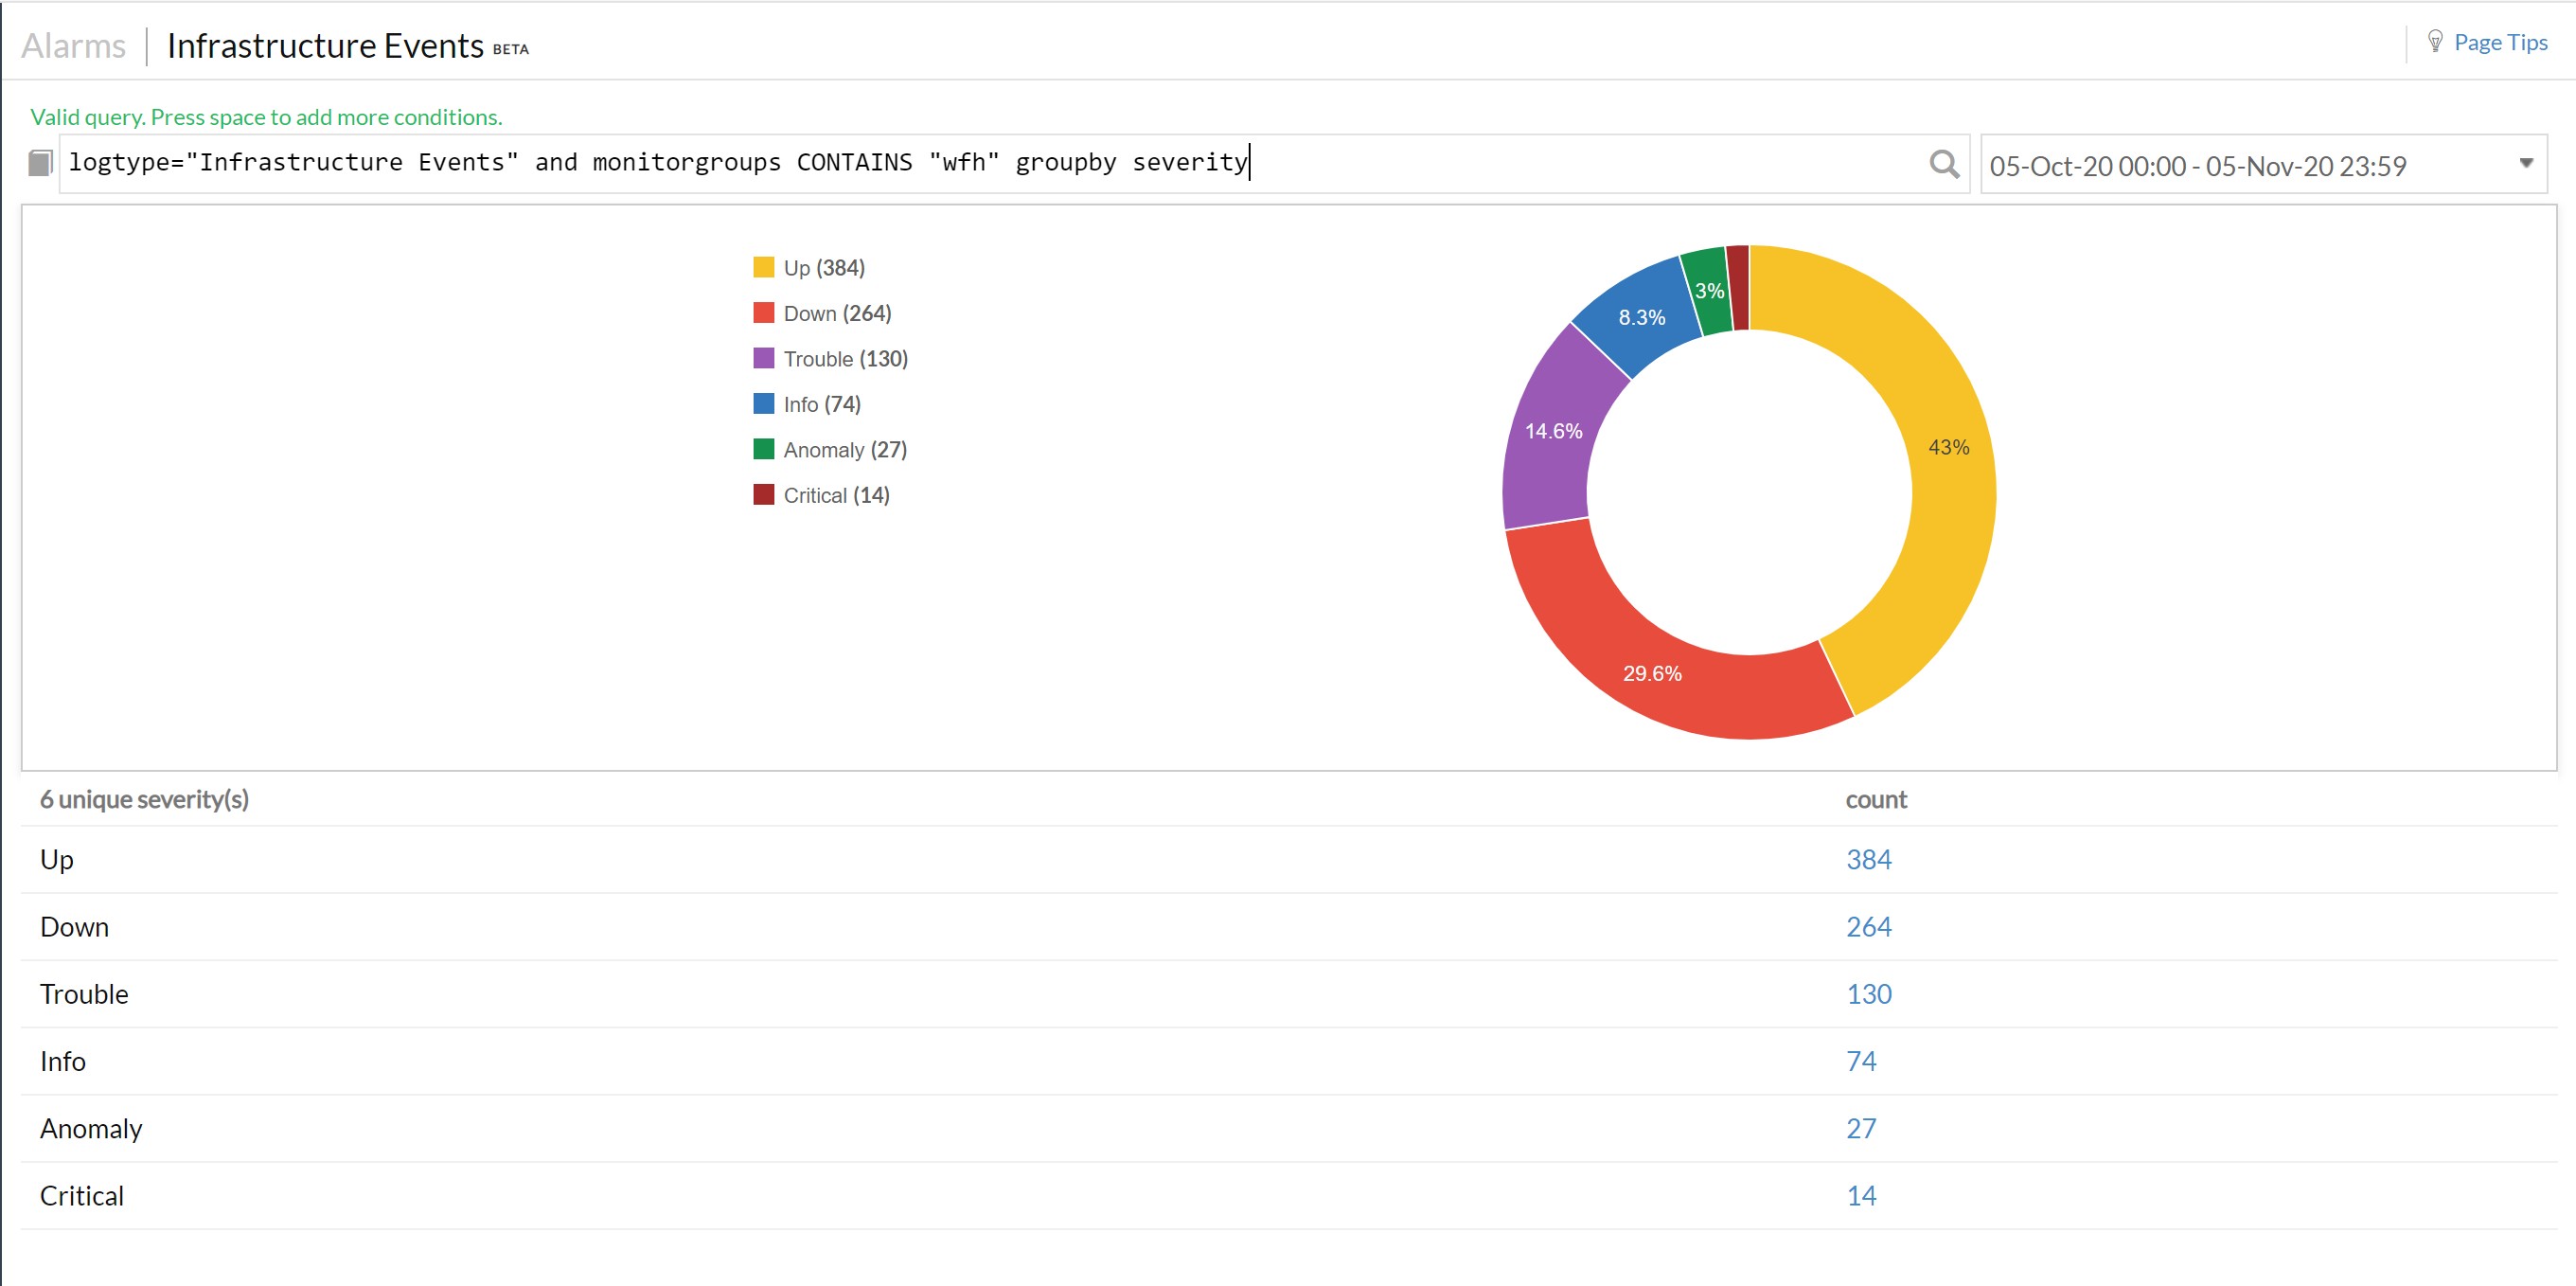
From the alarms tab > click on "Infrastructure Events" (Which is the first item) > from the time period selection select your desired duration (Data is currently supported for a maximum of 30 days). This will give you the events that happened in chronological order. You can then group them by severity so that you get the percentage value for each status (as shown in the donut chart).
Below is a screenshot of the wfh group that I have and grouped by severity.
If you want to filter the events based on particular severity you can create a query as follows
logtype="Infrastructure Events" and monitorgroups CONTAINS "wfh" and (severity CONTAINS "Trouble" or severity CONTAINS "Critical")
Here you'll get the events as shown below
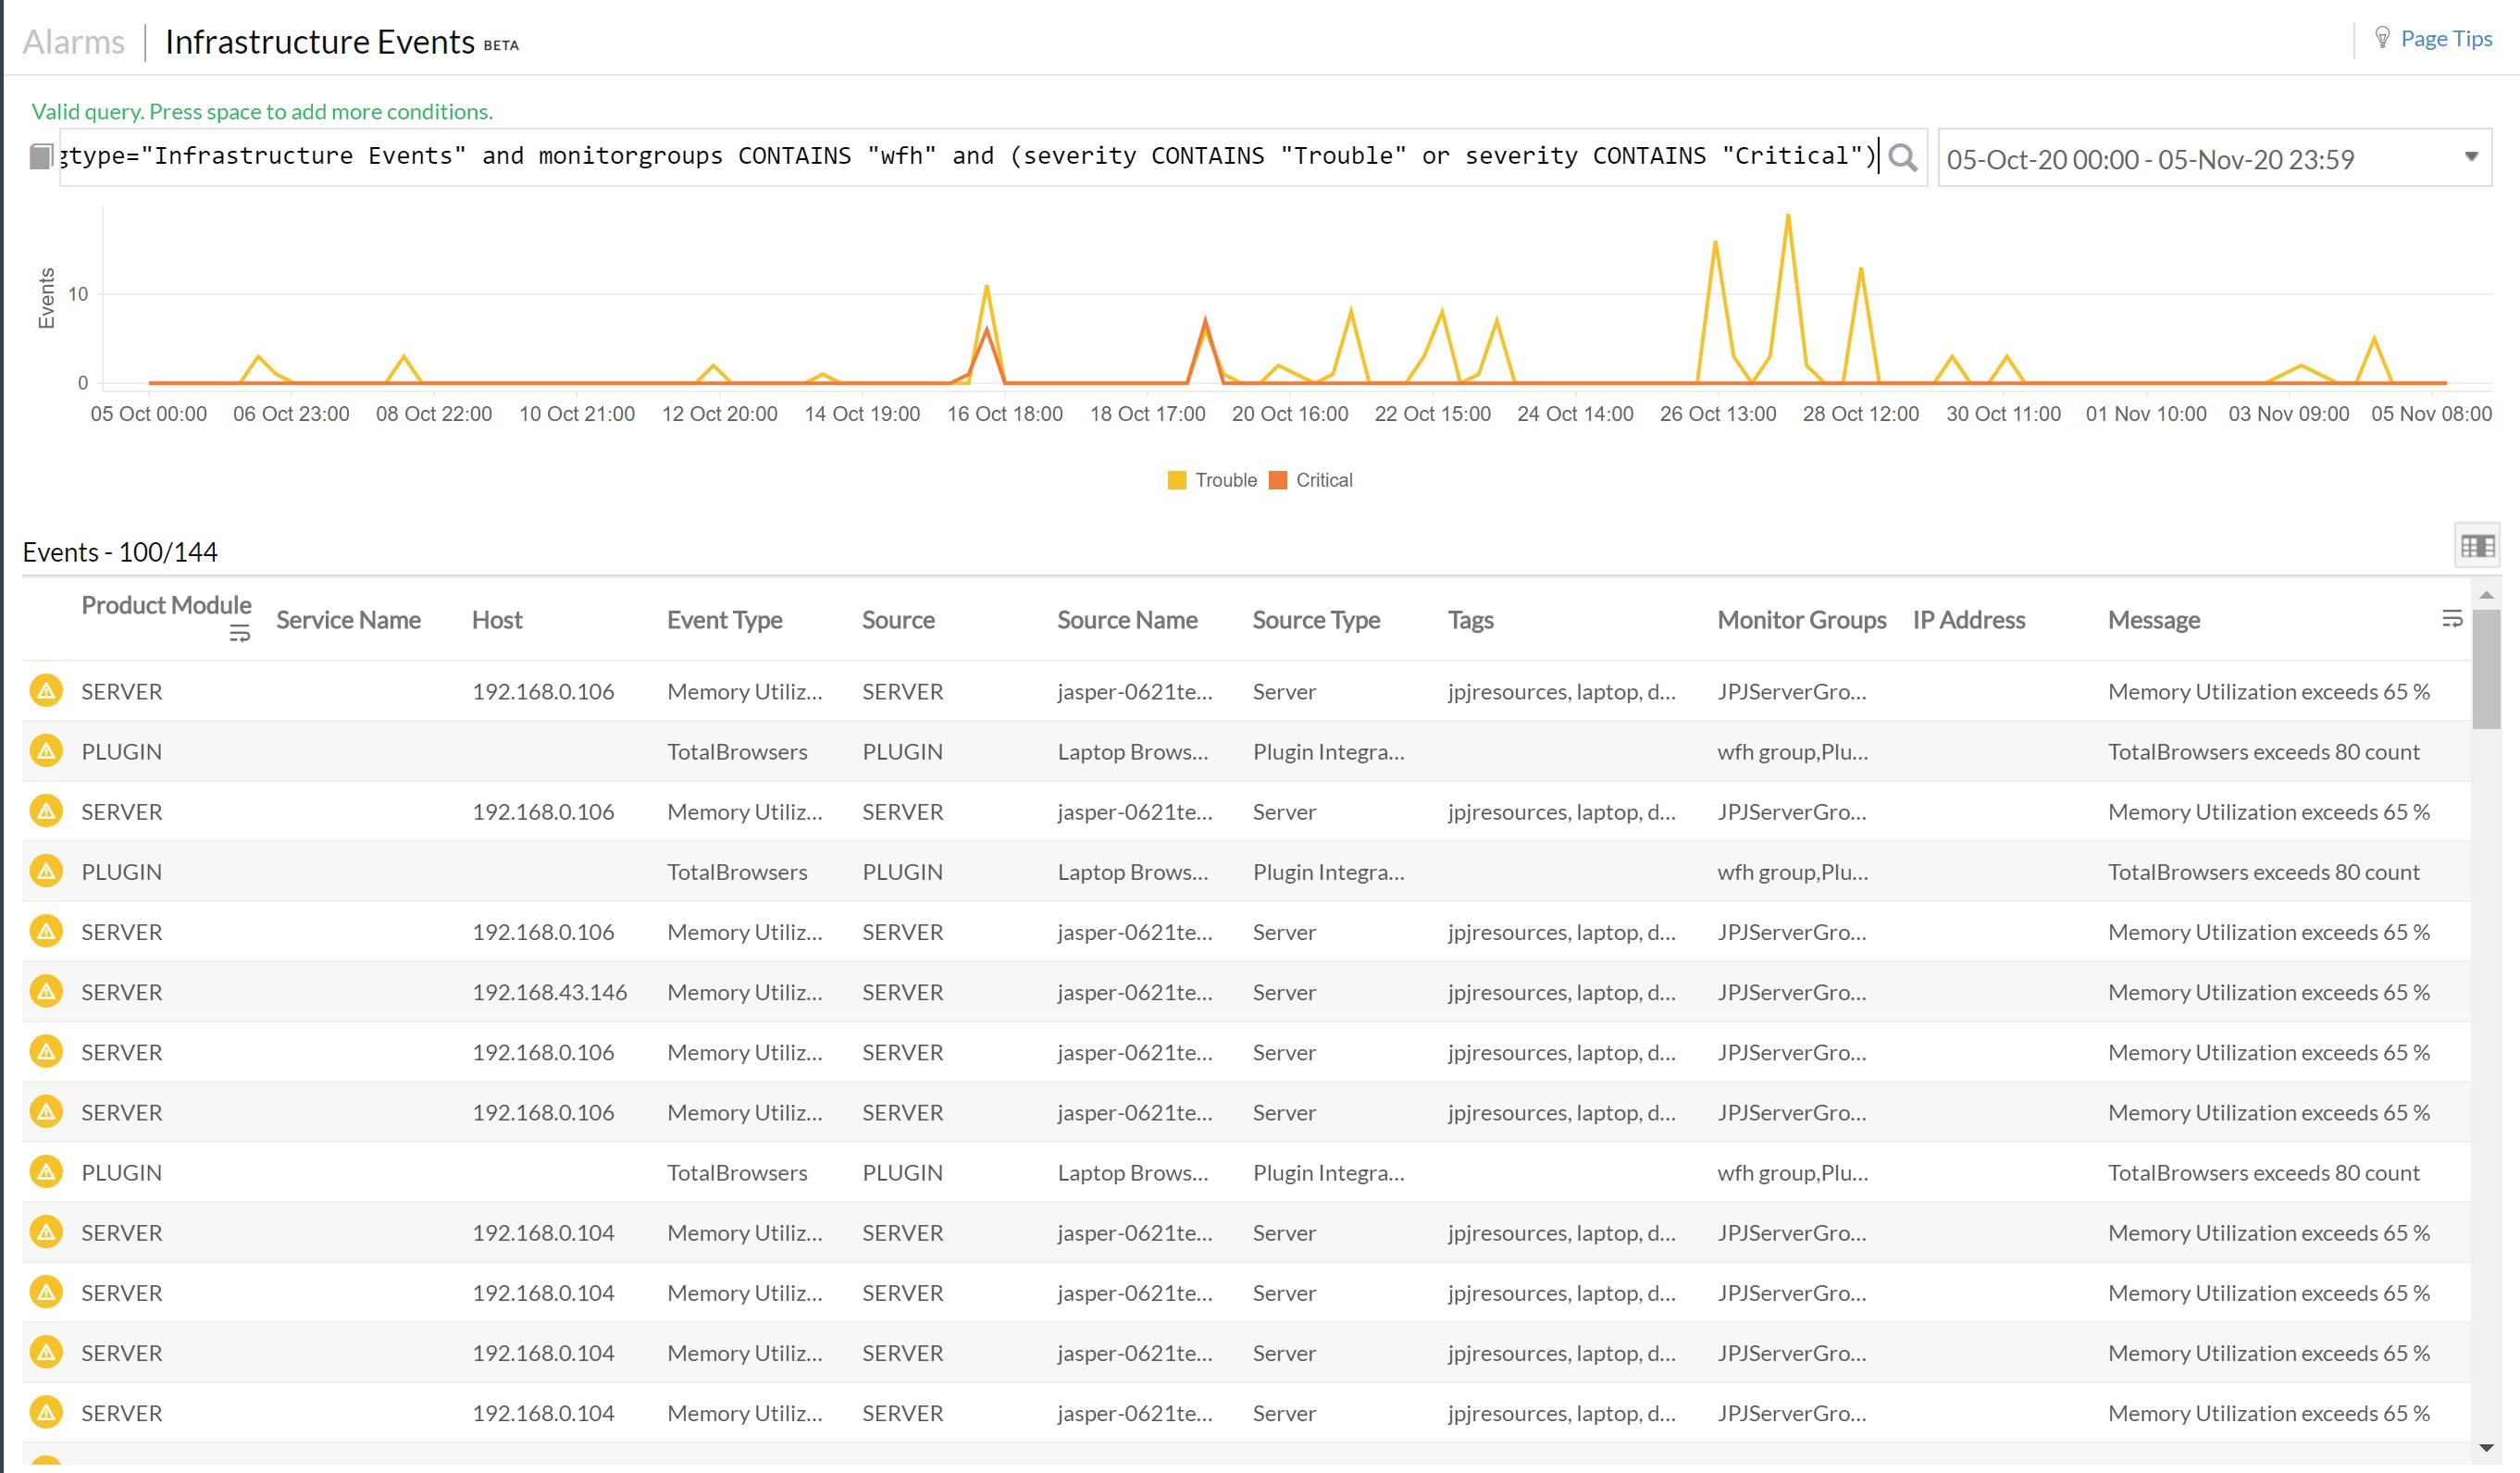
You can filter them with additional query and also group them by any column. Try it out and let us know if it helps.
-Jasper
PM Site24x7
Hi Jasper,
I already explored the same but the requirement is to get the same in through scheduled report otherwise it is going to be overhead. Moreover export in CSV would be further helpful to analyze the same.
Also it would be helpful if you could confirm the retention of the events by site 24x7 to fetch the same on monthly basis.
Is there any roadmap to get this scheduled.
Thanks,
Munish
Dear Munish,
We have released the Capacity Planning beta feature, which provides the analytical data for a group of monitors, and is used to determine the capacity required to optimize your resources for a particular operation or workload.
For instance, if you have a monitor group with 10 servers, you can group all of the servers into one capacity planning and monitor them. Capacity Planning captures all the events from those server monitors based on the frequency provided, consider 15 minutes.
Let's assume a scenario where, Server1 displays TROUBLE status twice, Server4 displays CRITICAL and TROUBLE status once and Server5 is in DOWN status.
Here, there are 3 TROUBLE events, 1 CRITICAL event and 1 DOWN event that are captured in the Capacity Planning. You can use these event metrics and generate a custom report. We can also trigger alerts for those events. A Root Cause Analysis (RCA) will be generated for every alert and you can view the detailed Outage history of those Servers and analyze the cause in the RCA. Additionally, you can also view the required capacity planning metrics.
Best,
-The Site24x7 team!