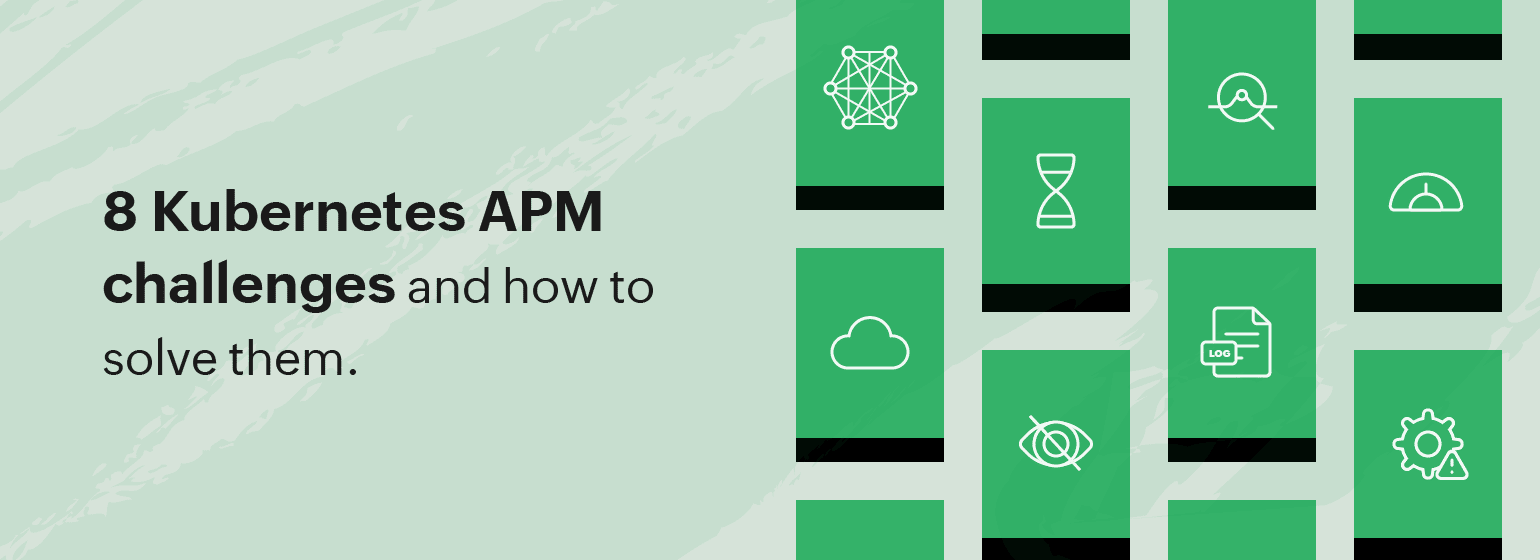
8 Kubernetes application performance monitoring challenges and how to solve them
Kubernetes is a widely-adopted platform that manages the containers that host an application. Instead of handling nodes and containers individually, it groups all workloads as orchestrated layers. This abstraction simplifies the overall complexities involved, making the application easier to manage.
While Kubernetes is efficient in optimizing usage by creating and destroying containers, it doesn't provide specific details on how the orchestration functions or reveal how service requests flow across microservices. And at the application level, there is a lack of adequate data to enable root cause analysis (RCA). Kubernetes also doesn't provide performance data, request rate, errors, latency, and other metrics by default, all of which are essential for monitoring application health.
Although public cloud distributions have adequate security features to plug and play applications as Kubernetes deployments, comprehensive monitoring is essential for DevOps teams to achieve complete application observability.
Monitoring your Kubernetes application performance isn't always a straightforward job. Here are the top eight challenges faced:
- Container complexity: Containers are aggregated units of data with associated metadata, which comes with observability challenges. Some of the questions that IT managers grapple with are: "What's running in my cluster?" and "Are all components running as expected?" and "If not, what data-led insights do I have to act on?"
- Cloud challenges: Containers may also be spread across different cloud deployments, such as Google Kubernetes Engine (GKE) and Amazon Kubernetes Service (AKS), bringing in interoperability challenges. The key interoperability challenge lies in gathering monitoring data to ensure all clusters across your multi-cloud or hybrid-cloud environment work as intended.
- Ephemeral components: Pods, containers, and tasks in Kubernetes are created, destroyed, and dynamically auto-scaled through automation actions, making it difficult to monitor them comprehensively.
- Limited observability: Monitoring within Kubernetes is limited by the system's capabilities, making it difficult to gather insights about the inner workings of a pod or a container in real time. As containers are spawned, destroyed, and created again at rapid pace, maintaining a grip on these deployments becomes the proverbial search for a needle in a haystack unless you have instant and actionable insights. A comprehensive observability solution should provide support to collect exhaustive metrics, distributed traces, and detailed logs in order to stay in control of your Kubernetes deployments.
- Tracing challenges: The way Kubernetes applications interact with myriad microservices makes it inherently difficult to track issues and perform RCA. Comprehensive monitoring bridges this gap by providing insights into the behavior of each service and their chain of interactions. Due to the dynamic nature of pods, it can be difficult to trace and debug the exact location of an error. Only a monitoring solution capable of tracing the entire transaction path can pinpoint exactly where a failure occurred, along with providing details about the sequence of events leading up to the point of failure.
- Lack of native Kubernetes logging: Kubernetes lacks native support for cluster-level logging, creating the need for observability platforms. Though container logs are stored locally, they don't carry important Kubernetes metadata, which further leads to inadequate logging information for DevOps teams as they troubleshoot issues. Also, because Kubernetes nodes are temporary, the logs from containerized applications tend to be unstable or go missing as pods destruct or move to a different node, leading to logging chaos.
- Understanding resource utilization: As Kubernetes resources dynamically scale up or down based on application load, it becomes important to track resource utilization continuously. Kubernetes monitoring keeps a constant check on resource utilization metrics, such as CPU and memory saturation across the cluster and within applications. Monitoring thus helps identify bottlenecks and optimize resource use.
- Misconfiguration and network connectivity issues: There are a variety of things that can cause your Kubernetes services and resources to stop reporting at any time, from misconfiguration of core components to network connectivity issues.
To overcome these challenges, organizations need more than Kubernetes metrics to monitor their applications on Kubernetes environments. A dedicated Kubernetes monitoring tool can cut through the complexities and work seamlessly as an application scales, streaming real-time monitoring data on to customizable dashboards with actionable insights.
The need for a unified observability platform
The very dynamic nature of Kubernetes makes observability an inherent challenge. Gathering meaningful monitoring data from various Kubernetes components, as well as the ability to cross-reference monitoring data to make meaningful inferences, is a demanding task, even for those trained in managing Kubernetes.
An ideal observability platform for monitoring Kubernetes applications must have:
Comprehensive monitoring: Kubernetes monitoring works only if you achieve comprehensive visibility into the functioning of both your container infrastructure across your clusters, nodes, pods, and containers while not losing sight of the performance of the application that runs on Kubernetes.
Observability-led troubleshooting: Since Kubernetes deployments are dynamic and temporary, you also need an observability solution that can collect logs from across your application and related microservices, store them, and make them instantly available to aid your DevOps professionals. A comprehensive logging solution for Kubernetes deployments helps you recover from failures faster to meet SLAs and ensure customer delight.
Distributed tracing: Distributed tracing is the process of connecting the traces of multiple services or applications involved in fulfilling a user request to form a unified context. A comprehensive observability tool such as Site24x7 lets you focus on your business workflow in its entirety. Rather than just analyzing your application or service in silos, you'll get the big picture.
Better together: Site24x7 and your Kubernetes apps
In an industry that thrives on speed, a unified, all-encompassing IT observability tool like Site24x7 is a natural monitoring partner for your Kubernetes-run applications. However, many open-source tools like Prometheus lack Site24x7's comprehensive reach, being limited by their restricted granularity, performance lags in discovery, security vulnerabilities, and a general inability to monitor across generations of IT systems. Site24x7 can monitor your Kubernetes applications deployed on any cloud platform such as Amazon EKS, GKE, or AKS, and also your on-premises installations, making it a comprehensive monitoring platform that spans your entire IT stack.
When your Kubernetes applications scale up, Site24x7's IT Automation organically responds by auto-scaling its agents based on your requirements. And when your application scales down, Site24x7 correspondingly suspends the use of resources to reduce wastage. Through auto-scaling, Site24x7 ensures continuous visibility into your Kubernetes resources at any time while avoiding high cost overruns.
Site24x7 comes loaded with auto-resolving capabilities and can generate detailed, customizable reports to aid troubleshooting and management decision-making. It also provides a variety of plugin integrations to monitor all elements that affect your business, even allowing you to write plugin integrations specific to your needs. Site24x7 provides comprehensive, full-stack observability with its extensive support for the entire IT stack, with unified container visibility that covers multi-cluster Kubernetes deployments.
The log management module of Site24x7, AppLogs, supports the centralized collection of logs via API endpoints and manages of over 100 log types including Kubernetes audit logs. Logs become easily accessible through simple query language searches, enabling faster troubleshooting from a single dashboard.
With exhaustive and customizable dashboards, reports, alarms, and more, and backed by premium human support, Site24x7 is the monitoring tool of choice for thousands of DevOps and IT teams. Find out why.
Comments (0)