Discover all devices at ease
Discover network devices from any vendor—including Cisco, Adtran, HP, and Fortinet—and simply add them for monitoring. We also provide thousands of SNMP device templates for auto-association along with performance metrics, avoiding the need to manually configure attributes.

Processed trap alerts for unprecedented issues
Configure network devices to send SNMP traps to Site24x7, and receive processed trap messages and alert notifications for any trap defined in your SNMP MIB. You can view traps from multiple devices and locations in one place. Correlate different trap messages with device performance for deep insights.

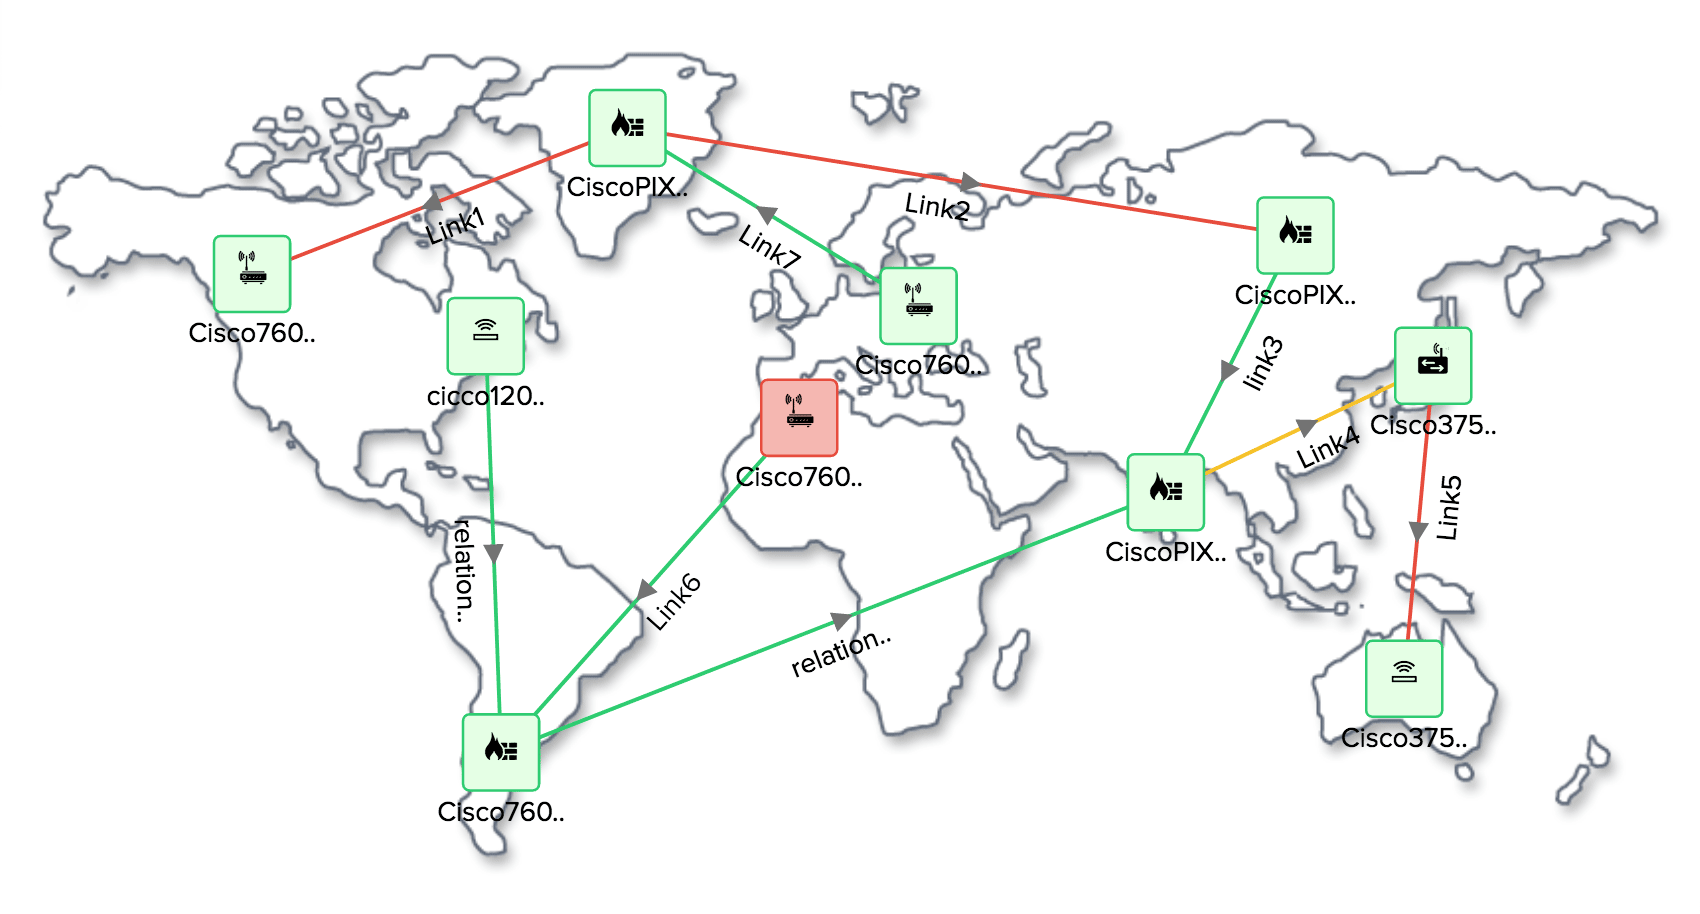
Health, performance, and fault management
Obtain a glimpse of your network hierarchy, connections, and their statuses directly from network topology and layer 2 maps. Also, view top devices based on response time and packet loss; and top interfaces based on traffic, bandwidth utilization, errors, and discards from the network health dashboard.
Network performance reports
Use the health trend report to keep yourself updated on your network's health trend over a period and the performance report to check network performance. Also, the top N network devices by response time and packet loss reports allow you to analyze critical attributes. You can also use inventory reports or create custom reports based on your needs.

Notify on-call operators
Receive alerts about network activity from your choice of email, SMS, phone call, or push notifications to notify on-call operators. And with so many monitoring tools available, you can receive alerts on integrated applications, including ManageEngine's Alarms One and ServiceDesk Plus, as well as third-party applications like Microsoft Teams, Slack, PagerDuty, and Jira.
