Identify and eliminate bottlenecks in your application for optimized performance.
Node.js powers some of the most heavily trafficked applications on the web, yet its single-threaded architecture means that scaling requires deliberate planning. Whether your application serves thousands of API requests per minute or handles real-time WebSocket connections, understanding how to scale Node.js effectively is critical to maintaining performance under load.
Scalability refers to an application's ability to handle growing workloads gracefully. When demand increases, a well-architected Node.js application should expand to accommodate traffic. When demand subsides, it should release unused resources to reduce costs. This article covers the proven strategies, tools, and best practices for scaling Node.js applications in production, from clustering and worker threads to containerization and load balancing.
There are two fundamental approaches to scaling any application: vertical scaling (adding more CPU, RAM, or storage to a single server) and horizontal scaling (distributing the workload across multiple servers or processes). While vertical scaling is simpler to implement, it eventually hits hardware limits and rising costs. Horizontal scaling is the preferred approach for most production Node.js deployments.
A key challenge when horizontally scaling is ensuring even load distribution. When traffic is unevenly spread across instances, some may be idle while others struggle, leading to unpredictable response times and degraded user experience.
The core challenge with Node.js is its single-threaded nature. By default, a Node.js process uses only one CPU core, even on machines with multiple cores. Most cloud computing instances provide multi-core processors, which means a default Node.js deployment leaves significant processing power unused.
Node.js provides built-in solutions for this limitation. You can horizontally scale through the native cluster module, process managers like PM2, or container orchestration platforms such as Kubernetes. Each approach distributes incoming requests across multiple processes or servers, enabling your application to handle significantly higher traffic volumes.
Node.js is single-threaded by default, but you can leverage the built-in cluster module to spawn multiple worker processes that share the same server port. Alternatively, a process manager like PM2 can automate clustering with minimal configuration. Both approaches allow your application to utilize all available CPU cores.
The Node.js cluster module allows you to create child processes (workers) that share the same server port. Each worker runs its own instance of the event loop on a separate CPU core, so if one worker crashes or becomes overloaded, the remaining workers continue handling requests.
When a clustered application starts, the primary process forks worker processes equal to the number of available CPU cores. The cluster module includes an embedded round-robin load balancer that distributes incoming connections across workers, making it straightforward to multiply your application's request-handling capacity.
First, build a simple Node.js server that processes some heavy requests without using clustering. This example executes a default, single-thread Node.js server. Save the following lines of code to a file named index.js:
const express = require("express")
const app = express();

app.get("/heavytask", (req, res) =>{
    let counter = 0;
   while (counter<9000000000){
       counter ++;
    }
    res.end(`${counter} Iteration request completed`)
})

app.get("/ligttask", (req, res) =>{

   res.send("A simple HTTP request")

})

app.listen(3000, () => console.log("App listening on port 3000"))
Now run the application by executing node index.js.
Note that the first request iterates over a large number and will take considerably longer to run. In contrast, the second request returns a simple request. You can test both endpoints using Postman.
Sending a request to http://localhost:3000/heavytask blocks the application execution thread (Figure 1).
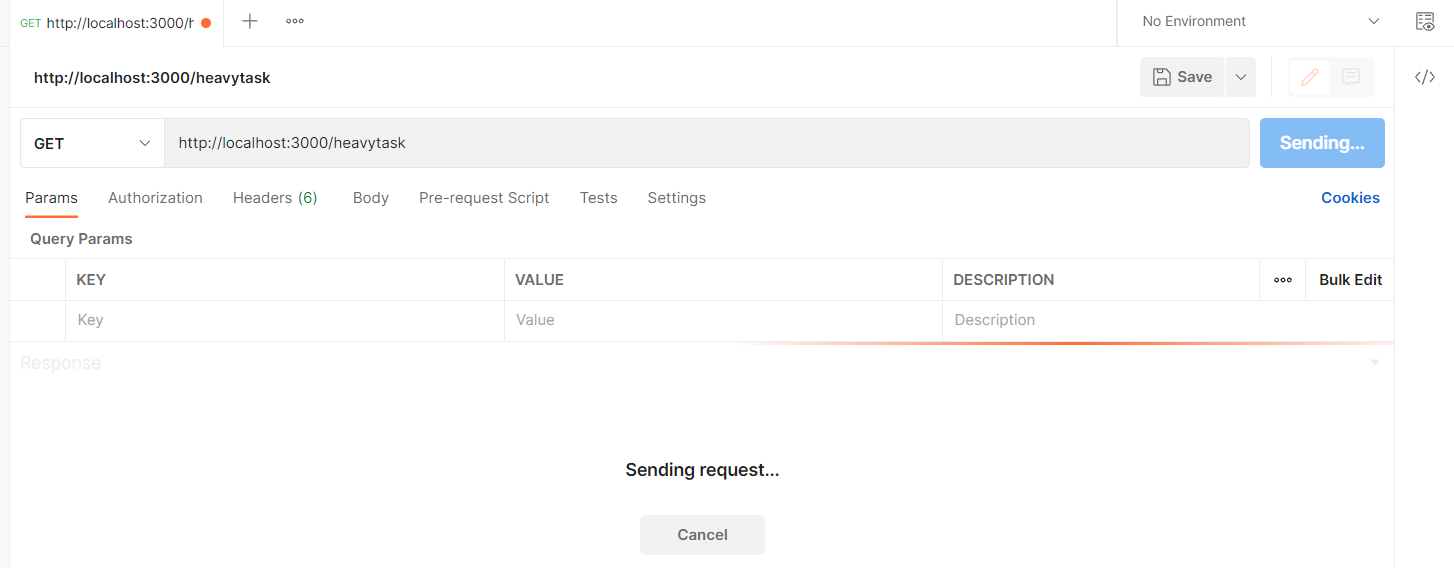 Fig. 1: The main thread is suspended, waiting for the request to be processed.
Now, sending a subsequent request to http://localhost:3000/ligttask won't return the expected response until the server finishes processing the first task and releases the CPU that handles both requests.
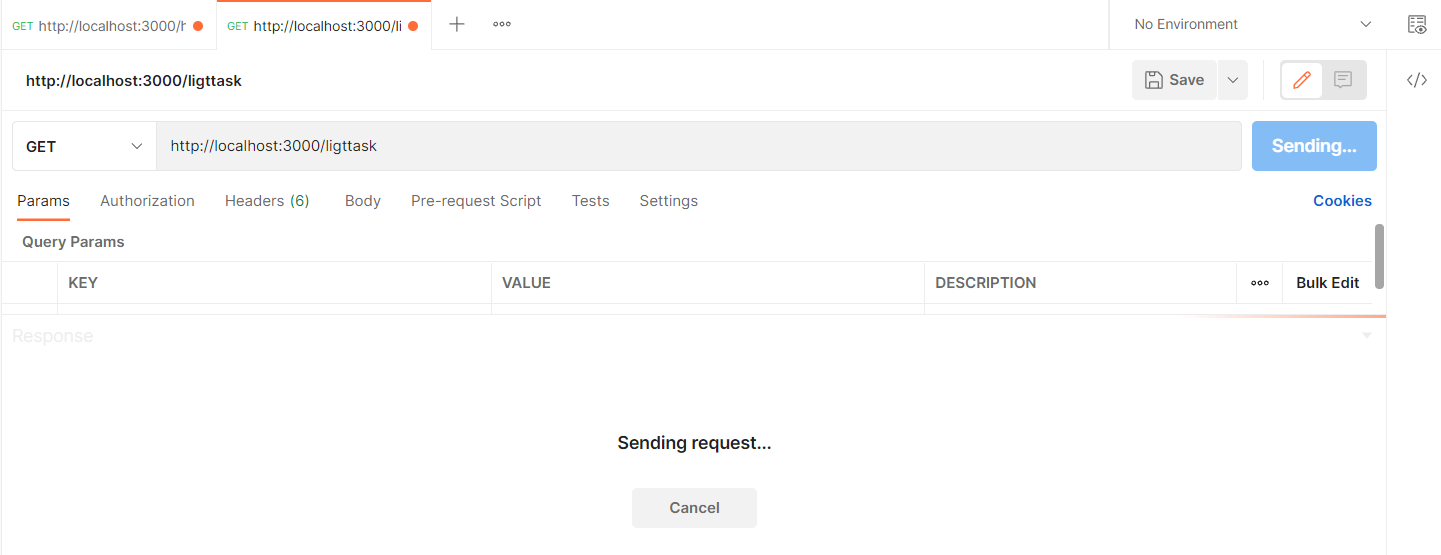 Fig. 2: Both requests are now waiting to be processed.
To solve this problem, modify your index.js file to use the cluster module as follows:
const express = require("express")
const cluster = require("cluster");
const os = require('os')

// check if the process is the master process
if(cluster.isMaster){
    // get the number of available CPU cores
    const CPUs = os.cpus().length;
    // fork worker processes for each available CPU core
   for(let i = 0; i< CPUs; i++){
      cluster.fork()
  }
   // The of the number of cores
    console.log(`Available CPUs: ${CPUs}`)

   cluster.on("online",(worker, code, signal) => {
       console.log(`worker ${worker.process.pid} is online`);
    });

}else{
    const app = express();
   // if the process is a worker process, listen for requests
   app.get("/heavytask", (req, res) =>{
       let counter = 0;
      while (counter<9000000000){
        counter ++;
     }      // Log the core that will execute this request
     process.send(`Heavy request ${process.pid}`)
     res.end(`${counter} Iteration request completed`)
 })

app.get("/ligttask", (req, res) =>{
    // Log the core that will execute this request
    process.send(`Light request ${process.pid}`)
    res.send("A simple HTTP request")
    })

app.listen(3000, () => {
    console.log(`worker process ${process.pid} is listening on port 3000`);
    });
 }
Now spin up the application again with node index.js. When testing the endpoint again, the light task will be executed immediately, and the heavy task will be handled by the core that has been assigned to it. The output in your terminal should be similar to the output shown in Figure 3.
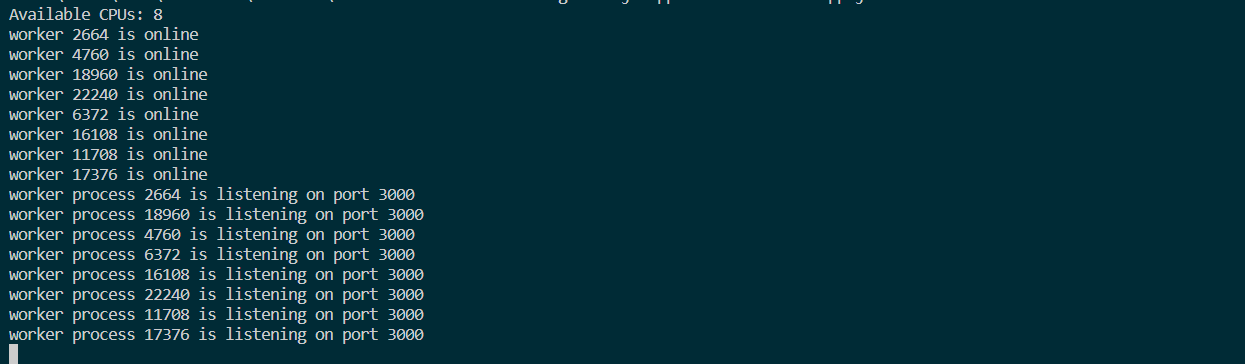 Fig. 3: Multiple cores handle multiple requests.
The PC used to write this post has 8 cores. They’re all mapped to the same port and ready to listen for connections. Each core runs Google’s V8 engine.
You can measure the benefits of using available cores. Assuming you have an application that should handle 10,000 requests from 100 users in production. Using the previous example, as an illustration, you can spawn the request to all available cores.
Rather than using the previous example, let’s replace it with a simple Node.js application:
const express = require("express")
const app = express();

app.get("/", (req, res) =>{

    res.send("A simple HTTP request")

})

app.listen(3000, () => console.log("App listening on port 3000"))
Boot up the application once again with node index.js. Then, run the following command to simulate a high workload with Autocannon. A sample run appears in Figure 4.
$ npx autocannon -c 100 -a 10000 http://localhost:3000/
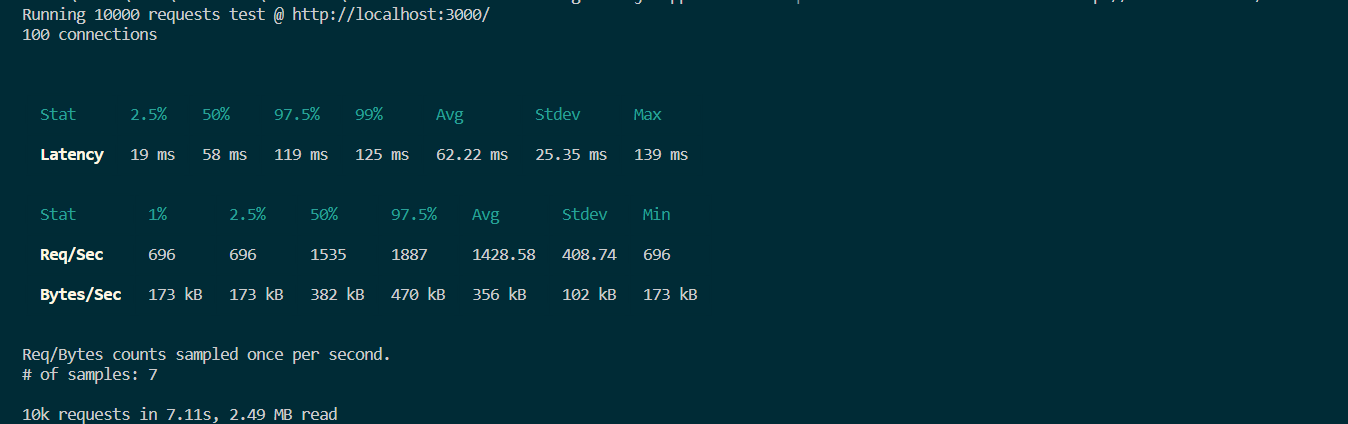 Fig. 4: Output from a sample single-core run.
It took about 7 seconds to execute 10,000 requests for this simple Node.js application. Let’s see whether there is any change when you use clustering on a 4-core computer.
The corresponding application uses the Node.js Cluster module follows. Figure 5 shows the output.
const express = require("express")
const cluster = require("cluster");
const os = require('os')

// check if the process is the master process
if(cluster.isMaster){
    // get the number of available CPU cores
    const CPUs = os.cpus().length;
    // fork worker processes for each available CPU cores
   for(let i = 0; i< CPUs; i++){
       cluster.fork()
    }

}else{
    const app = express();
    // if the process is a worker process listen for requests

   app.get("/", (req, res) =>{
       // Log the core that will execute this request

      res.send("A simple HTTP request")

 })

 app.listen(3000, () => {
      console.log(`worker process ${process.pid} is listening on port 3000`);
   });
}
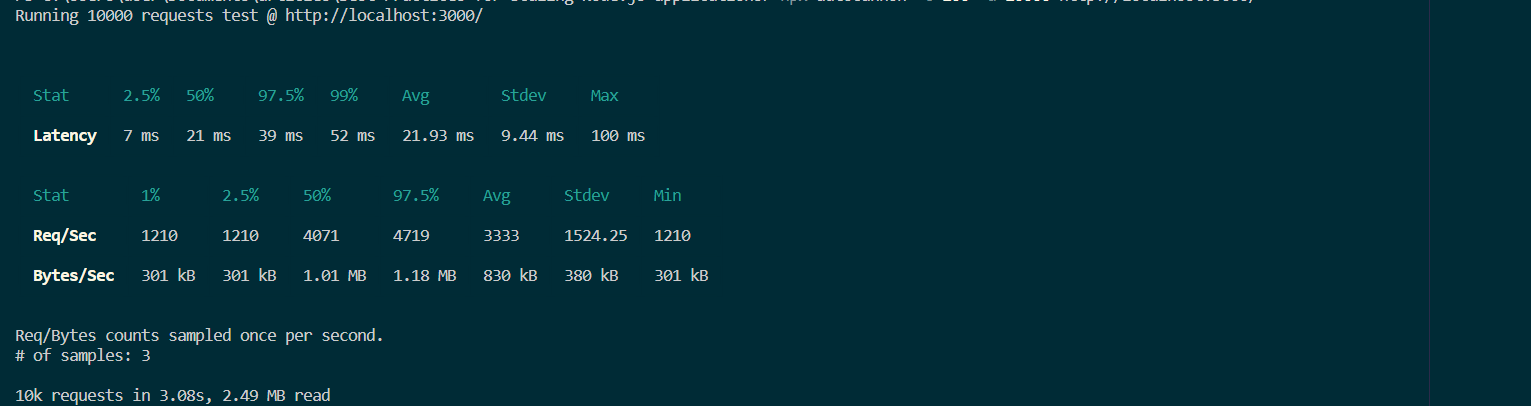 Fig. 5: Output from a sample multi-core run.
The example shows how 10,000 requests are handled in just 3 seconds. Native cluster mode can be configured in various ways, and getting started is simple and can provide quick performance gains.
PM2 is a production-grade process manager for Node.js that automates clustering. Unlike the native cluster module, PM2 handles worker spawning, process monitoring, log management, and automatic restarts without any additional code in your application.
With the native cluster module, you must write boilerplate code to detect available cores, fork workers, and handle worker failures in every application. PM2 eliminates this overhead. A single command like pm2 start app.js -i max launches your application across all available CPU cores.
PM2 also supports zero-downtime reloads with pm2 reload, which gracefully replaces old workers with new ones, ensuring that no active connections are dropped during deployment.
For a single application where you want full control over the clustering logic, the native cluster module is a lightweight option that requires only a few lines of code. For production environments with multiple applications, PM2 is the better choice. It provides built-in monitoring, log aggregation, automatic restarts on failure, and zero-downtime deployments, reducing operational complexity significantly.
Clustering scales your application across cores on a single machine. To handle traffic beyond what one server can process, you need to distribute your application across multiple machines using a load balancer.
A load balancer sits in front of your servers and routes each incoming request to the most appropriate backend instance. Common routing strategies include round-robin distribution, least-connections routing (sending traffic to the server with the fewest active connections), and IP hash-based routing for session affinity.
 Fig. 6: A load balancer distributes requests among servers.
A load balancer prevents any single server from becoming overwhelmed. If one server goes offline or crashes, the load balancer redirects traffic to healthy instances. When new servers are added, they automatically begin receiving requests. This provides both high availability and elastic scalability.
NGINX is a widely-used open-source web server that doubles as a high-performance load balancer. Its features include session persistence, SSL termination, built-in health checks, and support for TCP, HTTP, and HTTPS configurations. For cloud-native deployments, managed load balancers like AWS Application Load Balancer or Google Cloud Load Balancing integrate with auto-scaling groups to add or remove Node.js instances based on real-time traffic metrics.
While the cluster module creates separate processes to handle incoming requests, the worker_threads module addresses a different scaling challenge: CPU-intensive operations that block the main event loop. Tasks like image processing, data compression, cryptographic operations, or complex calculations can freeze your application if run on the main thread.
Worker threads run JavaScript in parallel threads within the same process, sharing memory through SharedArrayBuffer and transferring data via message passing. Unlike child processes created by the cluster module, worker threads are lighter weight because they share the same process memory space.
Here is a basic example of offloading a heavy computation to a worker thread:
// main.js
const { Worker } = require('worker_threads');

function runHeavyTask(data) {
  return new Promise((resolve, reject) => {
    const worker = new Worker('./worker.js', { workerData: data });
    worker.on('message', resolve);
    worker.on('error', reject);
  });
}

// worker.js
const { parentPort, workerData } = require('worker_threads');
// Perform CPU-intensive work here
const result = heavyComputation(workerData);
parentPort.postMessage(result);
The key distinction to remember: use the cluster module when you need to handle more concurrent HTTP requests by distributing them across processes. Use worker threads when specific operations within your application are CPU-bound and would otherwise block the event loop for other requests.
For production applications, consider maintaining a worker thread pool rather than spawning a new thread for each task. Libraries like piscina or workerpool manage thread pools efficiently and handle task queuing, thread recycling, and error recovery automatically.
An application container is a lightweight, standalone image that contains code and all its dependencies so it can run quickly and reliably in different computing environments. The container image includes everything needed to run an application: code, runtime, system tools, system libraries, and settings.
As an alternative to containers, you can deploy a Node.js application to a virtual machine (VM) on some host system once it's ready for production. The VM must, however, be powered up by several layers of hardware and software, as shown in Figure 7.
 Fig. 7: Infrastructure for virtual machines.
The VM running the application requires a guest OS. On top of that, you add some binaries and libraries to support your application (Figure 8).
 Fig. 8: Infrastructure and components of the virtual machine.
Once in production, you need to ensure the scalability of this application. Figure 10 shows how this can be done using two additional VMs.
 Fig. 9: Three virtual machines running on one physical computer.
Even though your application might be lightweight, to create additional VMs, you have to deploy that guest OS, binaries, and libraries for each application instance. Assuming that these three VMs consume all of the resources for this particular hardware and assuming that the application uses other software - such as MySQL for database management - the architecture becomes difficult to manage.
Each software component hosts its own dependencies and libraries. Some applications need specific versions of libraries. This means that even if you have a MySQL server running on your system, you must ensure you have the specific version that the Node.js application needs.
With such a huge number of dependencies to manage, you will end up in a dependency matrix hell, unable to easily upgrade or maintain the software.
Assuming you’ve developed the application on Windows, deploying it to a Linux system will likely introduce incompatibilities. Sharing the same copy of the application to different hosts can be challenging, as each host has to be configured with all the libraries and dependencies and ensure correct versioning across the board.
Virtual machines are great for running applications that need OS-level features. However, deploying multiple instances of a single application that has a lightweight system can take a lot of work to manage. As you can see, maintaining your single Node.js application in such environments can be complex.
Containerization can be an excellent solution to these kinds of problems. With containerization, package your applications and run them in isolated environments. You can run powerful applications quickly even if those applications need different computing environments.
Containerization provides a standardized, lightweight method to deploy applications to various environments. Containers make it easier to build, ship, deploy, and scale applications .
Figure 10 depicts how different Node.js instances can run within a containerized environment.
 Fig. 10: Three containers running on a single physical computer.
With containers, you don’t need a guest OS to run your application, as the container shares the host’s kernel. Resources are shared within the container, and your application consumes fewer resources. If some container process isn't utilizing the CPU or memory, those shared resources become accessible to the other containers running within that hardware. In short, a container uses only the resources it needs.
For dependencies - such as a MySQL server - you need only one container to run the service. By using containers, you also increase the portability and compatibility of your application, meaning it doesn't matter whether it's running on an Ubuntu server with 20 cores or an Alpine server with 4. The container will contain everything your application needs all you should do is ensure that the host system supports container runtimes (eg: Docker, Runc, containerd etc).
In short, containers allow you to
The top tools for container management are
In this article, we have seen that scaling an application can be achieved in several ways. To scale a single instance Node.js application running on a single computer, follow three main principles: cloning, decomposition, and data sharding. The previous examples explored in this article fall under the “cloning” principle.
Cloning (also known as forking) duplicates a Node.js application and runs multiple instances of the same application, splitting traffic between those instances. Each instance is assigned part of the workload.
There are multiple ways of dividing this workload. Two of the most common approaches are implementing round-robin scheduling, where requests are spread equally over the available instances. Or, you can configure your load balancer to always send a request to the instance with the lowest load.
Cloning goes hand-in-hand with using a Node.js cluster module. The load balancer provides efficient performance when you clone your application and distribute the traffic to multiple instances of your application, ensuring that the workload is shared.
A monolithic application can be highly complex to manage. If a monolithic application is decomposed, each service can be handled by an independent microservice.
A good example is a Node.js application providing a database and a front-end user interface. The database, front-end, and back-end can be split into microservices, letting you run each service independently.
Currently, the best model for decomposition is containerization. In this model, you decouple your app into multiple microservices and put each microservice in its container. While each container runs a single service, there’s a possibility for high cohesion between the services.
As your application’s data grows, a single database instance may not be able to handle the volume of reads and writes. Data sharding (also called horizontal partitioning) splits your database into multiple instances, each responsible for a subset of the total data.
For example, you might partition user records by geographic region, with one database shard serving North American users and another serving European users. This approach distributes query load across multiple database servers and reduces the amount of data each shard must manage.
While sharding is a database-level strategy rather than an application-level one, it directly supports Node.js scaling by reducing per-request database latency and preventing your data layer from becoming a bottleneck as traffic increases.
It’s always important to monitor your application and notice when it’s running in an environment that might create a high workload. You can then use the gathered metrics to determine whether you need to change your scaling strategy.
Scenarios where Sharding and horizontal database partitioning can be effective:
Here are some common scenarios you need to consider when changing your scaling strategy.
CPU and RAM usage can be some clear indicators that your application is utilizing the maximum available memory and cores in your machine. When this occurs, users may experience delays due to excessive load, resulting in requests taking more time than necessary. At this point, you should consider scaling strategies that fit your application's ability to scale.
It's advisable to keep an eye on your application's CPU and memory usage, which can be accomplished with one of the following tools:
These tools let you check the load average for each core in real time. You can monitor usage, get alerted when there are signs of incoming issues, and intervene before things get out of hand.
While high CPU and RAM usage may be common reasons for high latency, they aren’t the only possible causes. Therefore, it’s vital to monitor high latency individually.
An optimal application load time should not exceed 1-2 seconds. Any delay beyond this threshold runs the risk of users losing interest, resulting in a staggering 87% user abandonment rate. Furthermore, statistics indicate that around 50% of users abandon applications that take more than 3 seconds to load. Slow website load times also have a detrimental effect on Google ranking index factor.
Applications are expected to run as fast as possible, as it increases user satisfaction and Google ranking. Test your application response time routinely, rather than wait for user complaints.
It’s important to keep track of failed requests and the percentage of long-running requests. Any sign of high latency sends a warning that scaling is necessary.
WebSockets are used for efficient server communication over a two-way, persistent channel, and are particularly popular in real-time Node.js applications, as the client and server can communicate data with low latency.
WebSockets take advantage of Node.js's single-threaded event loop environment. Additionally, its asynchronous request processing architecture facilitates non-blocking I/O that executes requests without blocking. But Node.js can create enough concurrent executions that the number of socket channels grows beyond the capacity of a single node server.
Therefore, when using WebSockets with Node.js, issue io.sockets.clients() to get the number of the connected clients at any time and feed results to tracking and logging systems. From here, you can scale your application to match your node’s capacity.
A file descriptor is a non-negative integer used to identify an open file. Each application process records its own descriptors, and any time a new file is opened, the descriptors record an entry.
Each process is allowed a maximum number of file descriptors at any given time, making it possible to receive “Too many open files” errors. Horizontal scaling is likely to be an optimal solution in this case.
Event loop is a Node.js mechanism that handles events efficiently in a continuous loop, as it allows Node.js to perform non-blocking I/O operations. Figure 12 offers a simplified overview of the Node.js event loop based on the order of execution, where each process is referred to as a phase of the event loop.
 Fig. 11: Phases of a typical event loop in Node.js.
Event loop utilization refers to the ratio between the amount of time the event loop is active in the event provider and the overall duration of its execution.
An event loop processes incoming requests quickly and each phase has a callback queue pointing to all the callbacks that must be handled during the given phase. All events are executed sequentially in the order they were received with the event loop continuing until either the queue is empty or the callback limit is exceeded. Then, the event loop progresses to the next phase.
If you execute a CPU-intensive callback without releasing the event loop, all other callbacks will be blocked until the event loop is free. This roadblock is referred to as an event loop blocker. Since no incoming callback is executed until the CPU-intensive operation completes, there are huge performance implications. The solution is to mitigate the delay caused by the blockers.
You can use tools like blocked-at or the built-in perf_hooks module to detect whether the event loop is blocked longer than the expected threshold. Offloading CPU-heavy operations to worker threads, as described earlier, is one of the most effective solutions for preventing event loop blocking in production.
Scaling your Node.js application inevitably involves deploying updates and restarting processes. Without proper shutdown handling, active requests can be terminated mid-flight, resulting in errors for your users.
A graceful shutdown ensures that your application stops accepting new connections while allowing in-flight requests to complete before the process exits. Here is a basic pattern:
process.on(‘SIGTERM’, () => {
  console.log(‘SIGTERM received. Shutting down gracefully...’);
  server.close(() => {
    // Close database connections, flush logs
    process.exit(0);
  });
});
For zero-downtime deployments in clustered environments:
pm2 reload app to perform rolling restarts that replace workers one at a time, ensuring some workers are always available to handle requestsImplementing graceful shutdown is especially important when running behind a load balancer. The load balancer’s health checks should detect that a shutting-down instance is no longer accepting connections and redirect traffic to active instances.
Scaling is not just about adding more processes or servers. Optimizing the performance of each individual Node.js instance reduces the need for additional infrastructure and lowers operational costs. Here are the key practices to adopt:
--inspect flag to profile memory usage. Unresolved memory leaks cause gradual performance degradation and eventually crash your applicationasync/await, Promises, and non-blocking APIs throughout your application to maintain event loop responsivenessScaling a Node.js application is a multi-layered effort that spans process management, infrastructure design, and code-level optimization. Start by leveraging the built-in cluster module or PM2 to utilize all available CPU cores. Use worker threads to offload CPU-intensive tasks without blocking the event loop. As traffic grows, containerize your application and orchestrate deployments with Kubernetes for automated horizontal scaling.
Equally important is knowing when to scale. Monitor key metrics like CPU usage, memory consumption, event loop latency, and response times to make data-driven scaling decisions. With the right combination of clustering, containerization, caching, and monitoring, your Node.js application can reliably handle significant increases in traffic while maintaining fast response times.
Site24x7 APM Insight provides deep visibility into Node.js performance, helping you identify bottlenecks, slow transactions, and memory leaks that might hinder scaling. It tracks response times, throughput, and error rates so you can make data-driven decisions about when and how to scale.
Yes. Site24x7 can monitor individual instances within a Node.js cluster, giving you a comprehensive view of your application's health and resource utilization across all nodes.
Vertical scaling increases the resources (CPU, RAM) of a single server, while horizontal scaling distributes your application across multiple servers or processes. Node.js favors horizontal scaling through its built-in cluster module, PM2, or container orchestration platforms like Kubernetes.
Use worker threads when you need to offload CPU-intensive tasks like image processing, data compression, or complex calculations without blocking the main event loop. The cluster module is better suited for distributing incoming HTTP requests across multiple processes to handle higher traffic volumes.
Zero-downtime deployments can be achieved by using process managers like PM2 with its reload command, Kubernetes rolling updates, or load balancer strategies that gradually shift traffic from old instances to new ones while maintaining active connections.
