In a server, there is many process working.
I want to view the graph of CPU usage transition of the each process which user can select including server CPU usage.
It is not good to check several reports of the process CPU usage one by one and server CPU usage in the specific period.
It should be a single report.
It is easy for them to find out the root cause of the bottleneck in the troubleshooting.
Hi,
You can view the CPU usage transition for each process from the CPU Utilization graph in the Summary page of your server monitor. Please read our documentation for more details.
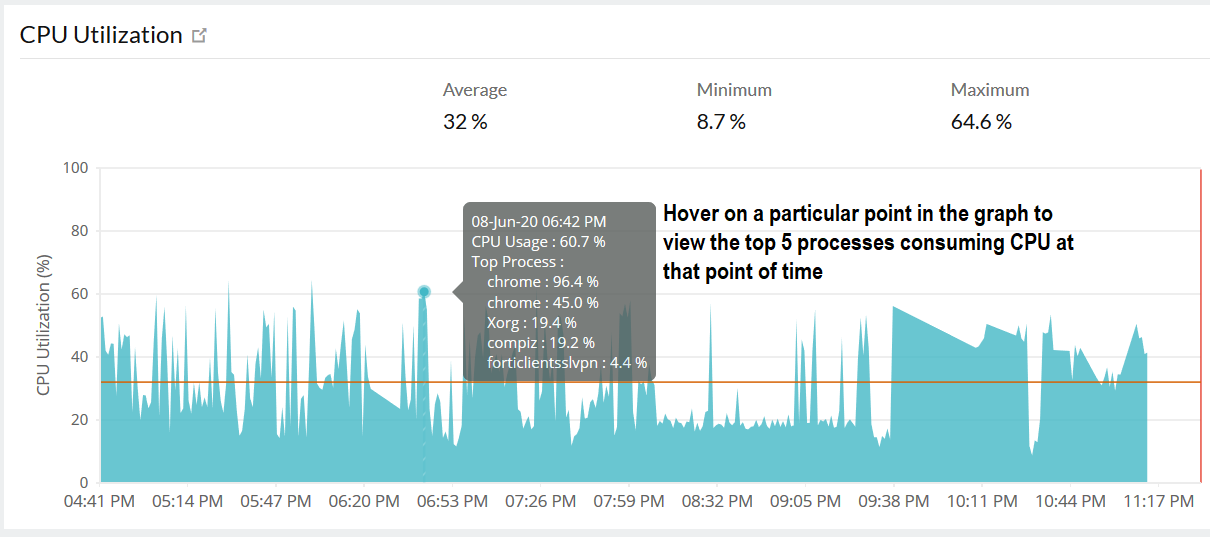
Hope this helps. Let us know for further queries, if any.
Regards
Mathangi
Hi Mathangi
Thank you for the reply.
I understand the breakdown of the server CPU usage by top X process CPU usage in one point on your suggestion.
In the different view, the each process CPU usage also has the plot in the graph and it enables to have more intuitive view for the breakdown of the server CPU usage in the period.
Thanks
Hiro