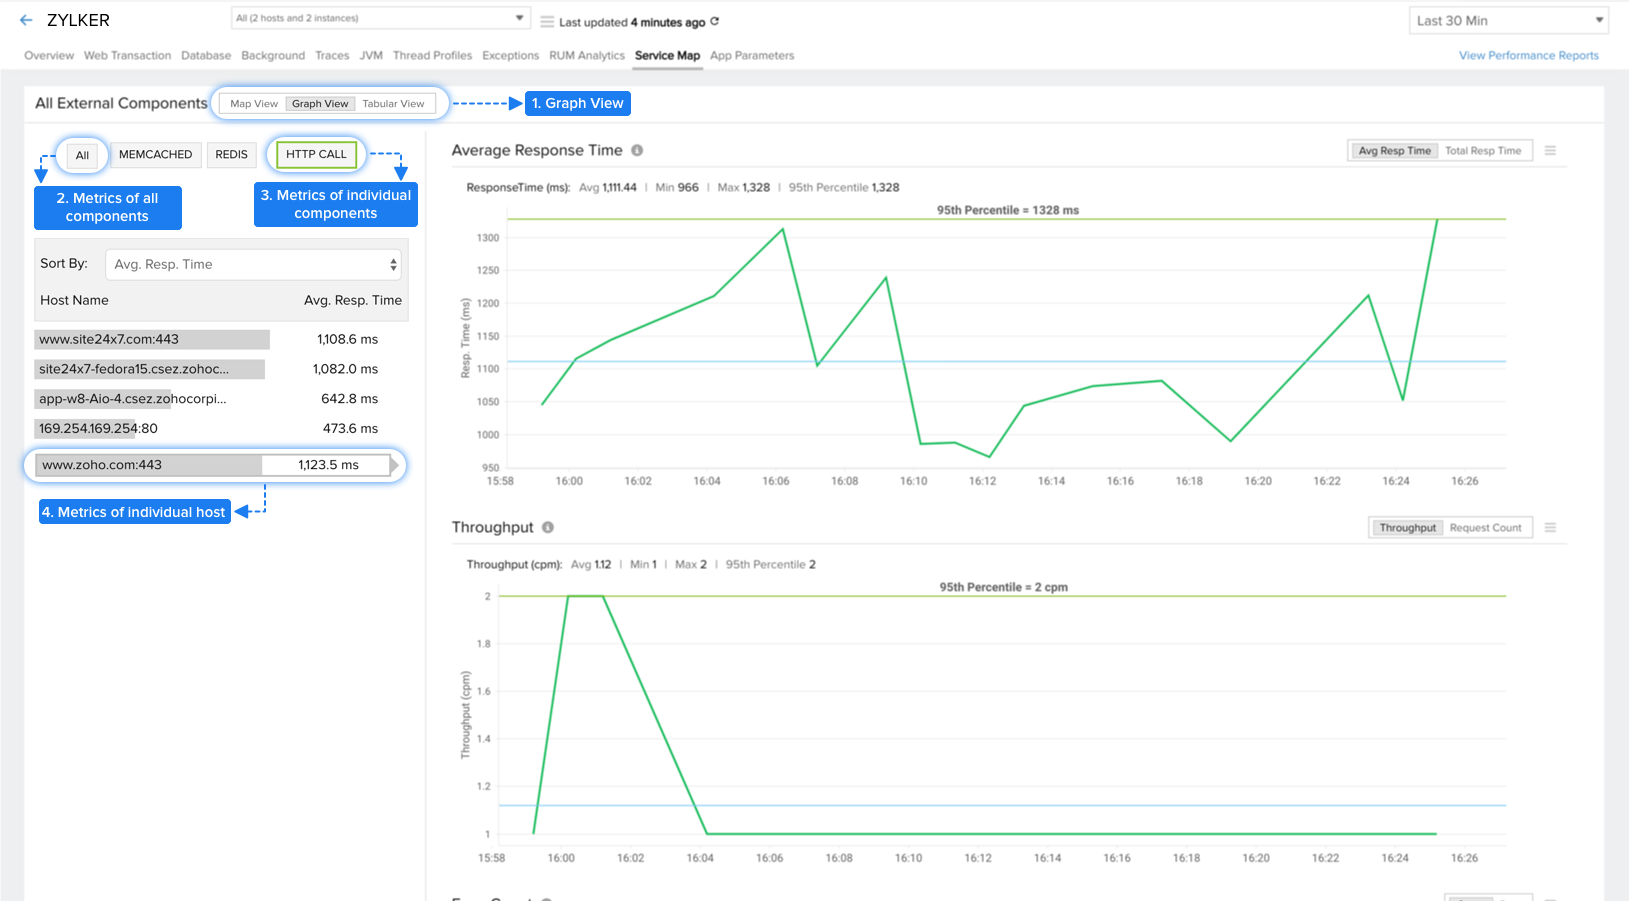
Did you know you can view key parameters of your external components as a graph? Previously, connections to external dependencies were depicted in map and tabular views. We've enhanced our reports so you can view parameters for all components, for all hosts corresponding to individual components, and for individual hosts in easy-to-understand graphs.
Related articles: Visualize your application topology with application dependency maps
Like (1)
Reply
Replies (0)