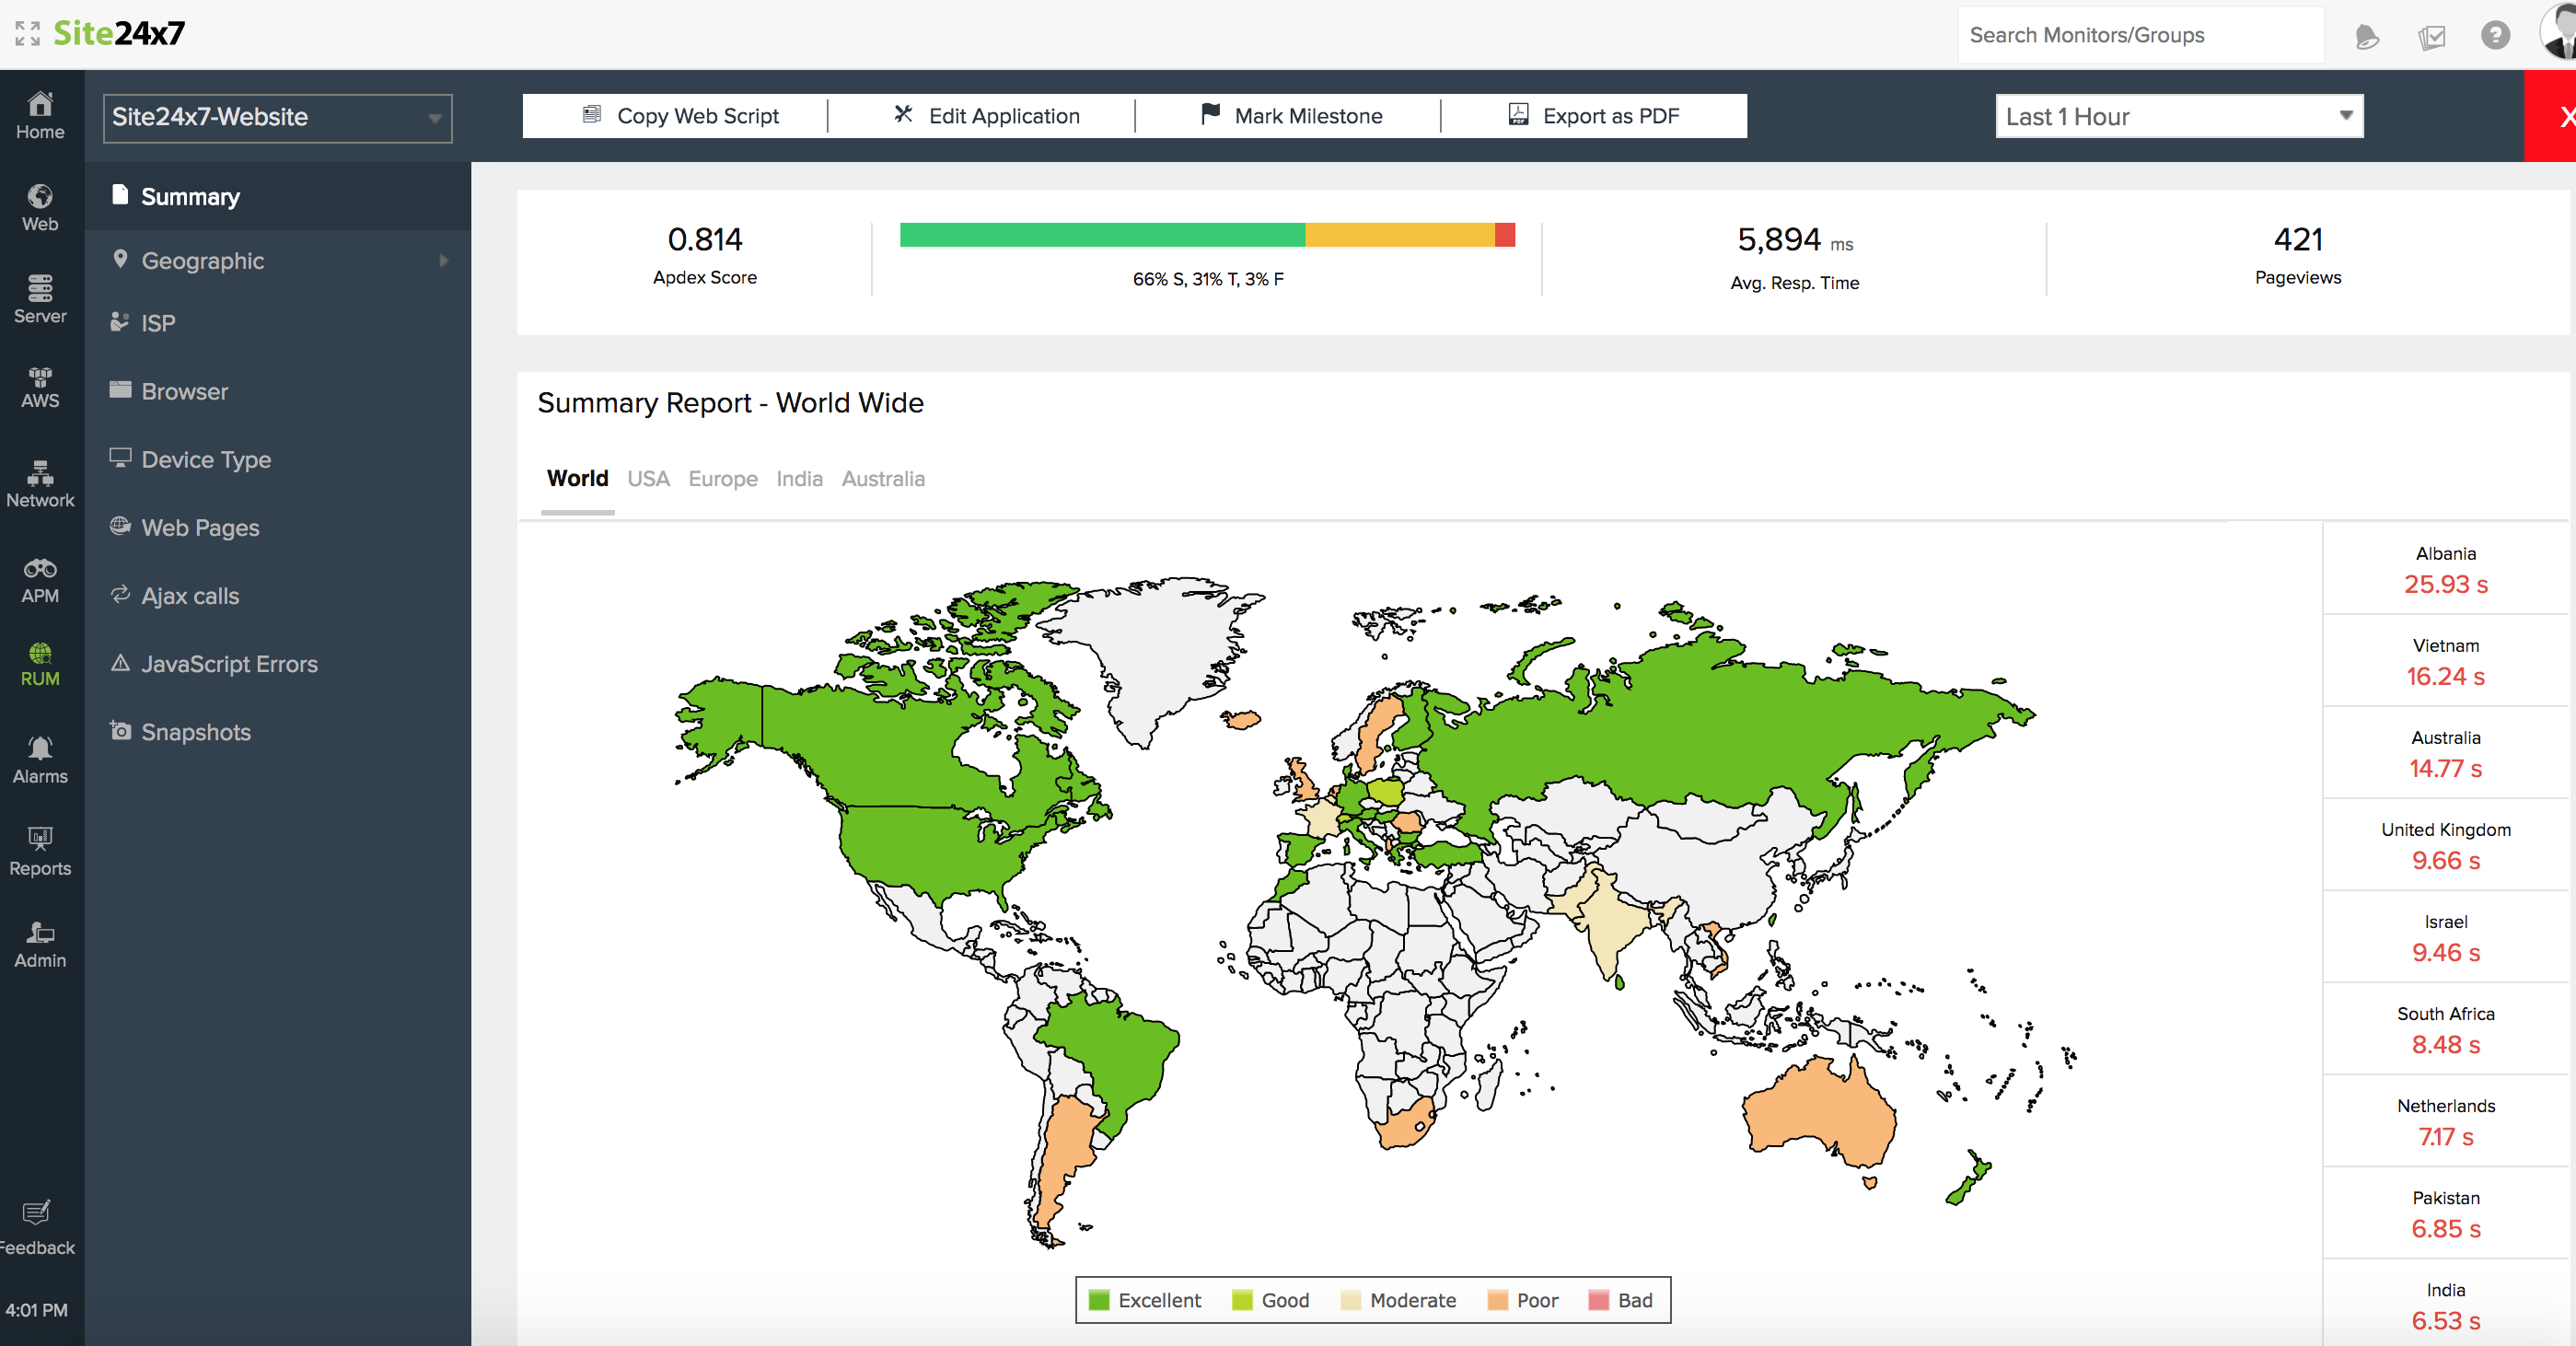
Site24x7 Real User Monitoring helps you to identify your application performance across various geographic regions, devices and browsers.
In addition to the existing features in Real User Monitoring, we have come up with the following enhancements to enhance your monitoring experience:
- RUM Dashboard - The all-new RUM Dashboard categorizes your applications as Active, Inactive and Down, based on the time period of data collection. This lets you view the status of your applications at a single glance.
- For active applications, the change in response time is indicated along with its key metrics in the dashboard, that can be compared over a specific time period. This gives you a fair idea of your application's performance over varied time periods.
- In addition to analyzing performance on a global basis (World Map view) and specific to the US (USA Map View), we now support region-specific and state wise viewing for Europe, Australia, and India.

- An application's response time for poorly performing regions are listed alongside the Map view under the respective geographical regions. For example, the top US 10 states having the highest response time are listed alongside the USA map view.

Well, get a quick feature tour done and experience our enhanced RUM for yourself.
Happy Monitoring !!
Like (2)
Reply
Replies (0)