Load average: What is it, and what's the best load average for your Linux servers?
What is load average?
Load average represents the average load on a CPU during a specific time interval. These values include the number of processes either waiting for or actively using in CPU. The load average can be high or low, depending on the number of cores your server has, how many CPUs are integrated into the system server, and the load average number itself.
People just getting started with system administration often confuse load average with CPU percentage. But while CPU percentage is an active measurement of system performance at the particular time, load average shows how system performance is evolving through different time ranges. Load average gives us a picture of how the system will likely behave in the future.
Monitoring load average in your system
We can use various tools to monitor load average, such as the uptime or top command lines. As its name suggests, uptime gives us the length of time the system has been running, along with further information, like the number of users or the load average value in the last 1, 5, and 15 minutes.
To see an example, let's run uptime on the Linux server:
![]()
Here we can see that the server has been up and running for four days; there is one person using the server; and the load average for the last 1, 5, and 15 minutes has been 0.29, 0.61, and 0.6, respectively.
With the top (table of processes) command, we can get a list of current running processes in the system and resource utilization statistics in CPU and memory.
Let’s run the top command in the Linux machine to see what this looks like in practice.
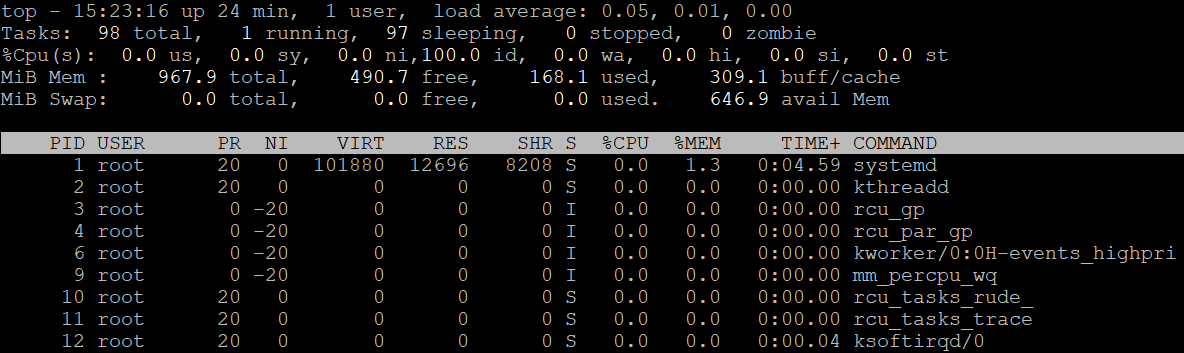
We can see from the results that there is one user in the system, and the load averages for the last 1, 5, and 15 minutes are 0.05, 0.1, and 0.0, respectively.
What’s considered to be a high load average?
A load average value is considered to be high when it’s greater than the number of CPUs the server has. For example, if the number of CPUs in our server is only 4, but the load average we’re seeing is 5.4, we’re experiencing a high load average.
Take the below result for uptime as an example.
![]()
In this case, the load average is 2.97, while the current server has only one CPU. We can get the number of CPUs in the server by using lscpu.
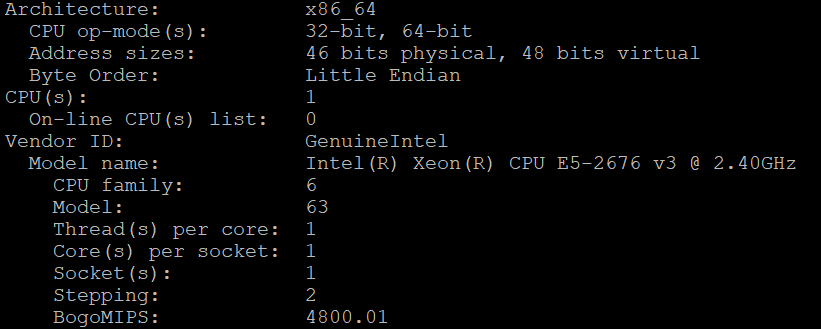
This is a high load average.
What’s the ideal load average?
Load average is considered to be ideal when its value is lower than the number of CPUs in the Linux server. For example, with only one CPU in the Linux server, it’s best if the load average is below 1.
![]()
In the above case, the load average value for 1, 5, and 15 minutes is only 0.5, 0.69, and 0.71, so we don’t need to be concerned.
Addressing high load average issues
To resolve a high load average issue, we need to understand what’s behind it. High load average tends to occurfor the three reasons mentioned below.
1. A high number of threads executed in the server
There might be an application running on the server that is implemented using concurrency models like Akka or goroutines. On the one hand,this will improve the performance of the application, since it can handle several requests at the same time.
On the other hand, however, this will lead to a high number of threads being executed in the system. To resolve this, we need to either increase the number of CPUs in the server (notwithstanding the added costs) or optimize running applications to reduce the number of threads.
2. Lack of RAM forcing the server to use swap memory
Another possible reason behind a high load average is lack of RAM. When the system detects that there isn’t enough memory for running processes, it turns to using swap memory. The problem with using swap memory is that there are bound to be multiple processes to be waited on in the processor queue, which then will lead to high load average.
To address this issue, we’ll have to find ways to optimize the application running in the server to save memory. If this doesn’t help, the only remaining solution is adding more RAM to the server.
3. A high number of I/O traffic
High load average could also occur due to a high number of I/O requests in the system. With a lot of I/O requests, the system will invariably experience high latency, which in turn will lead to high load average. To see whether this is the source of our high load average issue, we can use the command line tool iostat and identify the partition that’s having excessive I/O traffic. This will allow us to safely stop the processes causing theproblem.
How to read load average on different processor units
The top command only shows the average load of the system in different periods of time. If we’re intent on reading the load average on a specific processor unit, we will need to do some calculations first.
We’ll begin by running the top command.
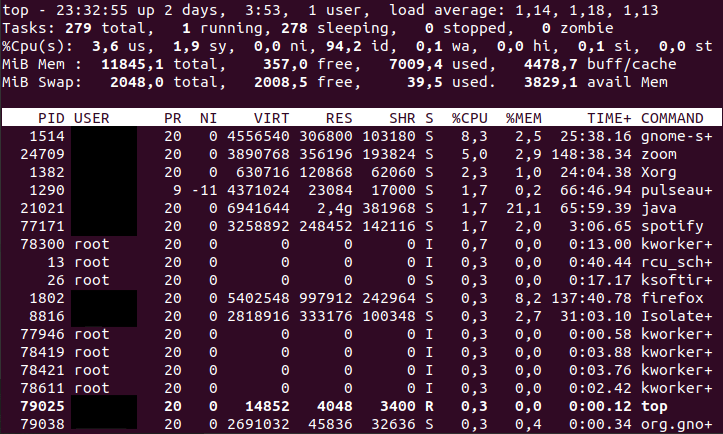
Here the load average of the system is 1.69 in the last 1 minute, and we see the average stats for all CPUs. Meanwhile, we don’t know how CPU 0 is functioning—to find out, we need to press 1.
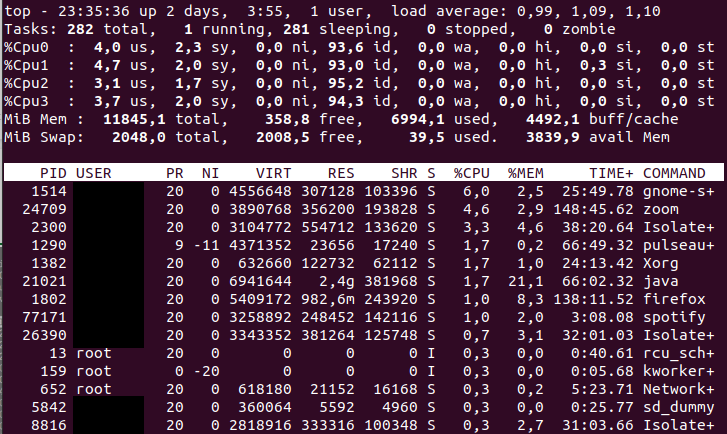
This will give us the stats for CPU number 0: the load average(0.99; 1.09; 1.10), time spent in user space (4.0 us), and the time used by system processes (2.3).
How to use Site24x7 to proactively monitor and address load average issues
Using the top or uptime commands only gives us a basic timeline of the load average on the server. Let’s say we’d like to visualize the data so that we can easily see how the load average is trending over a period of time—or we want to see how the load average value relates to other stats. Here’s where a more powerful monitoring solution like Site24x7 will come in handy.
Our goal is to monitor the load average of a running Linux server. By installing the Site24x7 agent in the server, we’ll have a number of tools for improved server monitoring, such as anomaly detection, outages, monitor groups, or to schedule maintenance.
Site24x7 will show a visualization of the load average data so that we can easily see how load average stats are trending over the most recent time range.
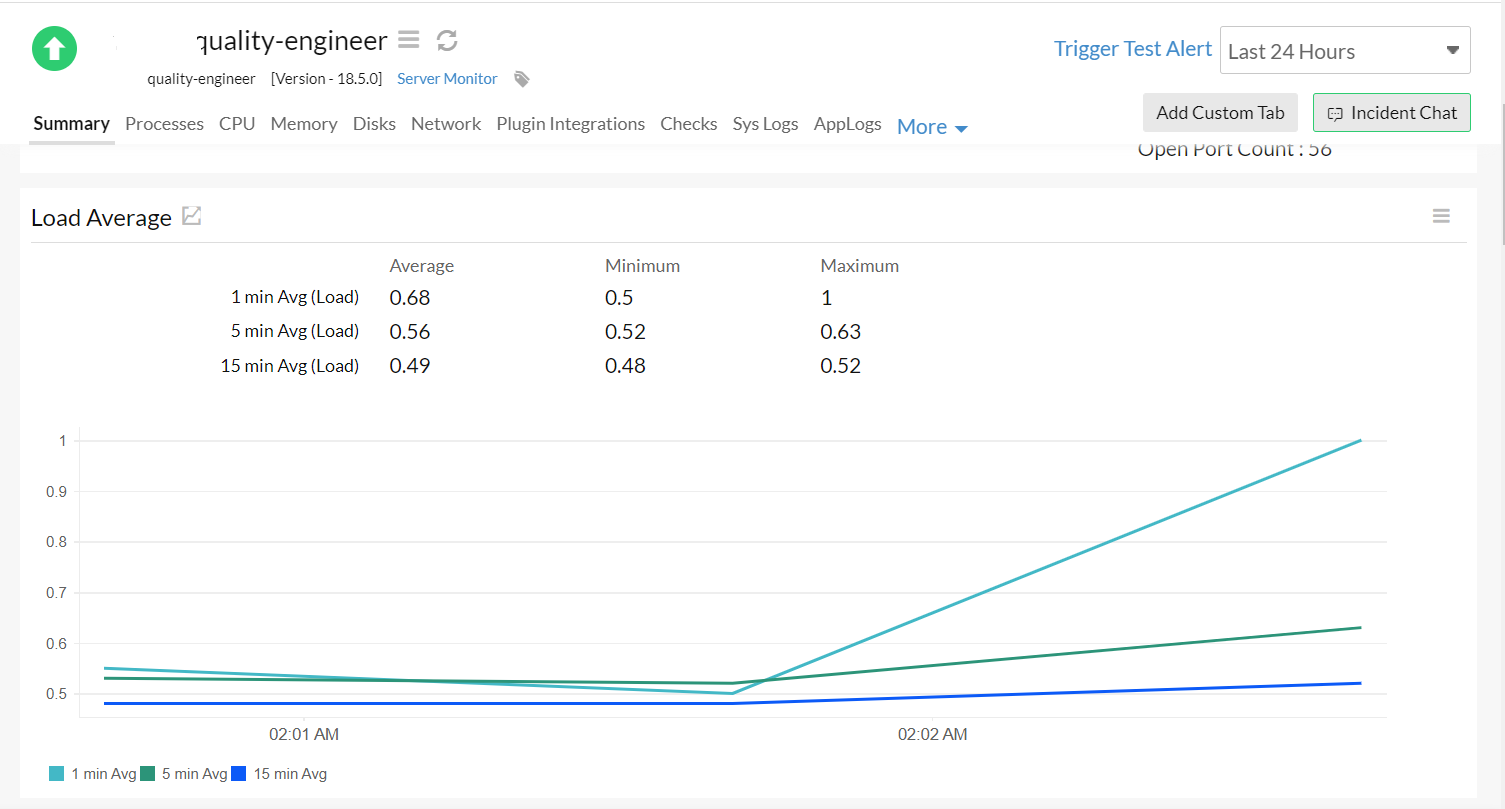
Moreover, we will automatically get notified of any high load average issues.
Edit: Article updated on 17, Nov 2022.
Great example so far
Easy way to let me understand load average
To kill process! That is the best solution for high load averages! Great guide!
Thank you for the feedback.
I think that the part "To kill process! That is the best solution for high load averages! Great guide!" was ironical... to kill blindly the most consuming process as soon as a server gets a too high load average is something just crazy. I think this is one of the worst pages about load average on the internet.
I think that you are mis-reading the document.
They posed the question: What do you do when the system is overloaded?
The answer: You have to either kill processes or add more resources.
They didn't say that you must just kill high-load processes.
The whole intent of the article was to show you how, with proper monitoring, you can right-size your server infrastructure so that you DON'T have to kill processes, whilst also not wasting money on buying server resources that aren't need.
I think that this page is a little misleading.
It starts with explaining that the output (load average 0.5 1.5 3.0) means the average in 1, 5 and 15 minutes, and suddenly it explains that the load average of 0.5 is fine, 1.5 is medium and 3.0 is problematic. (That is, my system was ok in the last 1 minute, it was a bit overloaded in the last 5 minutes, and it was terribly overloaded in the last 15 minutes.) It even suggests that the 3 numbers always form an increasing series.
I agree that this is not the best explanation here.
Average load does NOT only measure CPU, but also other server resources that cause a task to wait.
So slow IO might mean the CPU task is waiting, but the CPU is not overloaded.
Also, an ave. load of say 2 might be a problem for a webserver but perfectly fine for a mail server.
The question of "what is a good ave. load value" is much more complex and is very much dependent on the the environment, what the server is used for, how big is the budget etc etc
You can use this article as a "rough" guide, but a better approach is to "measure your current load averages when you know your server is working fine" i.e no user complaints, web pages load fast, apps run smoothly etc. Then monitor for significant changes over time.
I always thought that it was some kind of average percentage, now I know :P Thanks ;)