Improving MTTR with AIOps: Myth or Fact?
 There was a version of daily life, not long ago, that ran entirely on physical effort. Booking a trip meant a visit to a travel agent. Ordering lunch meant walking to a restaurant or calling and hoping someone picked up. Buying something for the home meant a trip to the store and a checkout queue. Paying a bill meant visiting a bank branch and engaging with a teller. None of it was instant, and nobody expected it to be.
That world is largely gone now. A phone in hand can do in minutes what used to take a full day of physical errands: book a flight, order lunch, buy an appliance, pay a bill, all from the same five-inch screen. None of it works without three things lining up at once: internet connectivity, a digital application to execute the request, and a way to pay for it digitally. When any one of those three falters, the whole transaction stalls, regardless of how good the other two are. The convenience is real, but it’s also fragile in a way the old, slower process never was, because there were far fewer points where a single failure could stop everything.
It isn’t only individuals living this way. Enterprises run the same way internally now. A CRM in a data center, a bespoke line-of-business app, an internal portal employees use daily are each load-bearing infrastructure for ordinary productivity. The tasks these perform are the digital equivalent of the errands employees once ran in person. A glitch in any of it doesn’t just inconvenience someone, it stalls work, the same way a closed bank branch once did. Except now, it happens silently, mid-task, with no queue to signal that something’s wrong.
It isn’t only outages that do damage. A service that’s technically up but slow can cost just as much as one that’s simply down. On e-commerce websites, abandonment jumps roughly 90% when a load time stretches from one second to five. Younger users carry even less patience for it, having grown up with seamless digital experiences and little tolerance for friction. The generation that doesn't often stand in a line at a bank has little frame of reference for waiting, so a five-second delay doesn’t register as “slow,” it registers as broken. Slow is the new down.
Amine's experience is one example of this story. He’s buying a new TV. He adds it to his cart, gets to checkout, and selects his bank’s payment option. The transaction fails. He tries again. It fails again. He shrugs, switches to a different card, and finishes the purchase, mildly annoyed, already half-forgetting about it by the time the delivery confirmation lands.
But his is not the only problem transaction. Over the next hour, the e-commerce platform’s own monitoring shows a cluster of failed transactions, all routed through the same bank’s payment integration. By the afternoon, the platform’s team is on a call with their CIO asking a blunt question: should they pull this bank’s payment option from checkout entirely, until someone on the bank’s side can explain what’s happening? For the platform, that’s a minor configuration change. For the bank, it’s a payment channel disappearing from a major retail partner, publicly, over something its IT team didn't detect.
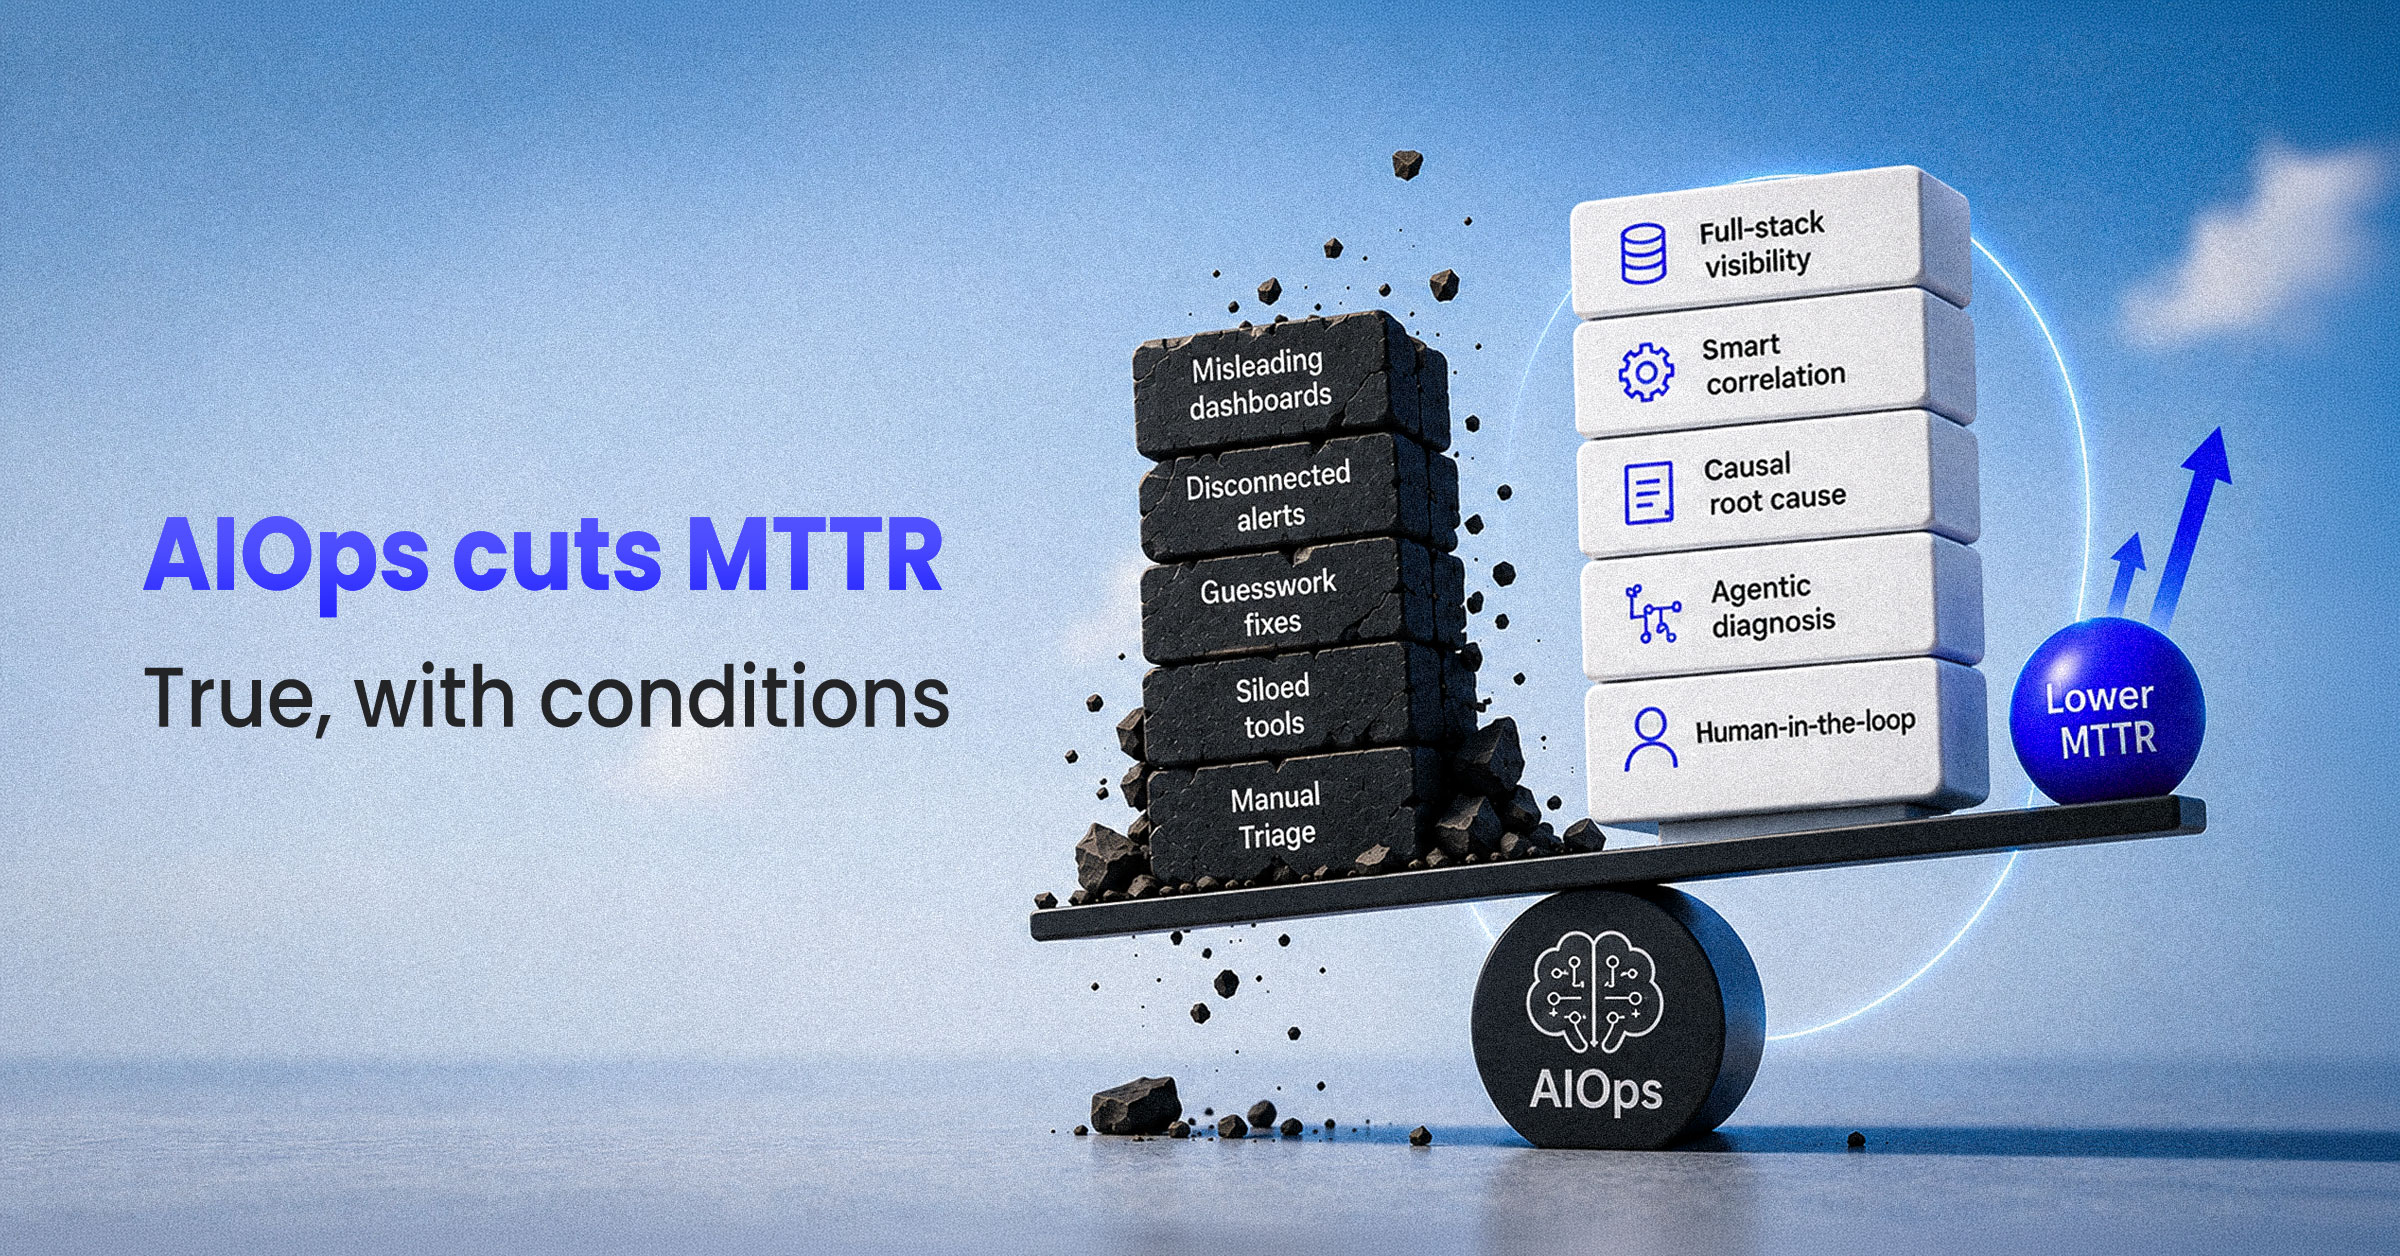
Improving mean time to repair (MTTR) is myth when visibility is missing. Everything that follows is really one argument: that sentence is either obviously true or obviously false, depending on what a team can actually see.
Myth: The application side of Amine’s bad afternoon
On the bank’s side, nothing looks wrong. Server CPU is fine. Memory is fine. Network throughput is fine. Every dashboard the infrastructure team owns displays "green", which indicates that systems are fine. But this is the worst possible starting point, because it means the actual problem is sitting somewhere none of those dashboards reach.
So the investigation falls to developers, in the most primitive way available: adding log statements around suspected code paths, redeploying, waiting for the failure to occur again, then reading through raw logs line by line hoping something jumps out. This isn’t the worst case. It’s the default, when nothing structured exists to replace it. For an intermittent, load-dependent failure, this kind of search can take hours, sometimes days, because the team can’t reproduce it on demand, only wait for it to recur and hope they logged the right thing this time.
Because it’s a payment transaction, the stakes climb fast. Leadership wants updates. Calls come in asking for status, then again an hour later. Because nobody actually knows the cause yet, the team gets pushed toward decisions they can’t fully stand behind: roll back the deployment, restart a service, disable a flag, not because the evidence points there, but because doing something feels better than admitting nobody knows yet. Sometimes it works. Sometimes it doesn’t, and the partner’s threat to drop the payment option gets more real with every hour that passes without an answer.
Myth: An internal network nobody’s watching the right way
A few floors away, Sam, a network administrator from the bank, makes a routine change to a router configuration during a maintenance window, adjusting a routing preference meant to balance load across two paths. Instead, traffic shifts heavily onto one subnet’s path while the other sits comparatively idle. Sam closes the ticket and moves on.
John, a member of the IT help desk team, doesn’t know what change happened. What he knows is that help desk tickets are piling up, and so are phone calls, all from bank employees on one specific cluster complaining their connection has gotten noticeably slower. The confusing part: employees on another cluster, the same data center but different subnet, report nothing wrong, which makes the issue harder to detect, not easier. John has reviewed performance monitoring information that indicates to him that something changed. But he has no configuration-change visibility details telling him why, so he’s troubleshooting a symptom with no idea a cause already exists from two rooms over, via a change nobody flagged for him.
What observability actually means, and what has to be watched
Monitoring tells a team something is wrong. Observability tells them why, by combining metrics, logs, and traces instead of looking at each one separately. Without all three connected, a support team is back to staring at dashboards that aren’t lying, just incomplete, while the real problem sits in whichever layer nobody’s watching closely enough.
Fact: Application observability resolves Amine’s case
For this transaction, observability means watching the application layer down to the level of one specific transaction and the exact call it makes into the database, not just whether the server hosting it is up. It means distributed tracing that follows the real path a payment request takes end to end, and query-level visibility into the database itself, since a missing index three layers down can present as application latency two layers up. None of this requires knowing anything about the consumer Amine. It just requires nothing in that transaction’s actual path to stay invisible.
With that in place, the resolution follows a consistent five-step pattern: Detect, Group, Analyze, Diagnose, Recover.
Detect: Anomaly detection flags the latency specifically on this payment transaction type, not as a generic server metric buried among thousands of others. Site24x7’s Zia-based anomaly detection builds a dynamic baseline from historical behavior rather than a fixed threshold, so a real deviation gets caught without someone having to guess the right number in advance.
Group: Instead of two separate, seemingly unrelated alerts, the app-layer slowdown and a spike in database query load get correlated into a single Problem, because Smart Groups already know, through topology and dependency mapping, that this transaction depends on that database table.
Analyze: Causal AI goes further than correlation: it determines which signal actually triggered the other, not just that they moved together. Here, it confirms the unindexed table’s query load triggered the latency, not the other way around, ruling out the application code and the infrastructure as suspects before anyone spends an hour chasing them.
Diagnose: Beyond detecting, grouping, and determining the cause sits the layer where agentic AI mimics how a senior engineer would actually close this out. A Zia Agent configured for this transaction type pulls the trace, the query metrics, and the dependency map together the way a person would manually cross-reference three separate tools, except instantly and all at once. Working from the task and its configured knowledge sources, and drawing on the same language-model reasoning that Ask Zia leverages to answer questions in plain language, the Zia Agent confirms the unindexed table that caused the latency. It diagnoses the issue in plain language and prescribes the fix in specific terms: add an index, on this table, on this column. That is the difference between a causal finding and an actionable one.
Recover: Team members apply the prescribed fix, exactly as diagnosed, because they are informed, not just guessing. The MTTR is compressed not because AI replaced human judgment, but because the correct cause was identified, explained, and acted on quickly. Full-stack observability is what identified the correct solution. The agentic layer is what made diagnosing and prescribing it fast. Neither half-substitutes for the other.
Fact: Network observability resolves Sam and John’s case
For this network, observability means watching not just whether a link is up, but the configuration state of every device sitting on that path. Network configuration management (NPM) shows only what changed in traffic. It was never built to show what changed in configuration that caused it. Real visibility here means configuration management and performance monitoring watch the same devices together, so a change and its consequence land in the same place instead of two consoles that are not cross-referenced.
Detect: Site24x7’s Network Configuration Manager captures Sam’s change the moment it’s made, versioned and compared against baseline, while NPM independently flags the traffic and latency shift on the affected subnet at almost the same time.
Group: Both events get tied together because they share the same device and time window, rather than sitting as an unremarkable config-change entry on one screen and an unexplained latency spike on another.
Analyze: The causal direction is now obvious instead of inferred: Sam’s change triggered the traffic skew; the employee complaints were downstream of it, not the other way around. A compare-with-baseline view shows exactly what changed, line by line.
Diagnose: A network-scoped Zia Agent, the agentic AI layer for this domain, pulls together the configuration difference from NCM and the traffic anomaly from NPM, the two signals John would otherwise have had to connect himself. The Zia Agent determines the way an experienced network engineer would: this change, on this device, at this time, and explains this exact traffic shift. Working from the same configured tasks and language-model reasoning used across Site24x7’s agentic layer, it does not stop at confirming the causal link. It prescribes the resolution: revert to the last known-good configuration, or push the standardized baseline template back out to the affected devices. John receives a diagnosis and a recommended fix in the same place, instead of a correlation he still has to interpret.
Recover: John applies the prescribed fix, reverting the configuration or pushing the standardized, authorized template back out across affected devices, the same drift-to-remediation flow that exists for exactly this kind of inconsistency. He is confirming and executing what the system already diagnosed, not piecing together a mystery from two unrelated complaint patterns.
Let's be honest about a limitation here: causal accuracy is only as good as the topology and configuration data feeding it. A causal engine working from an incomplete or stale dependency map can confidently point at the wrong layer, which is exactly why this only becomes fact once visibility is genuinely complete, not once a vendor says it is.
The verdict
The bank can now answer Amine’s kind of incident with a confirmed cause instead of a guess and a CEO call. Fragmented IT environments are exactly what makes correlating signals and resolving incidents quickly so difficult in the first place, and that fragmentation is precisely what full-stack visibility closes. For John, this means that the next time his phone rings about slowness, he already has a very good theory about what changed before he dives into to provide a solution.
Myth : AIOps improves MTTR on its own.
Fact : AIOps improves MTTR once nothing in the stack is left invisible to it.
Let's be precise about what is, and is not, the myth here. Observability sees the metrics, logs, and traces across every layer of the stack. Agentic AI takes in that same data, and the events sitting on top of it, from every layer at once. It analyzes the events the way a 20-year veteran engineer would: as someone who has seen this exact failure pattern before, knows immediately what it means, and does not need to be talked through it. However, this veteran has the dependency map, the trace, the configuration difference, and a diagnosis already reasoned out from everything an LLM has learned about how these failures behave. The veteran engineer knows which actions to take and what to conclude, instead of having to investigate from square one.
Myth : Agentic AI speeds up MTTR resolution on its own.
Fact : Agentic AI speeds up MTTR resolution once it has the complete visibility a 20-year veteran would insist on before diagnosing anything, and that combination is not myth. It is what just resolved both cases above.
FAQs
1. How do you evaluate whether an AIOps platform will actually reduce mean time to repair (MTTR)?
Check whether it correlates alerts into a single root cause instead of forwarding noise. Confirm it has full-stack visibility into the layer where failures start. Then, check that it prescribes a fix rather than providing a chart of possible solutions.
2. Why are all my dashboards green during an outage?
This occurs because infrastructure dashboards only watch the layers they were built to watch. A failure in an unindexed query or a single application call often sits outside their reach. That blind spot is why a service can be broken while every metric reads healthy.
3. Does AI actually replace engineers in incident response?
No. It changes where their time is invested. The cause still gets identified, explained, and acted on by people. AI compresses the investigation time so they confirm and execute instead of having to start from zero.
4. What are Zia Agents?
Zia Agents are AI agents in Site24x7 that handle ambiguous incidents requiring reasoning, not just procedural fixes. Each one works from the tasks and knowledge sources it is configured with, so it can cross-reference traces, metrics, and dependencies the way a senior engineer would. Instead of stopping at a probable cause, it diagnoses the issue in plain language and prescribes the specific fix.
5. What is network configuration manager?
Network configuration management (NCM) is the practice of tracking, versioning, and controlling the configuration of network devices. It captures every change, compares it against a known-good baseline, and flags unauthorized or unexpected edits. When a change causes a problem, it lets teams roll back to the last authorized version quickly.