Gain deeper insight into your AWS environment with our new multi-monitor metric views
One of the biggest challenges in a self-provisioned, public cloud environment like Amazon Web Services (AWS) is finding the right balance between resources, performance, and cost. With no initial visibility into usage stats, AWS customers tend to overprovision compute, storage, and database resources to cushion sudden spikes in demand. If users could see resource usage, they'd be able to determine if the numbers provisioned are really in line with the application workload. Luckily, Site24x7's custom dashboard combines key performance metrics with different visualization widgets, so you can see whether you're maxing out your resources or whether you could cut back on resources to save costs.
The role of any good dashboard is to provide insights at a glance, but a great dashboard goes one step further and helps quickly answer key questions to speed up decision-making. We've rolled out a new widget type in our custom dashboard, a multi-monitor performance chart, to do just that. Now you can pull data points of a single performance metric from multiple resources into a single, time-series chart to bring about quicker comparison, analysis, and action. For example, you can compare CPU or memory usage across your EC2 compute fleet to determine whether you need to configure dynamic scaling policies like target tracking or set up simple scaling policies.
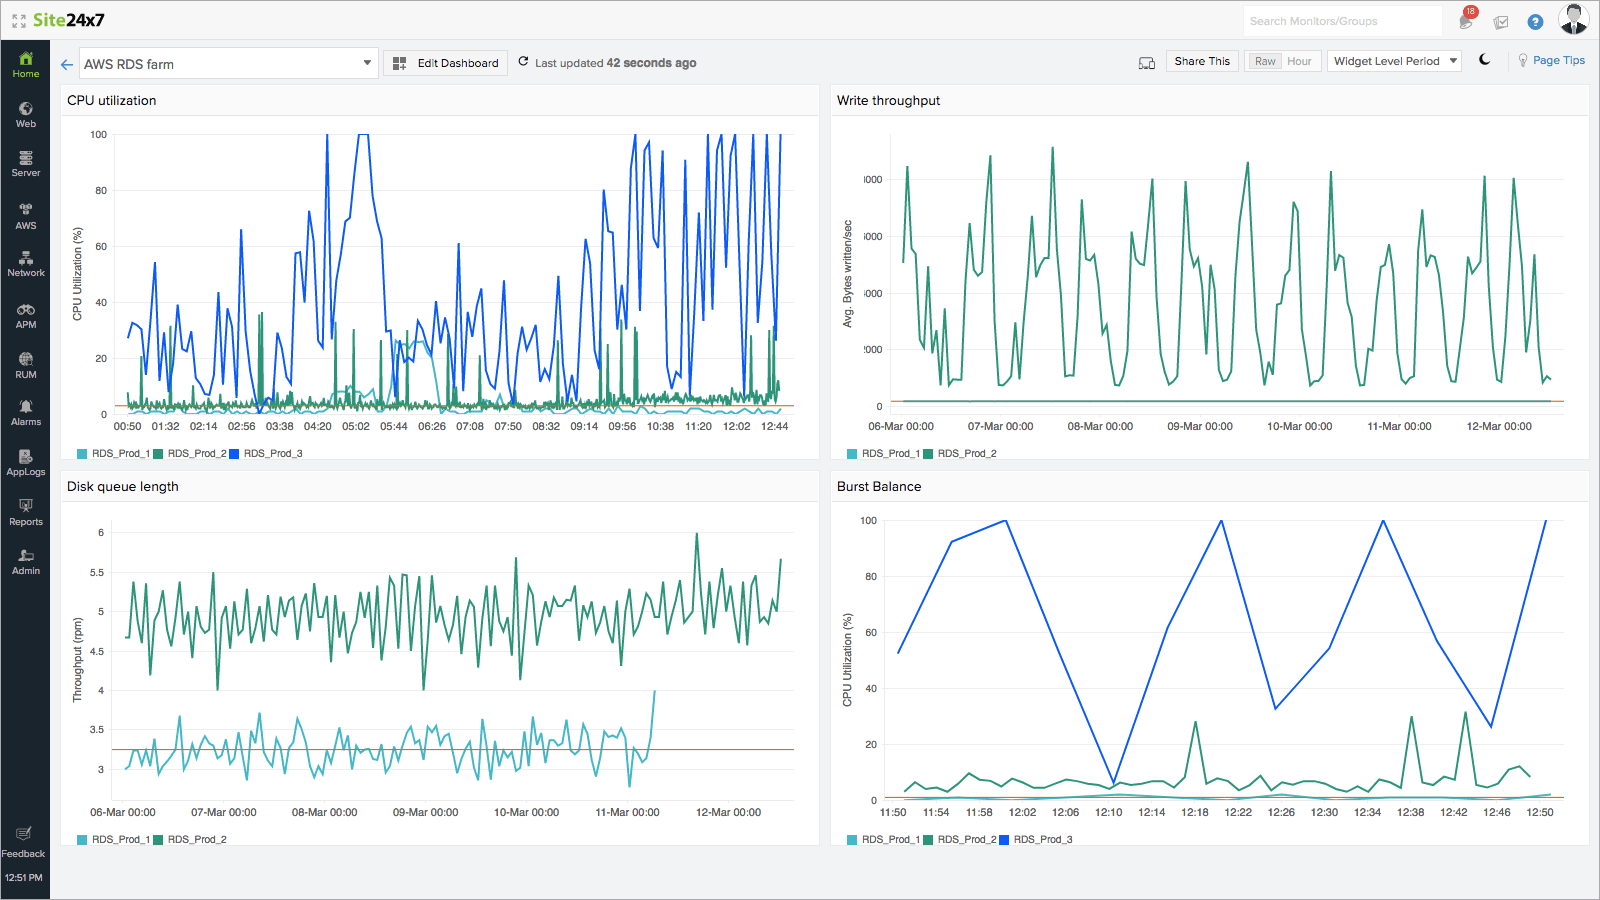
To drive this point home, let's take the Amazon Relational Database Service (RDS) service as an example and see how our new multi-monitor metric view can help you compare data and spot trends, as well as easily find answers to questions like:
- What are the top RDS instances in terms of load, read/write activity, and database connections?
- Are the database loads across my instances roughly equal or do they vary? Is there a pattern I can act on?
- What is the average number of database connections across my RDS cluster, and did it change during the week?
- Should I consider increasing the allocated storage space or improve performance by changing the storage type?
- What about the heath of the DB instances in my cluster? Is there any recent downward trend?
- Are certain instance types more effective? Should I scale up my other instances to match the type that's most effective?
- Are there any abnormal amount of transaction logs generated across my PostgreSQL DB instances?
Getting started
- Log in to the Site24x7 console.
- Select Home > Dashboards > Create new.
- Select Multi-Monitor Performance Widget as the Widget Category.
- Select any AWS service as the Monitor Type (we offer monitoring support for 10 AWS services out-of-the-box).
- Next, select the resources you'd like from the Monitors drop-down.
- Finally, drag and drop any chart widget of your choice into the dashboard grid.
This enhancement is built on top of our existing custom dashboard capabilities, so all the features that you've come to know and love - time range control, chart resize/reuse?apply to this widget as well.
So, what are you waiting for? Create your multi-monitor metrics view and ditch the time-consuming task of comparing data points across charts to cut the time it takes to analyze issues in half.