10 tips for log shipping using Fluentd
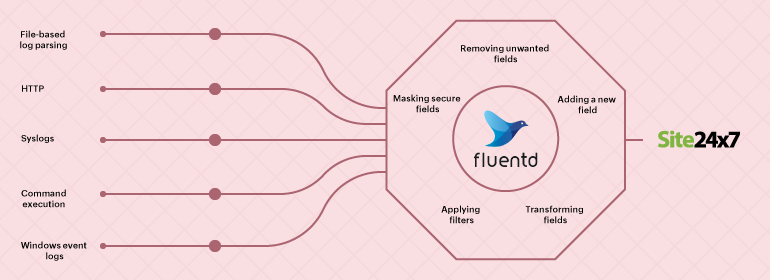
Fluentd is an open-source data collector that unifies data collection and consumption.
It has different types of plugins that retrieve logs from external sources, parse them, and send them to log management tools like Site24x7 AppLogs. tail, forward, udp, tcp, http, syslog, exec, and windows_eventlog are common input plugins.
Reading logs based on type
The way log management tools read logs varies with the type of log and how it’s sent. In this blog, we'll cover different use cases with their syntax.
-
Syslogs
The in_syslog input plugin allows Fluentd to retrieve records via the syslog protocol on UDP or TCP. Simply set up your syslog daemon to send messages to the socket.<source>@type syslogport 5140bind 0.0.0.0tag system</source> -
Windows event logs
To collect application, system, and security channel events from Windows event logs using Fluentd, use the plugin below:<source>@type windows_eventlog@id windows_eventlogchannels application,system,securitytag winevt.raw<storage>@type localpersistent truepath C:\opt\td-agent\winevt.pos</storage></source> -
HTTP
To send events through HTTP requests, you can use Fluentd's in_http plugin and launch a REST endpoint to gather data.<source>@type httpport 9880bind 0.0.0.0body_size_limit 32mkeepalive_timeout 10s</source> -
Exec
You can use the in_exec input plugin to collect logs using command execution. It executes external programs to receive or pull event logs. The plugin then reads tab-separated values, JSON, or MessagePack from the standard output of the program.<source>@type exectag system.loadavgcommand cat /proc/loadavg | cut -d ' ' -f 1,2,3run_interval 1m<parse>@type tsvkeys avg1,avg5,avg15delimiter " "</parse></source> -
File-based log parsing
Using the in_tail input plugin, you can read events from the tail of text files. If needed, you can parse the content in the log, such as the information from a particular field. Defining the parsing varies with the type of log file that's to be shipped using Fluentd.-
CSV file
<source>@type tailpath /var/log/sample-log.csvpos_file /var/log/td-agent/csv.log.postag dummy.access<parse>@type csvkeys time,host,req_id,usertime_key time</parse></source><match dummy.*>@type stdout</match> -
Single-line: Apache access logs
<source>@type tailpath /var/log/httpd-access.logexclude_path ["/path/to/*.gz", "/path/to/*.zip"]pos_file /var/log/td-agent/httpd-access.log.postag dummy.apache<parse>@type apache2</parse></source> -
Multi-line: Java stack trace
<parse>@type multilineformat_firstline /\d{4}-\d{1,2}-\d{1,2}/format1 /^(?<time>\d{4}-\d{1,2}-\d{1,2} \d{1,2}:\d{1,2}:\d{1,2}) \[(?<thread>.*)\] (?<level>[^\s]+)(?<message>.*)/</parse>
-
Adding filters to log parsing
- Quite often when you ingest logs into a system, you want to remove certain fields or add a few. We'll cover such special use cases below.
-
Applying filters
If you want to exclude the log lines with the log-level INFO while parsing the logs, use the following syntax:<filter foo.bar>@type grep<exclude>key log_levelpattern /INFO/</exclude></filter>
If you want to exclude the log lines with the hostname fields containing web1.example.com and web5.example.com while parsing the logs, you can use the syntax given below:<filter foo.bar>@type grep<regexp>key hostnamepattern /^web\d+\.example\.com$/</regexp></filter> -
Masking secure fields
If your log lines contain secure data like an IP address or a credential, you can mask that particular entry before shipping them.Input = 172.21.163.159 - - [07/Jun/2017:19:53:11 +0530] \"GET /tets?private_token=0101032030301&user=as7&cid=12e09qweqweqq HTTP/1.1\" 200 12 \"-\" \"Mozilla/5.0 (X11; Linux x86_64) AppleWebKit/537.36 (KHTML, like Gecko) Chrome/52.0.2743.116 Safari/537.36\"<source>@type tailpath /var/log/httpd-access.logpos_file /var/log/td-agent/httpd-access.log.postag apache.access<parse>@type apache2</parse></source><filter apache.access>@type record_transformerenable_ruby<record>path ${record["path"].gsub(/(private_token=)(\d+)/,'\1****'}</record></filter> -
Removing unwanted fields
Log lines are always huge because every event is recorded. However, while monitoring, one may not need every field in the log line. Here, you can choose to remove the unwanted fields and export only what is necessary. In the example below, we have considered the use case of Kubernetes pod logs, where you can remove the key_name_field value before parsing the logs.<filter foo.bar>@type parserkey_name logreserve_data trueremove_key_name_field true<parse>@type json</parse></filter>
Input: {"key":"value","log":"{\"user\":1,\"num\":2}"}
Output: {"key":"value","user":1,"num":2}
Here is another example:<filter foo.bar>@type record_transformerremove_keys hostname,$.kubernetes.pod_id</filter>
Input:
{ "hostname":"db001.internal.example.com", "kubernetes":{ "pod_name":"mypod-8f6bb798b-xxddw", "pod_id":"b1187408-729a-11ea-9a13-fa163e3bcef1" } }
Output:
{ "kubernetes":{ "pod_name":"mypod-8f6bb798b-xxddw" } } -
Adding a new field
To add a new field to the log, you can consider the example given below. Here, we are adding the machine hostname to the log in the hostname field.<filter foo.bar>@type record_transformer<record>hostname "#{Socket.gethostname}"</record></filter> -
Transforming fields
Here is an example where the field total is divided by the field count to create a new field average.
If you want to transform log fields, you can use the syntax below:Input = {"total":100, "count":10}Output = {"total":100, "count":10, "avg":"10"}<filter foo.bar>@type record_transformerenable_rubyauto_typecast true<record>avg ${record["total"] / record["count"]}</record></filter>
Conclusion
Fluentd provides different options for customizing the way you parse logs. Logstash is a similar log shipper that is equally popular as Fluentd. It follows similar steps for using appropriate syntax and plugins to define how your logs should be parsed. Understanding the basics can help you parse logs based on your use cases.
Site24x7 supports log exports through both Fluentd and Logstash.