Check the health and availability of your Linux servers for optimal performance with Site24x7's Linux monitoring tool.
Disk I/O and space usage issues are common causes of performance degradation in computing systems. Low system speeds can directly affect its ability to retrieve and store information on the disk.
In this article, we’ll learn why disk I/O issues occur, what the Linux commands that can be used to diagnose and troubleshoot disk I/O issues are, and common methods to resolve them.
Disk I/O issues can be a result of storage complexity, application bottlenecks, RAID configurations, response times, and design. Let's take a look at some of these points in detail.
A software-defined or virtual storage layer runs over the underlying physical storage layer. Virtual storage increases the complexity and the number of potential points of failure due to resource contention because it’s unable to read and write data as fast as physical storage.
IO-intensive applications often cause bottlenecks and storage latency issues. They mostly occur when multiple busy applications use the same datastore. The best solution to application bottlenecks is to find a way to handle applications with low storage I/O bandwidth and to use a larger user base.
RAID configuration can be used for storage in an application at both the hardware and software levels. RAID configuration spreads I/O requests and copies of data across multiple disks, increasing storage I/O and reliability. Any problem in the physical device or software that manages the RAID array (for example, due to age, insufficient configuration, or outdated software) can cause slowdowns in I/O requests.
An increase in the response time of a storage I/O can degrade I/O performance. When a storage device takes longer to respond to an I/O request, it indicates that there’s a bottleneck in the storage layer. The additional load on existing storage I/O bottlenecks leads to a consistent lag in response time.
Another cause of slow storage I/O is the poor health of physical storage devices. As hard disks become older or experience a rise in temperature, they’re less likely to achieve their maximum I/O rates, and I/O latency will start degrading. Older disks should be replaced before they deteriorate and eventually wear out, leading to I/O errors.
To identify and fix disk I/O issues, it’s important to understand how they can manifest in your system. Disk I/O issues can impact system performance in a number of ways:
Once we suspect a potential disk I/O issue, we can use metrics to analyze the performance of disk I/O. Some of these important metrics are:
Once we’ve measured and monitored disk performance using the above metrics, we can use commands to identify disk
I/O issues. Three of the most commonly used commands to troubleshoot are df, iostat, and
vmstat.
df commandThe df command is the short-form for the disk filesystem. It’s one of the most basic commands
to troubleshoot disk I/O issues. If space is not available, write operations will fail. The df command
displays the space used and available for all mounted filesystems in Linux. The space used and left is by default
shown in 1K blocks.
Syntax:
df [OPTIONS] [FILES]
Example:
Running the df command, you’ll see an output similar to the one shown below:
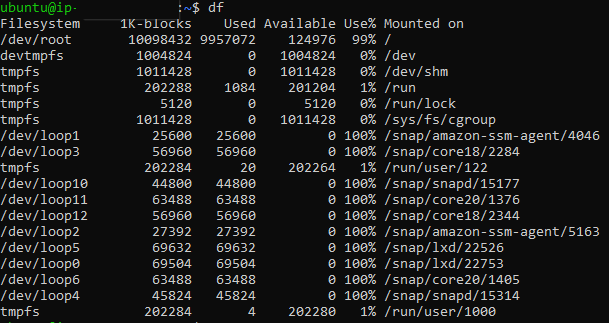 Fig. 1: Output of the
 df command
As you can see in the above output, it displays the following information for all mounted filesystems:
vmstat commandThe vmstat command is also known as virtual memory statistics. It is a system performance monitoring
utility in Linux that displays information about processes, memory, CPU scheduling, disk, and block IO. It shows
users the real-time system performance during a sampling period. If you don’t specify any options, the
vmstat command will by default show the statistics since the system’s last reboot.
Syntax:
vmstat [options][delay [count]]
Delay and count are two important parameters for the vmstat command. They are used to continuously show real-time system performance at the rate of a specified interval for a defined number of times.
vmstat
command runs infinitely.Example:
Running the vmstat command will give you an output similar to the one shown below:
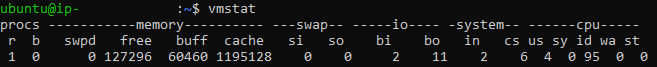 Fig. 2: Output of the
 vmstat command
This is the basic output that displays overall statistics. You can also specify the delay and count parameters to
display real-time statistics continuously. For example, running vmstat 5 3 will display the below 3
real-time statistics, each after a 5-second interval.
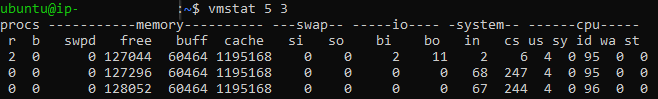 Fig. 3: Real-time output of
 vmstat
command
The above output is divided into four areas. Our main focus is the io section. It shows two columns:
We can use this information to analyze when the data is being heavily written or read. We can then use another
command, like iostat, to see which hard drive was taking the load and try to find the root cause of the
disk I/O issue.
iostat commandAs its name suggests, the iostat command is used to monitor input/output statistics for a system. It
generates these reports by monitoring the relationship between the active time duration of the devices and their
average transfer rates. The generated reports can be used to update the system configuration to achieve a better
balance of input/output between various available physical disks.
Syntax:
iostat [option] [interval] [count]
Similar to what we’ve seen with the vmstat command, the interval and count parameters are used to show real-time updates infinitely or for specific counts only.
Example:
Running the iostat command will give you an output similar to the one shown below:
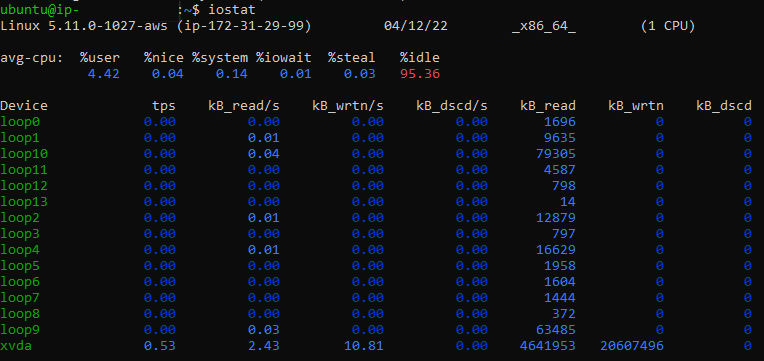 Fig. 4: Output of the
 iostat command
The default reports of output display the CPU statistics and the device input/output statistics from the time the system was last rebooted. Of the two sections, we are more concerned with the Device section. It generates the following information for all the partitions or devices:
The above examples indicate disk performance issues in the system. You can implement several software and hardware fixes to mitigate disk I/O and space usage problems.
Disk space usage and I/O issues can significantly deteriorate the performance of a system. You must troubleshoot and find the root cause of problems like high space usage or slow I/O requests before you can take appropriate measures to fix them.
Linux has various commands that you can use to narrow down what’s causing your disk I/O issues. The three most commonly used commands discussed here—df, iostat, and vmstat—are enough to help you find the root cause. While we’ve covered a number of helpful software fixes for disk I/O issues, it’s good to remember that sometimes hardware updates offer the best permanent solution.
Site24x7's Linux server monitoring agent tracks key disk I/O metrics including read/write throughput, IOPS, latency, and queue length. The agent collects data at configurable intervals and displays trends through intuitive dashboards, helping you identify I/O bottlenecks before they impact performance. Site24x7 supports both custom (static) thresholds and dynamic thresholds (AI-based anomaly detection) for disk I/O monitoring.
Yes, Site24x7 allows you to set threshold-based alerts for disk I/O metrics such as disk utilization percentage, read/write latency, and I/O wait time. You can configure warning and critical thresholds to receive notifications via email, SMS, or integrations before I/O issues affect applications. Site24x7 supports both custom (static) thresholds and dynamic thresholds (AI-based anomaly detection
