Check the health and availability of your Linux servers for optimal performance with Site24x7's Linux monitoring tool.
Are your Linux servers running sluggishly or completely freezing during peak traffic? High CPU load is a common culprit. Whether an application is running on a server or a local machine, monitoring CPU utilization and CPU load is critical for optimizing system performance and ensuring a seamless end-user experience.
This article will explain the fundamental differences between CPU load and CPU utilization, how to accurately monitor CPU load with standard and advanced Linux commands, the real-world impact of high CPU load, and actionable steps to bring it under control.
CPU utilization and CPU load are frequently used interchangeably, but they measure different things. CPU utilization is a snapshot of the percentage of CPU capacity currently in use. As documented in Site24x7's performance metrics, CPU utilization can simply be calculated as 100 - idle time.
CPU load, on the other hand, is a measurement of how many processes are either currently executing or waiting to be executed by the CPU over a specific timeframe. Think of it like a highway: CPU utilization is the speed of the cars, while CPU load is the total volume of traffic, including cars stuck in a traffic jam waiting for their turn to move.
Commands like uptime or top display CPU load averages for the last 1, 5, and 15-minute periods. High load averages indicate an overloaded CPU with processes queuing up. The significance of this number scales directly with your CPU cores: a CPU load average of 1.0 means a single-core CPU is fully occupied, while a 4-core CPU at a 1.0 load average is only at 25% capacity.
If the load average exceeds the total number of cores, processes will start to queue, leading to noticeable performance degradation.
While load averages (1, 5, and 15-minute intervals) provide a high-level view, there are other granular metrics that help identify the true nature of the CPU load:
Short bursts of high CPU load are normal during intensive tasks like software compilation or heavy database queries. However, a consistently high CPU load over extended periods can lead to severe operational issues:
When you notice a high CPU load, your immediate goal is to identify the root cause. Several built-in Linux commands can help you monitor system load and identify resource-heavy processes.
top commandThe top command provides a real-time, dynamic view of a running system. It is the go-to utility for performance monitoring.
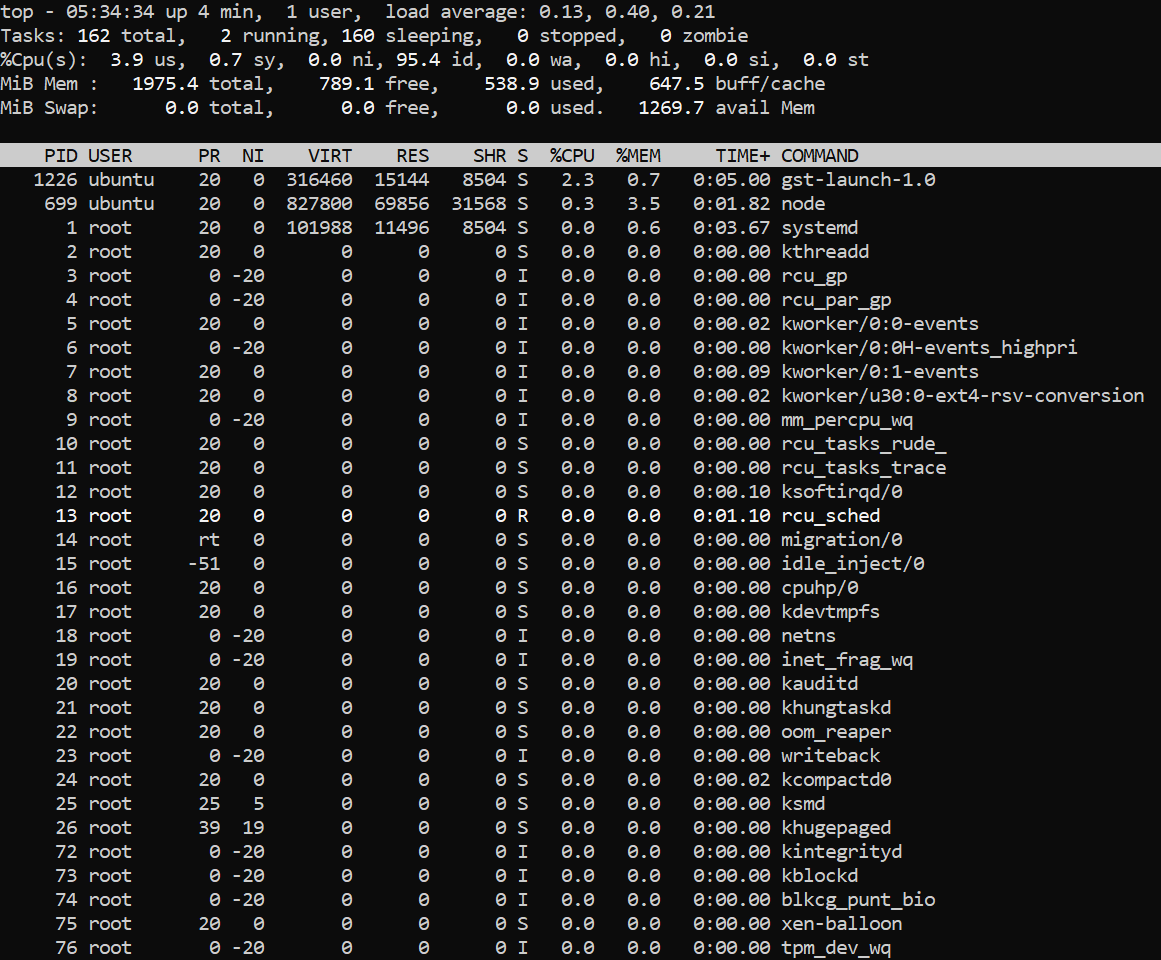 Fig 1: Output of the top command
The top section displays system summary information, including uptime, user count, and load averages (e.g., 0.13, 0.40, 0.21 for 1, 5, and 15 minutes). If these averages are below your total CPU core count, your system is not overloaded. The bottom section lists processes, which can be sorted by CPU or memory usage to spot anomalies instantly.
uptime commandIf you only need a quick snapshot of the load averages without the process list, the uptime command is perfect.
 Fig 2: Output of the uptime command
This single-line output is frequently used in automated scripts to check if the load average has crossed a specific threshold before triggering an alert.
ps commandThe ps command is highly customizable and useful for finding exactly which processes are eating up resources.
To view and sort the top 10 most CPU-intensive processes, run:
ps -eo pcpu,pid,user,args | sort -k 1 -r | head -10
Unlike top, ps is a static snapshot, making it ideal for logging CPU hogs to a file during an intermittent spike.
Modern system administrators often turn to enhanced tools to diagnose high CPU load more effectively:
top that provides color-coded graphs for each CPU core, making it easier to visualize load distribution.sysstat package, iostat is crucial for diagnosing high I/O wait times. If your CPU load is high but utilization is low, running iostat -xz 1 will reveal if the CPU is bottlenecked waiting for slow disks.Once you've identified the cause, consider the following fixes to reduce high CPU load:
kill command (e.g., kill -9 <PID>) to stop it and free up the queue.CPU load is a critical performance metric that provides a broad view of your system's processing health. By understanding the distinction between load and utilization, and by using tools like top, uptime, and iostat, you can proactively detect and troubleshoot CPU bottlenecks.
High CPU load can severely impact user experience, but with regular monitoring and swift troubleshooting, you can keep your Linux servers running efficiently.
Site24x7 Linux monitoring provides comprehensive tracking of CPU usage, user/system/idle time, and load averages across all your servers in real-time.
Yes, you can configure custom thresholds for CPU utilization and load averages in Site24x7 and receive immediate alerts via email, SMS, or other third-party integrations.
Site24x7 tracks process-level CPU and memory usage, allowing you to quickly pinpoint the specific processes or applications consuming excessive CPU resources.
A normal CPU load average depends on your core count. A load average of 1.0 on a single-core machine means it is at 100% capacity. Generally, a load average equal to your total number of CPU cores is considered full utilization without queuing.
