Greetings!
We are pleased to introduce a new plugin integration to monitor Windows Performance Counters.
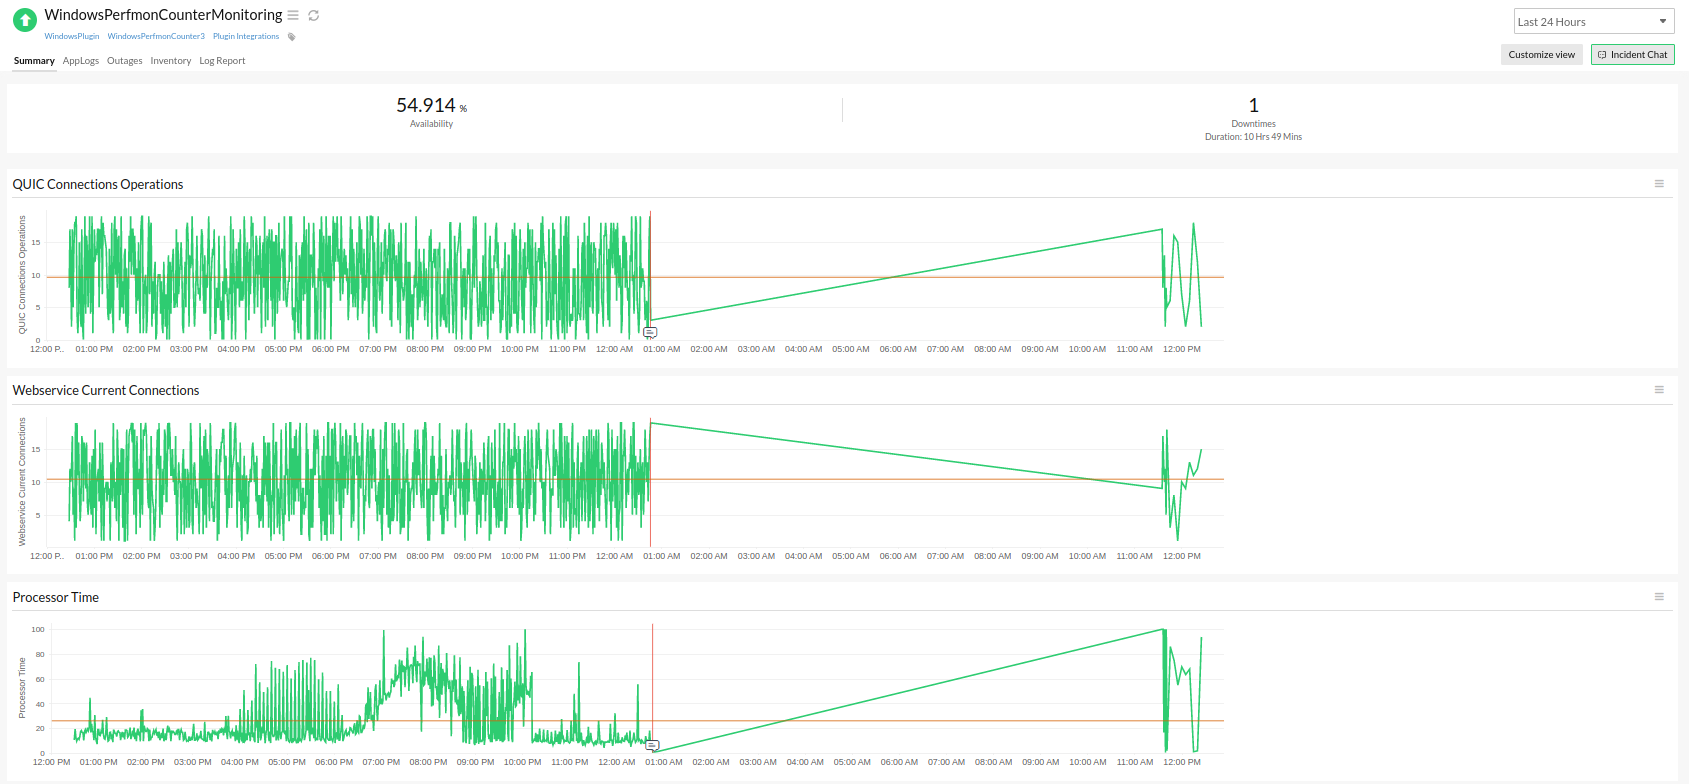
Windows Performance Counters offer an interface for collecting various servers and their application's metrics like CPU, memory, transactions, disk usage, app pools, process count, and number of requests of a web server like IIS. These can be added to emit performance data of different services, processes, and applications running in the Windows server.
Site24x7's Windows Performance Counter monitoring plugin collects data from these performance counters so that you can view and analyze them in combination with metrics from your applications like IIS, ASP.NET, C#.NET, and MSSQL to identify the root cause of issues faster.
With our Windows Performance Counter monitoring plugin, you can:
- Gain insights into the performance of specific performance counters related to applications and correlate them with overall server metrics. For example, you can add a performance counter to monitor your IIS application's pool performance like CPU and memory. This will help to identify website pages running on IIS that consume high CPU/memory for loading content so that you can optimize its performance.
- Detect issues and bottlenecks (such as high resource utilization) affecting the performance of Windows applications and services running in your system.
Install Site24x7's Windows Performance Counter monitoring plugin to view data from Windows Performance Counters in the Site24x7 web client and improve visibility of the performance of your system infrastructure. Start monitoring and leave your feedback in the comments below.
Check out our growing list of more than 100 plugin integrations to monitor your entire application stack.
Note:
To view and add performance counters on a Windows server, follow the steps below:
1. Open the Start menu type Run.
2. In the Run dialog box, type perfmon and click OK. A Performance Monitor window opens.
3. On the left pane, under the Monitoring Tools folder, select Performance Monitor. A graph appears.
4. Right-click on the graph region and select Add Counters. A dialog box appears.
5. From the list, select desired Performance Counters for the server, IIS, MSSQL, C#.Net, MS Teams, and more.
Until next time, happy monitoring!
Like (1)
Reply
Replies (0)