In general, you can view the time taken by external components using application dependency maps. But did you know you can also find out which specific host an issue is stemming from?
Let's analyze the time taken by an external component, MySQL queries, in Zylker.
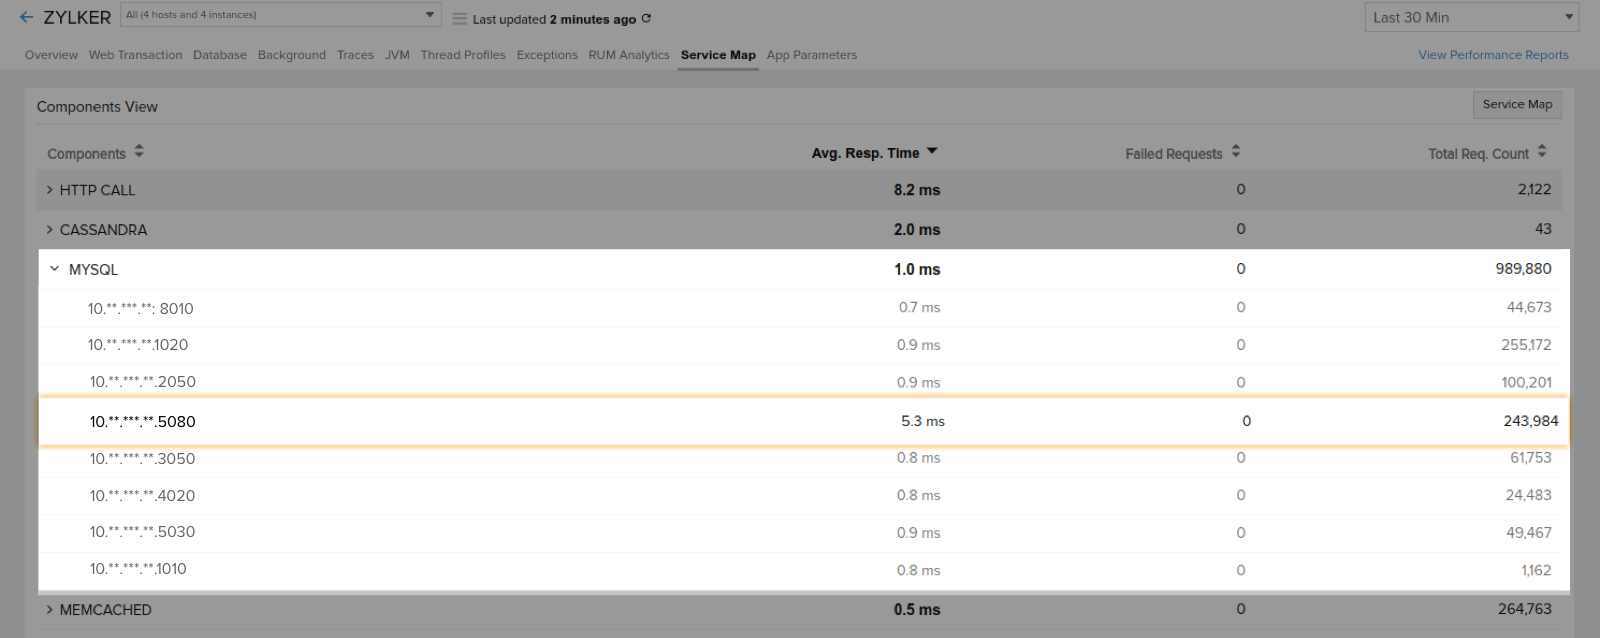
The total response time taken by all the SQL queries is around 1.0 ms. Inspecting further, we find that SQL queries to 10.**.***.**:5080 alone have taken around 5.3 ms. In this case, transactions made by users belonging to this cluster may require some attention.
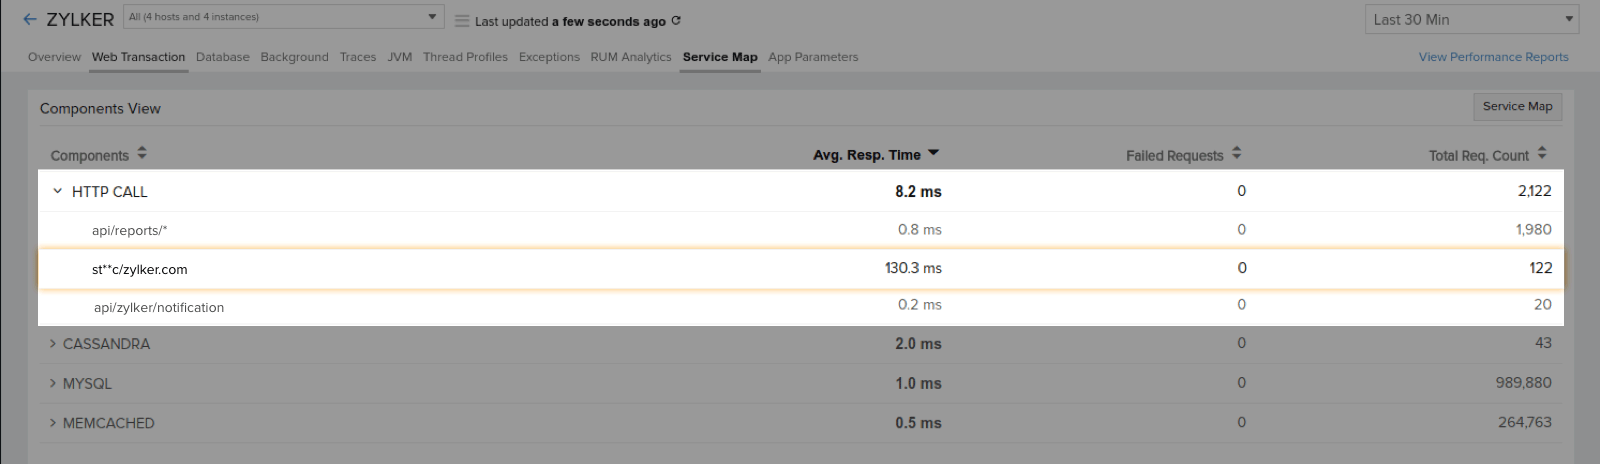
Let's look at another scenario in the same application. The average response time taken by all HTTP requests comes to about 8.2 ms. When we look closer, we can see that calls made to st**c/zylker.com alone have taken 130.3 ms, which is much higher than average. In this case, transactions accessing that particular domain or site are experiencing slowness. Transactions in this host contribute to the performance degradation of this component.
This host-wise breakdown helps in identifying the root cause of slow transactions with respect to external components.