In APM Insight, slow transactions are displayed as a list with their corresponding trace. By inspecting the transaction trace, we can find out the total number of methods tracked by the agent as well as the time taken by the individual methods.
By default, the APM Insight agent tracks known frameworks and methods. However, in the case of user-defined classes or frameworks, the agent classifies them as "un-instrumented blocks of code." So, how is this useful for debugging?
Let's use the transaction update.do, which takes a total of 12 seconds to execute, as an example.
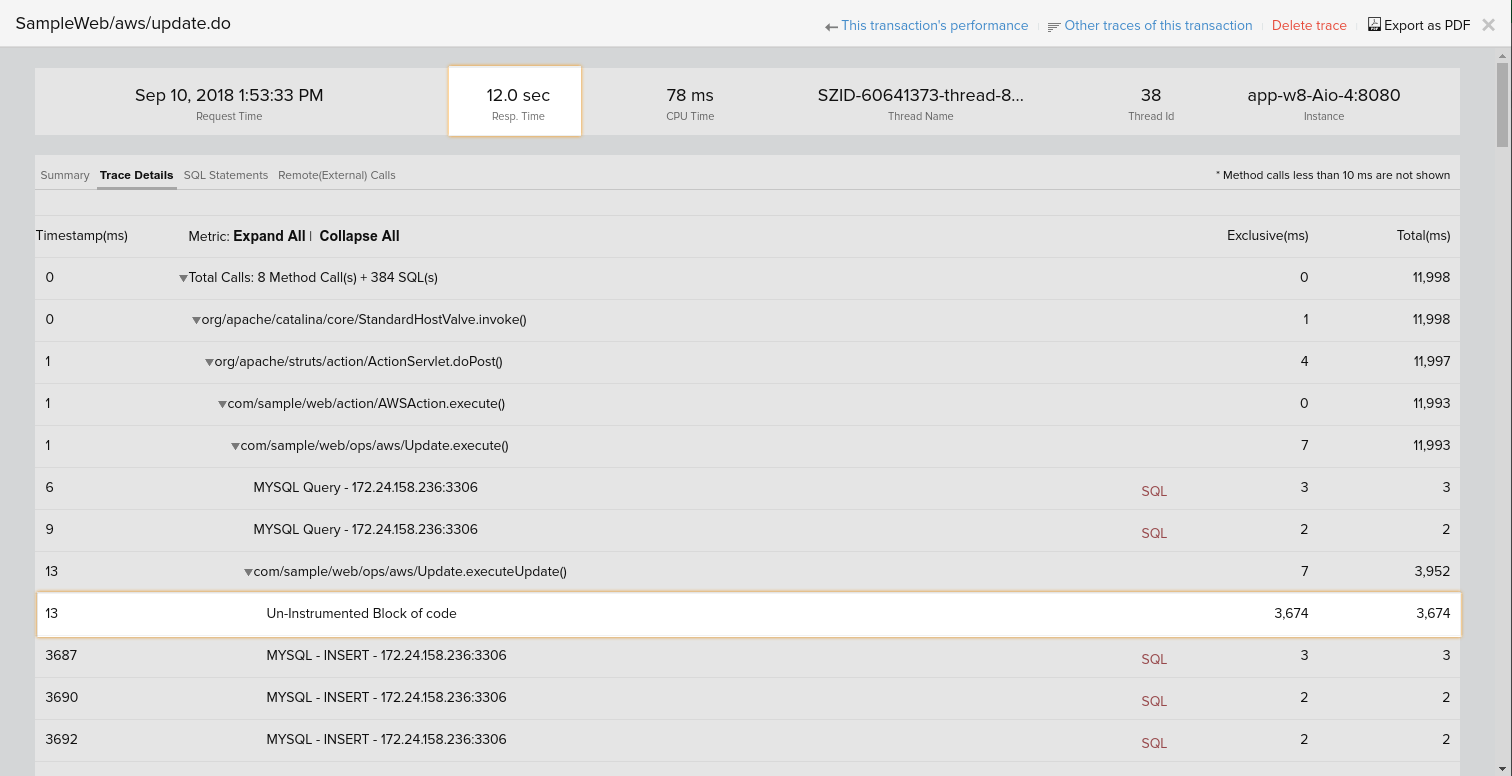
When we look closer, we find that the method, Update.executeUpdate() has taken a total of 4 seconds, of which the un-instrumented block of code inside this method alone took 3.6 seconds. Without this un-instrumented block of code, it's easy to assume that the parent function—Update.executeUpdate()—is responsible for the increase in response time. In this case, debugging is a wild goose chase; this is where un-instrumented blocks of code come in handy.
To further drill down into such un-instrumented blocks of code, you can use custom instrumentation.