Added conditions for configuring thresholds
Threshold configuration is no longer restricted to conditions that exceed a certain value. For instance, you can now receive alerts when your printer ink goes below a preset value. Threshold alerts for performance counters and interface-level attributes can now be configured using one of the following conditions: <, <= , >, or >=.
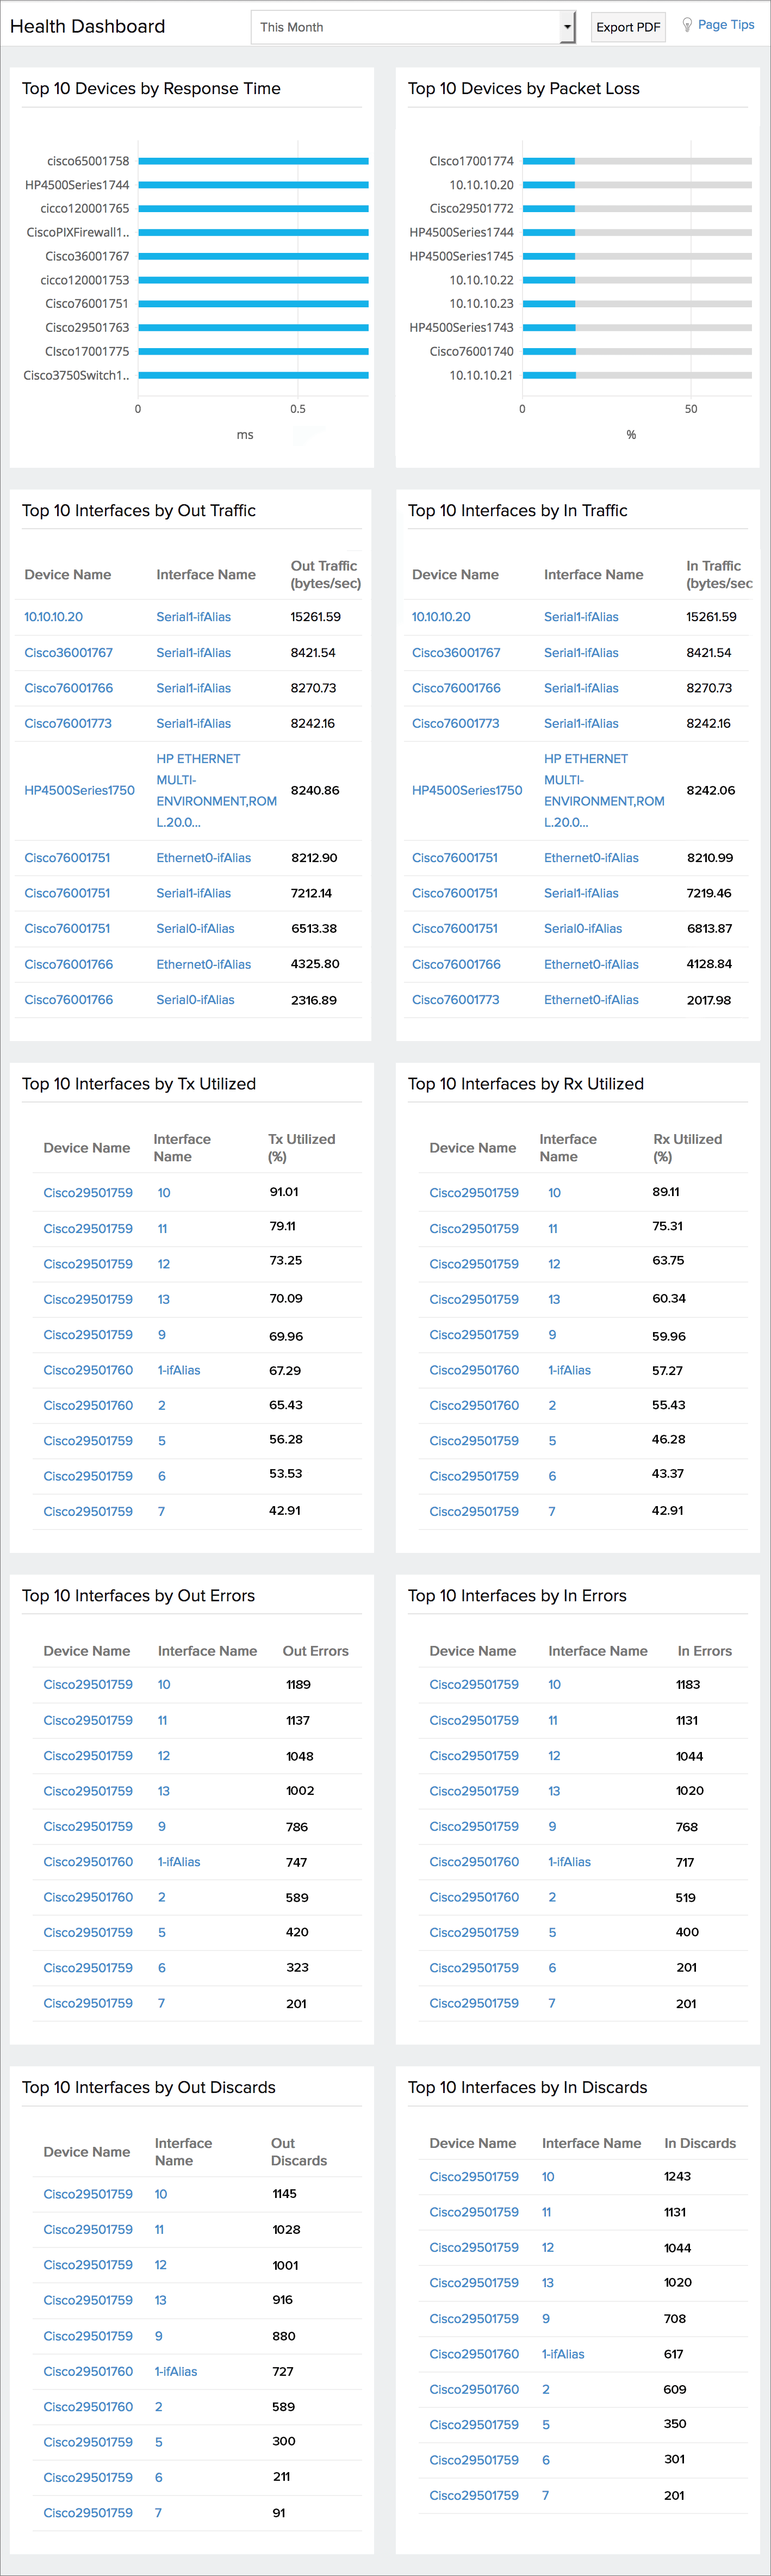
New Health Dashboard for network devices and interfaces
Get a better understanding of your network performance with stats on the top performing devices and interfaces in your network based on a few key metrics. The Health Dashboard offers information about the crucial nodes in your network, all wrapped in a clean, intuitive package.
View a graph of the top network devices and analyze their performance based on response time and packet loss. You can also see the top 10 network interfaces under each of the following categories: out traffic, in traffic, transmitting bandwidth utilization, receiving bandwidth utilization, out errors, in errors, out discards, and in discards.
You can also export your results in the PDF format.
Use case: In an environment with thousands of network interfaces, network slowness is all too common. Identifying which interface is using the most bandwidth can help you manage your network.
You can learn more about this new dashboard here. As always, happy monitoring!