We had a situation where we have a handful of monitors (7 among two customers so far) that have not polled for up to 4 months.
In two of those cases I know it's legitimate - the customer had issues and the monitor did not trigger.
This is really not cool. I need to be told when the monitor does not execute when it's supposed to.
Is there a monitor to monitor for when the monitor fails to monitor? Quis custodiet ipsos custodes?
bdunbar
Mission
@missioncloud.com (email id masked by Community Team - GKM).
Hi Brian,
Our apologies for the issue you may be facing. Our support will look in to it and get to the root cause.
Sorry, we will do our best to ensure you do not need to monitor the monitoring system.
Regards
Gibu
Thanks for the quick reply. I have also opened a support ticket (754968 ) to address the issue. On querying with the API it appears we have 667 monitors that have stopped polling.
So .. kinda appears that I do need to setup something on my side to watch the monitors.
Hi Brian,
Thanks for raising this concern .
We checked the cases , with respect to AWS and found issues with respect to one of your SES monitor (verification failure of mail address) and two of your EC2 monitors(due to a new error code thrown from AWS API). We have handled both the problems and have made sure that this may not occur again in future.
You shall be rest assured about the check frequency from our side.
Kindly contact us for any queries.
Regards,
Ananthkumar K S
> You shall be rest assured about the check frequency from our side.
With respect, no I will not be assured. Nor can I rest until I have an crafted an independent means, one that I trust because my team will be running it, of verifying your product is performing as expected.
This sucks for both of us. Sorry.
My rough solution is to poll the API for monitor status, do some bash work with $date and fire off an email to open a ticket in my ticket system.
The API bit looks like this - hopefully this will save you some dev time. This gets you a tab separated doc you can parse.
curl "www.site24x7.com/api/msp/monitors/status" \-X GET \-H 'Accept: application/json; version=2.0' \-H 'Authorization: Zoho-authtoken token' | jq -r '.data[] | [.customer_name, .monitor_id, .monitor_name, .status_name, .last_polled_time] | @tsv' > monitors.tsv
Hi Brian, Tom,
We would like take this opportunity to point of some of the instances when data collection may not take place and ways in which we have handled them and will handle in future. I'm sure this will be helpful for others as well. (These have been already communicated to Brian by Muralee our support lead, listing it out here for the benefit of the community at large).
1. Configuration errors
Configuration error occurs at the time of adding the monitor. When we add a monitor and if the resource is unavailable or if the data collection returns an error, the monitor is marked as in 'Configuration Error'. Data collection will not happen when the monitor is in Configuration error state and hence the monitors are shown as last polled at the time of discovery/adding the monitor. One the cases was for EC2 for which we fixed as Ananth said.
2. On-premise Poller data collection
When on-premise pollers are down, no data collection takes place for those monitors which are data collected by that poller. When a poller is down, the monitors configured for the specific poller are retained in the last known status(in Brian's case 'Up') till the poller comes up and starts the data collection. This is done to avoid false alerts as the monitored resource could still be up, but the only the poller is down. However, when a poller is down we send alerts to the user alert groups configured for the poller. As a first troubleshooting step check access permissions for domains and port access mentioned in this KBase. If access are given, poller logs would help us troubleshoot faster.
3. For Domain Expiry monitors & SSL monitors
Generally when there is an exception, data collection will not happen for that data point. In Brian's case some of the domains reported a 'DOMAIN_EXPIRY_PARSING_ERROR.' exception, where site24x7 did not recieve any data regarding the domain. During DC, Site24x7 will use the registry and registrar details to fetch the domain information. In this case only the registry information was available and registrar information wasn't available. This resulted in a parsing error, because of which the data did not get stored in our database and the last poll showed 4 months ago. There was also a SSLHandshakeException for some of the SSL Certificate monitors.
Also, domain expiry monitors can get "Connection reset" error. This means that the target server has reset the connection initiated by the monitoring servers. Some of the reasons could be,
- High Web traffic
- Target server overload
- Temporary network issues in between the network.
We'll further investigate on this issue and rectify it and will also update here.
4. Suspended monitors
For any monitor that is suspended no data collection takes place.
A note on the current status API usage. suspended_required=false is the default value. Switch the parameter to true only if needed as it would return monitors including those that are suspended.
Thank you Brian for bringing to our notice the problems faced. This has only made our product better. We are not only taking more preventive measures in our data collection engine so that there are minimal to no disruption to the monitoring system but also capturing it proactively so that end users not affected.
-Jasper
Site24x7, Product Manager
Jasper,
I sure do appreciate your team's timely response to the support ticket - it's been very helpful!
Items 1 and 2 are on us, that's for sure. We need to take a closer look out our on-premise polling monitoring, ensure we're seeing the email alerts they send out. Likewise 4, for my not excluding suspended monitors in the initial ticket.
A question about API. I can gather the details we need for monitor health, parse the returns and generate tickets internally to address. All good there, I roughed out a bash script that we're improving now.
It occurs to me that it would be handy to have this presented in a dashboard view - X monitors in state disabled, Y monitors in error for this reason or that. As you know, we use the MSP version of 24x7 and currently we have over a hundred dashboards for as many customers. When one looks at the overview one does not *see* the problems at a glance. Which I think is how all of this got out of hand in the first place.
Your thoughts?
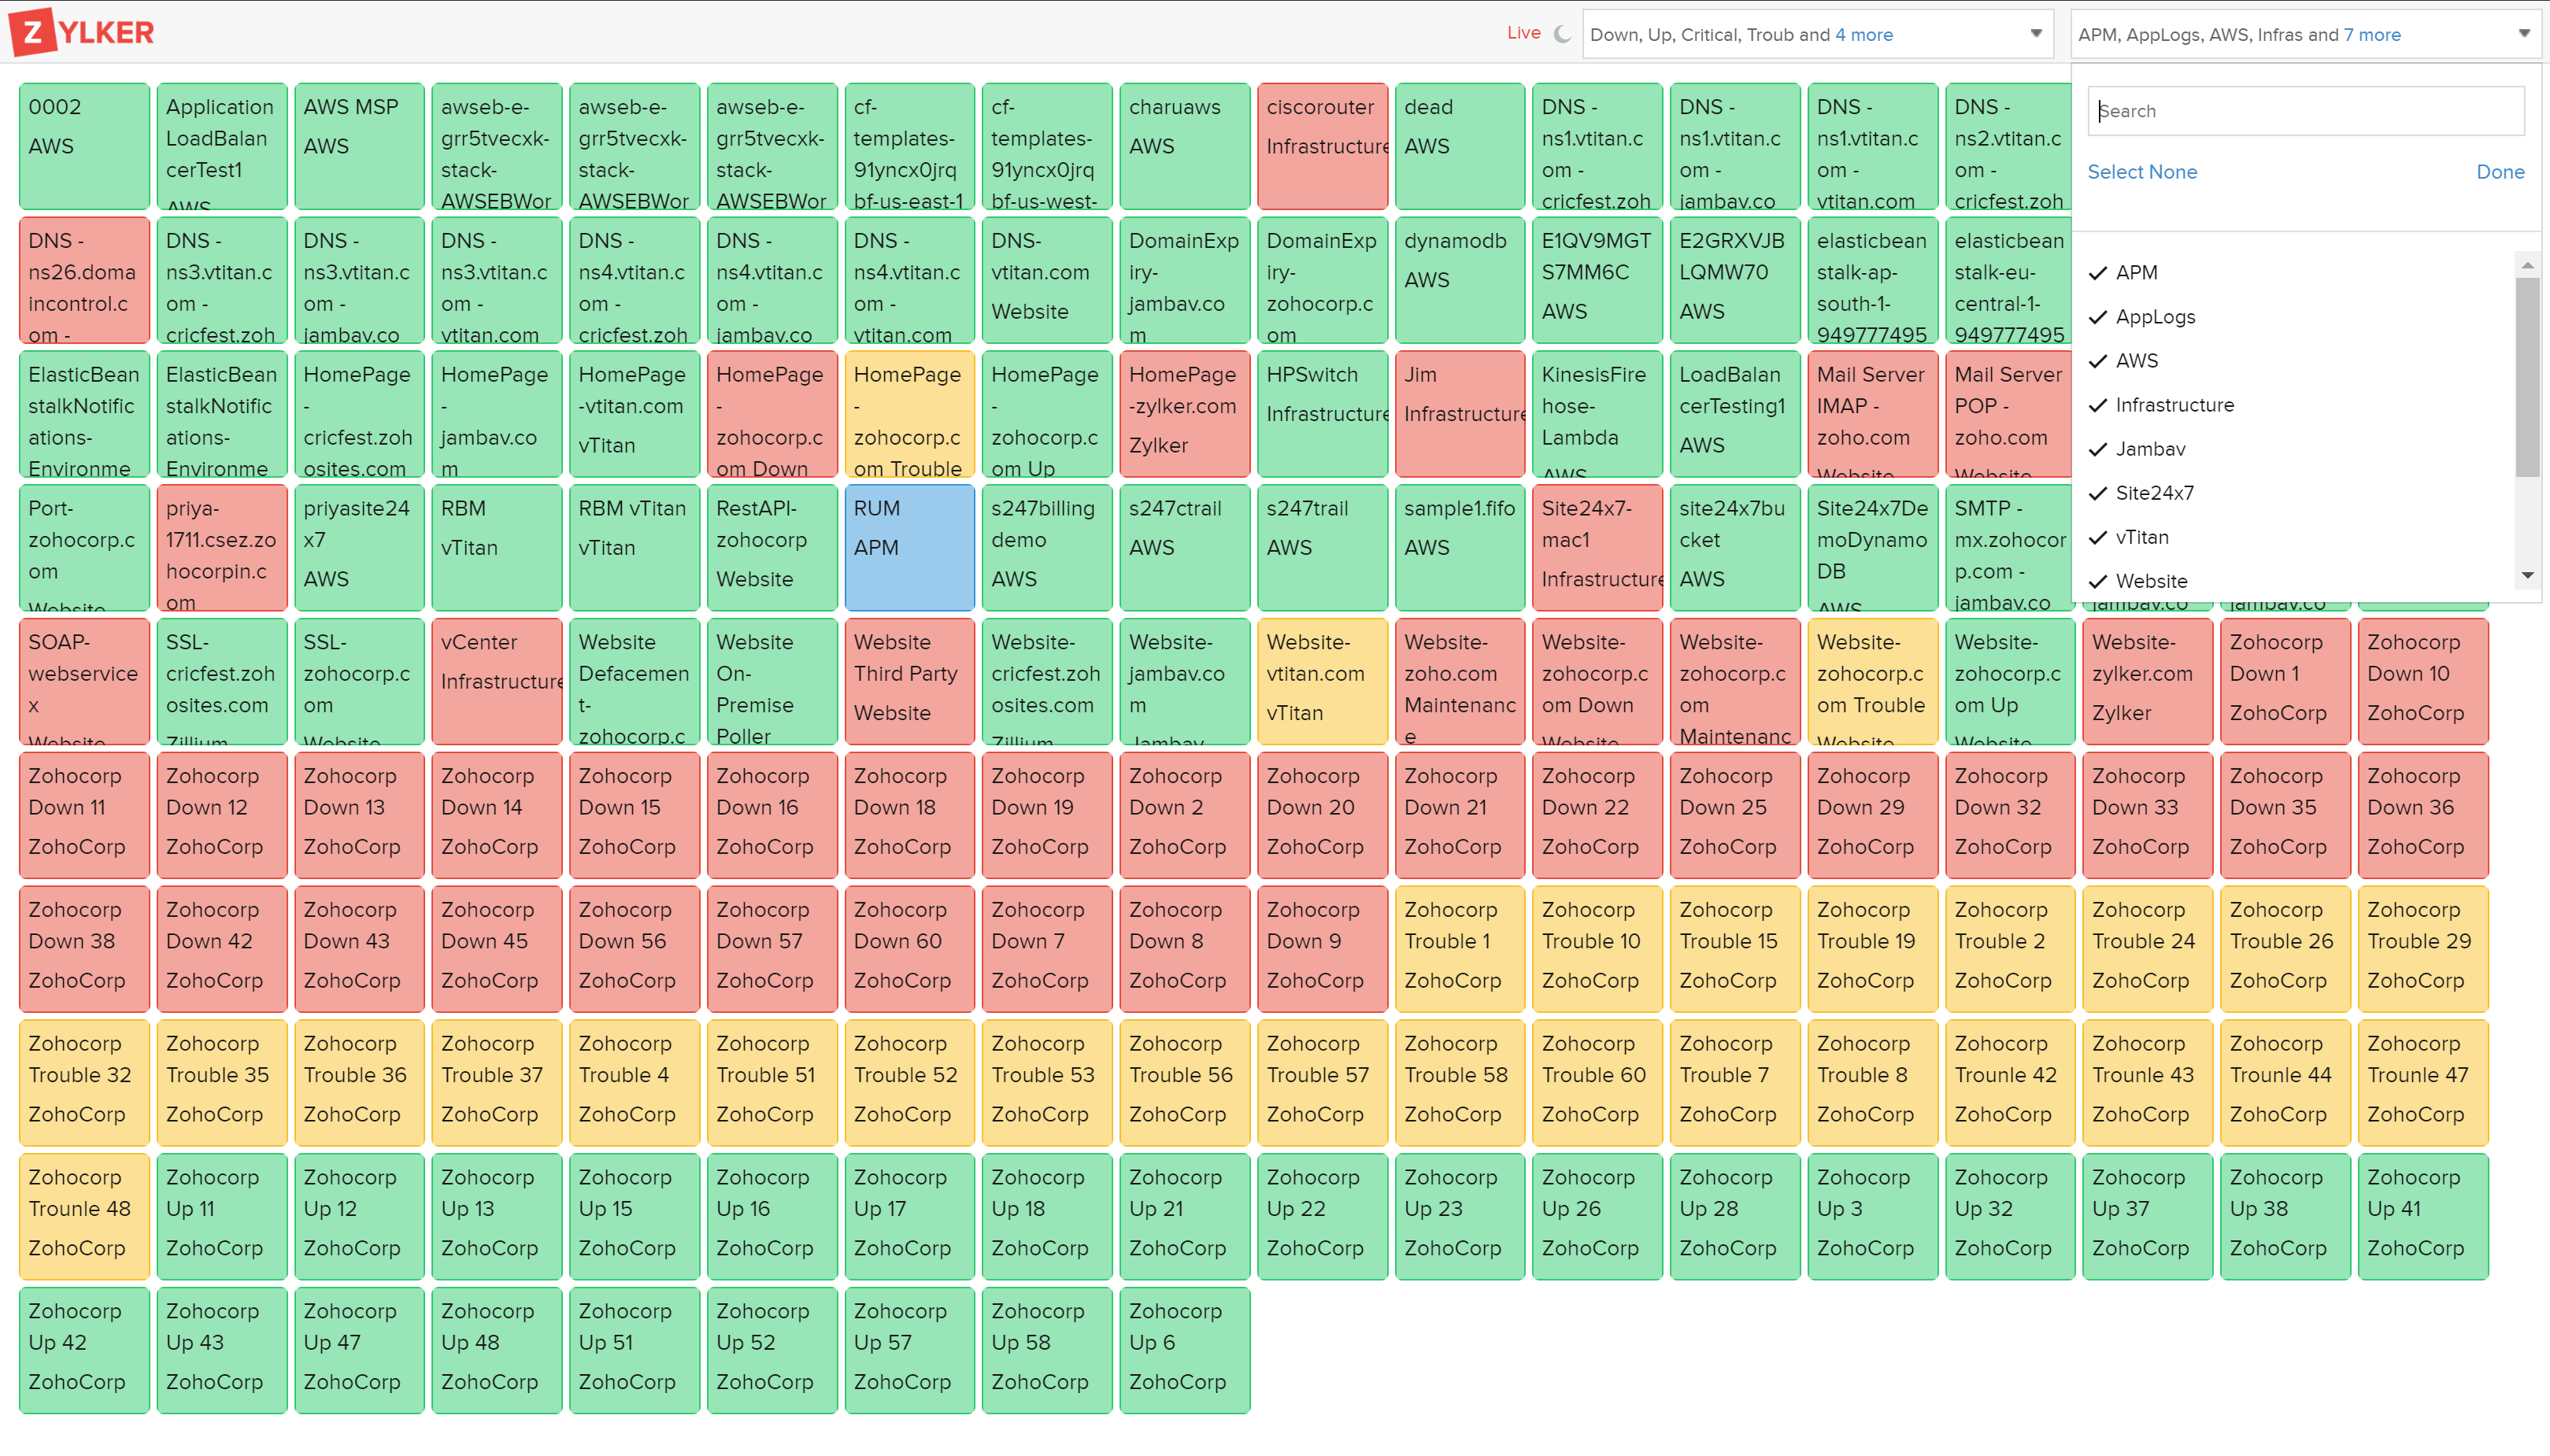
Hi Brian,
One way is to use the NOC view, which will show all monitors current status (including suspended) for all customers. Its available at the top right as a NOC view icon.
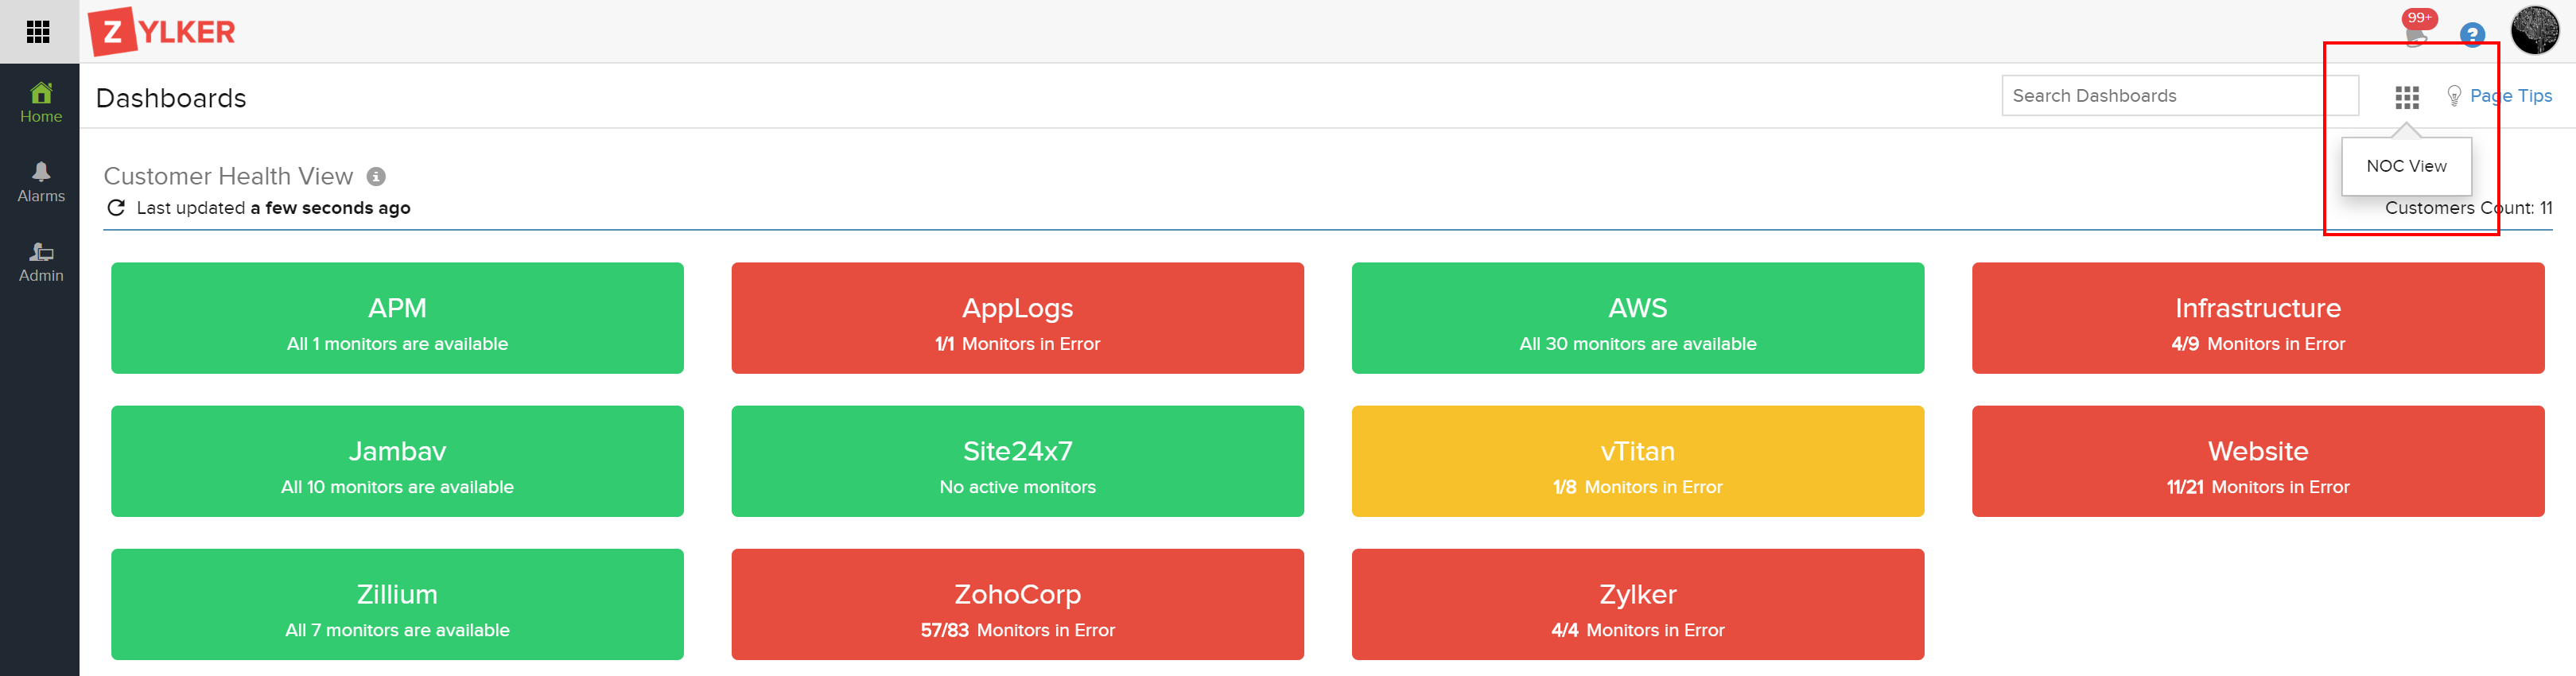
The NOC view has filters at the customer level with multi-select. This can act as a single dashboard for all your customer current status.
The other way way to have the current status of all customers in a dashboard is by creating a custom dashboard at the MSP level. In your MSP home page > Home > Custom Dashboard (after customer health view ) > Create New.
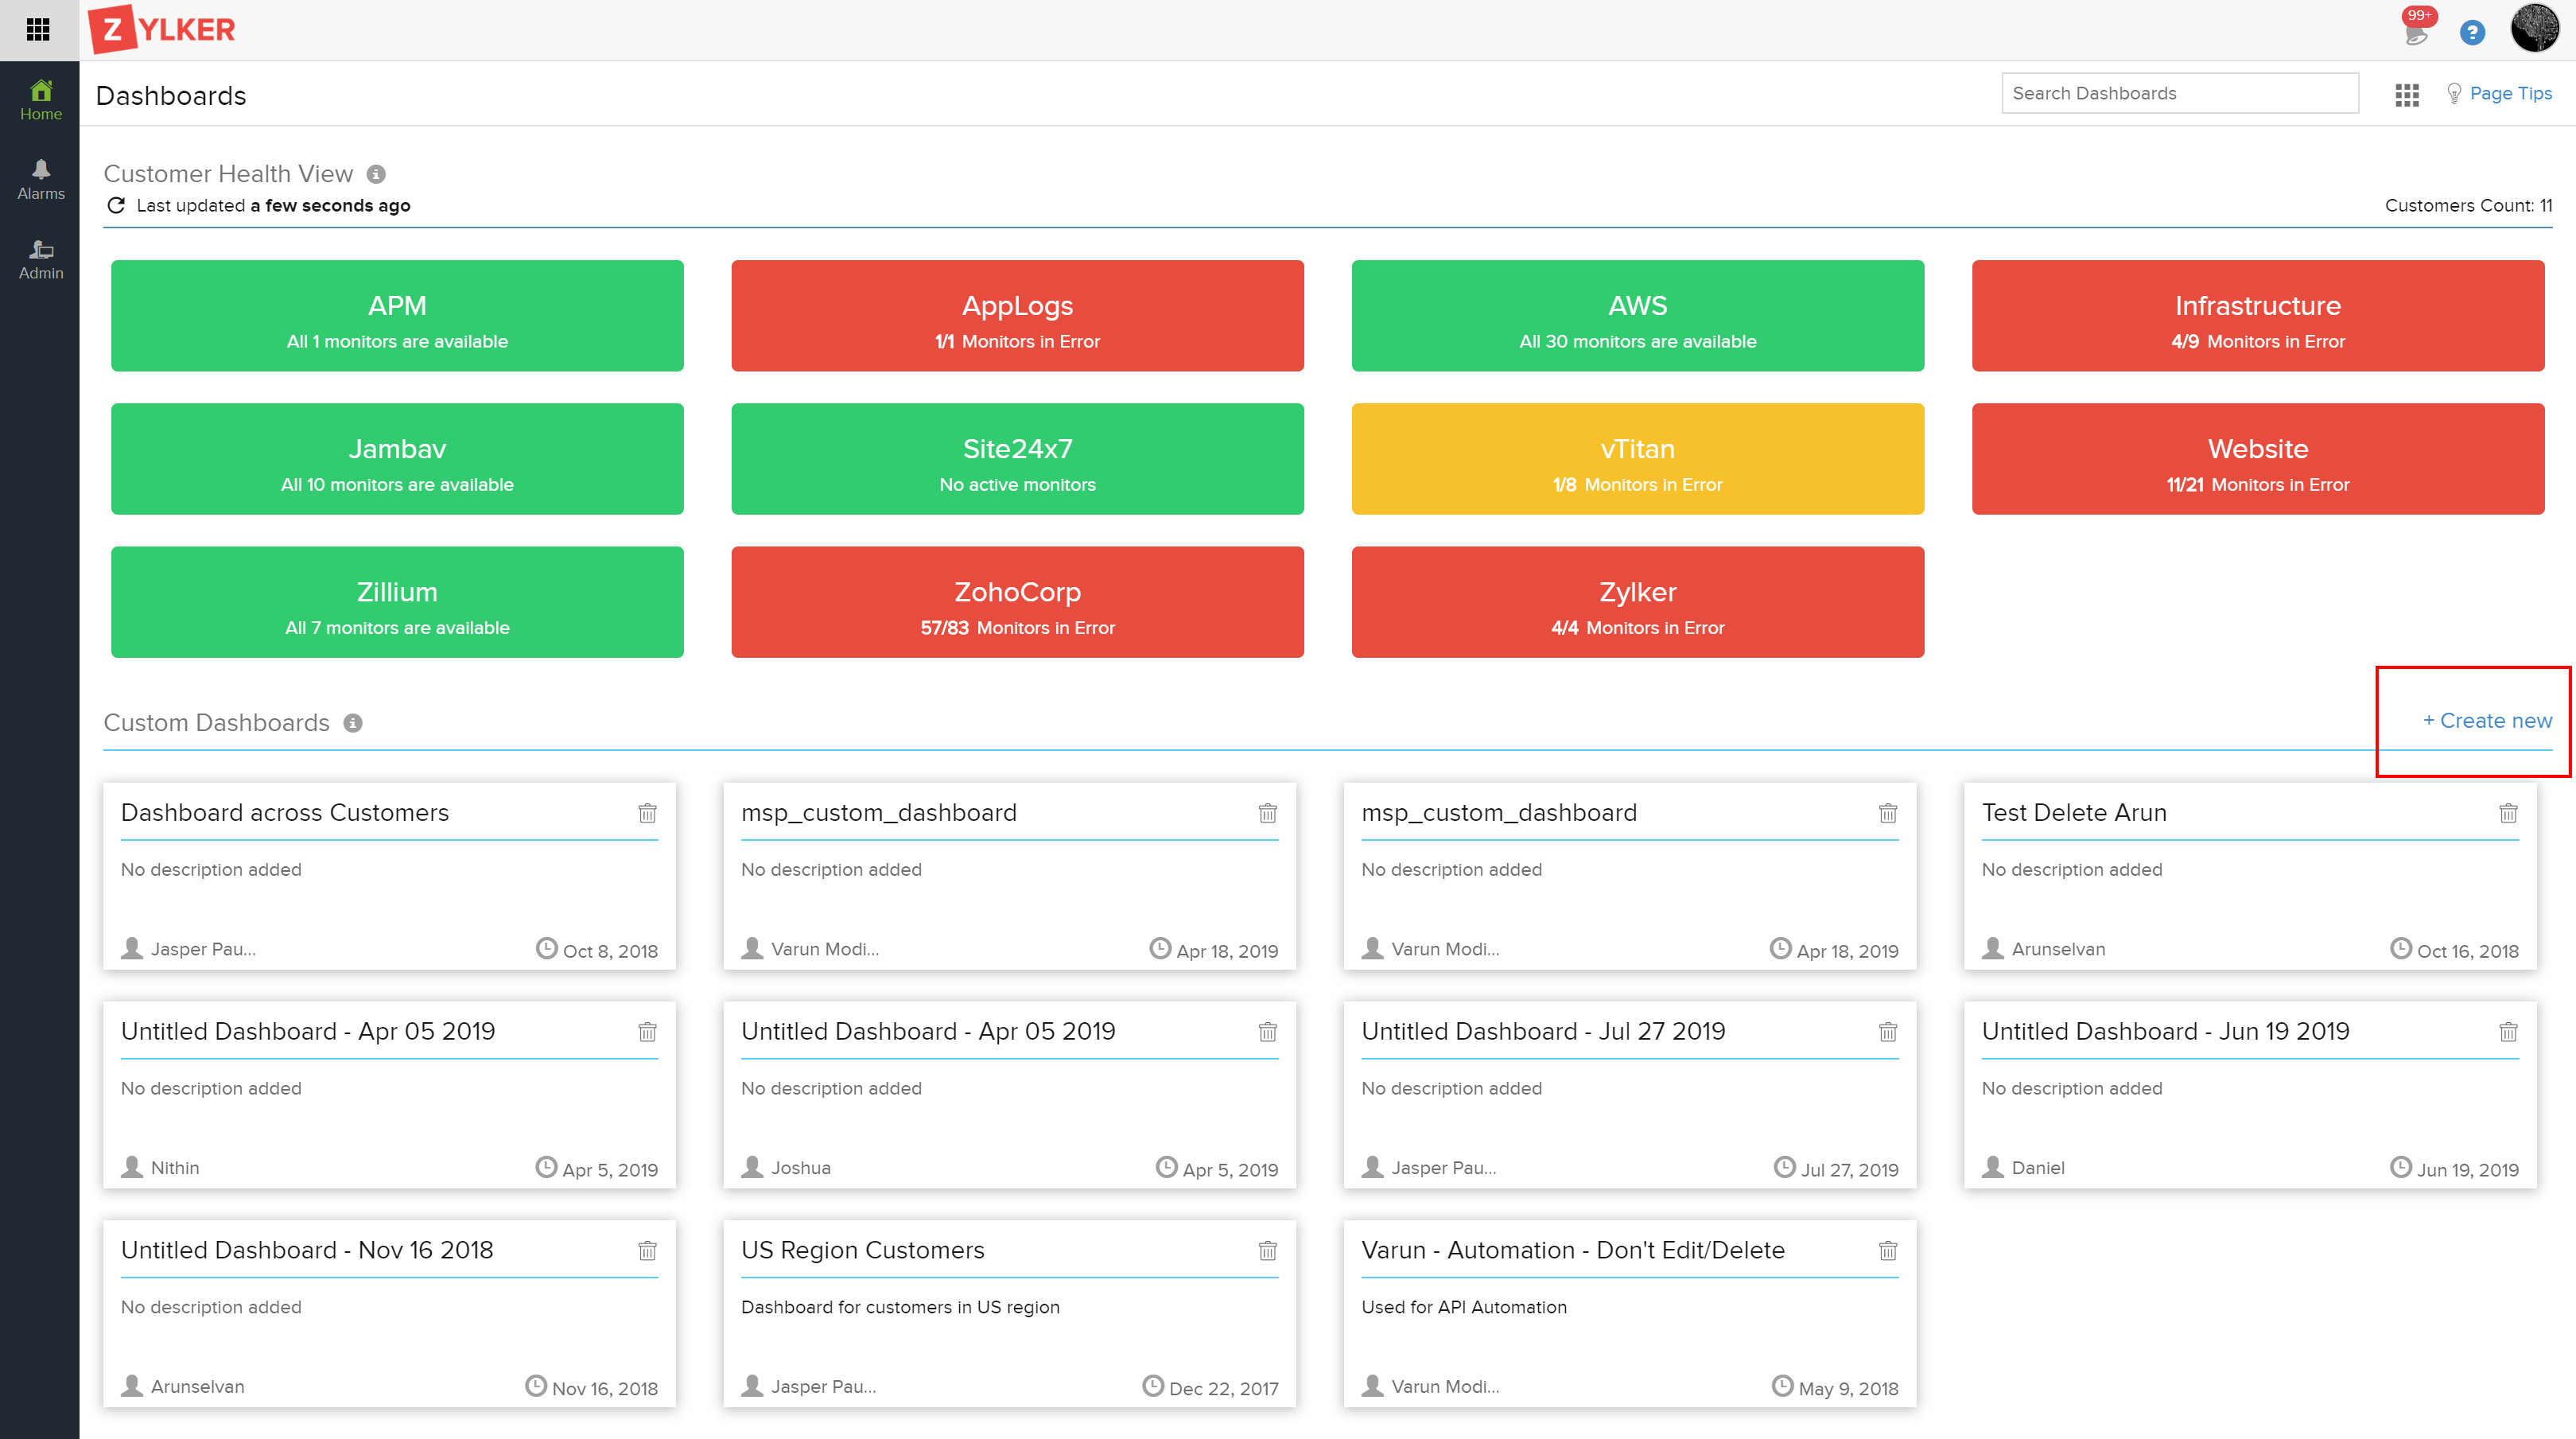
In the edit dashboard Select current status widgets > Select customer > drag and drop the widget in the dashboard. Once you finish your widget layouts > click on the 'Done customizing' button at the top. This should give you an overview of the current status of each of your monitors grouped by customers as widgets. You can also granularize based on monitor type (choose resource type as monitor type) of your customer based on your need. If you are projecting it on a big screen, you can have a 10 column size layout
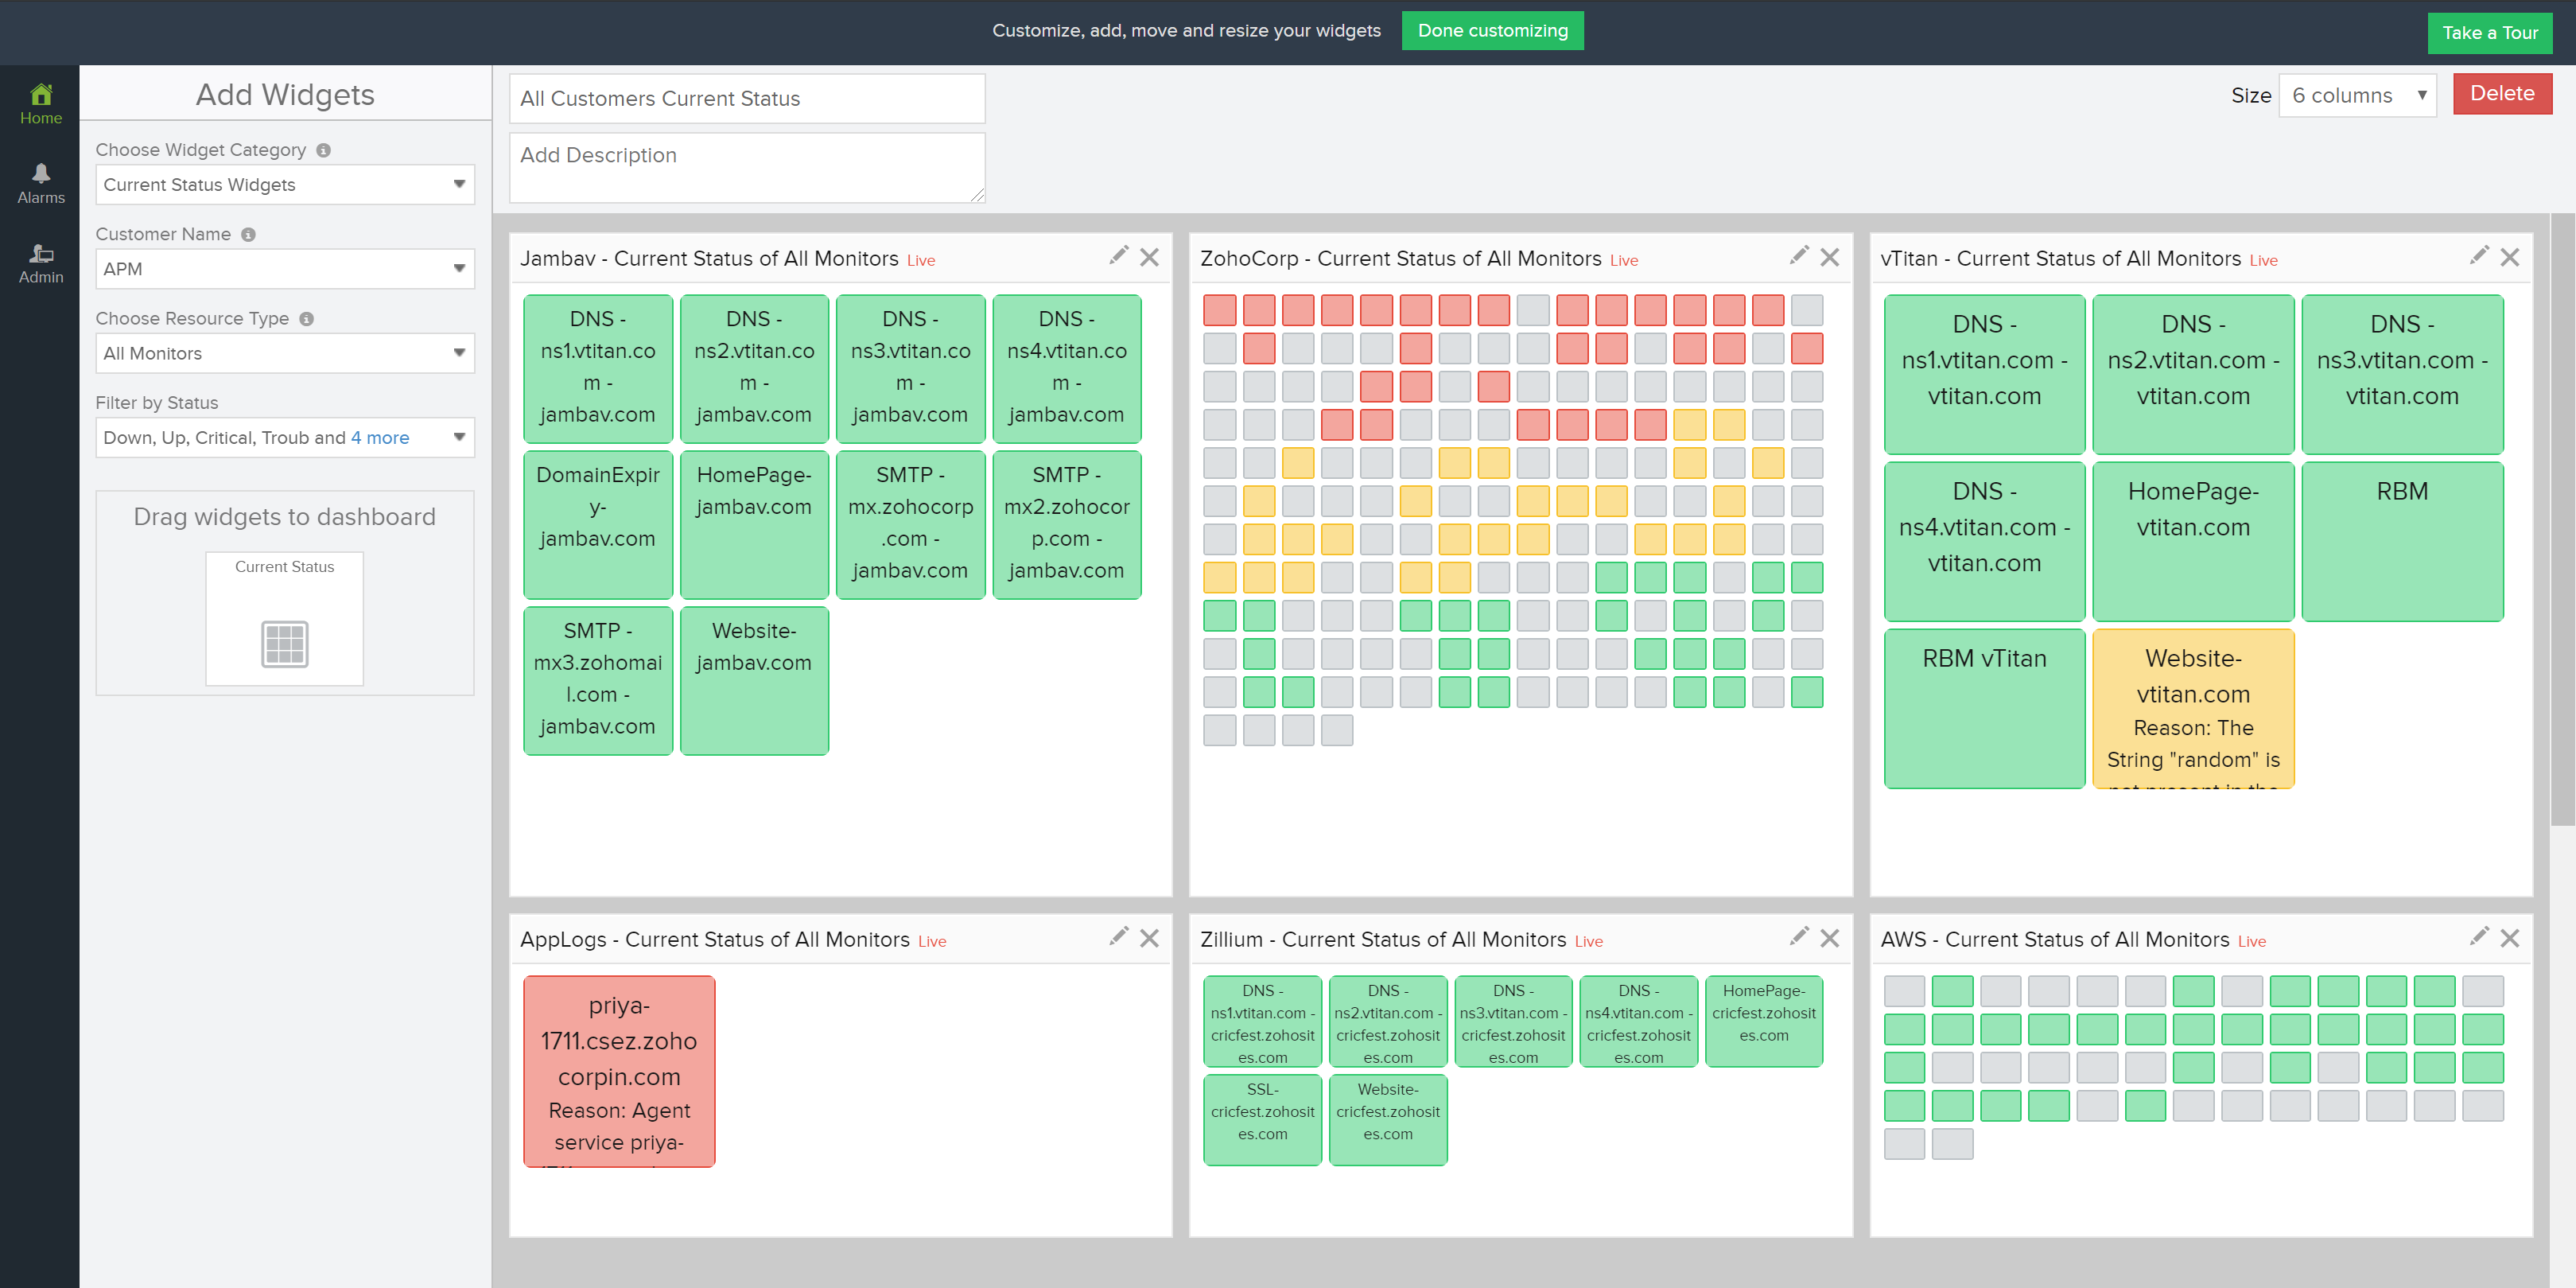
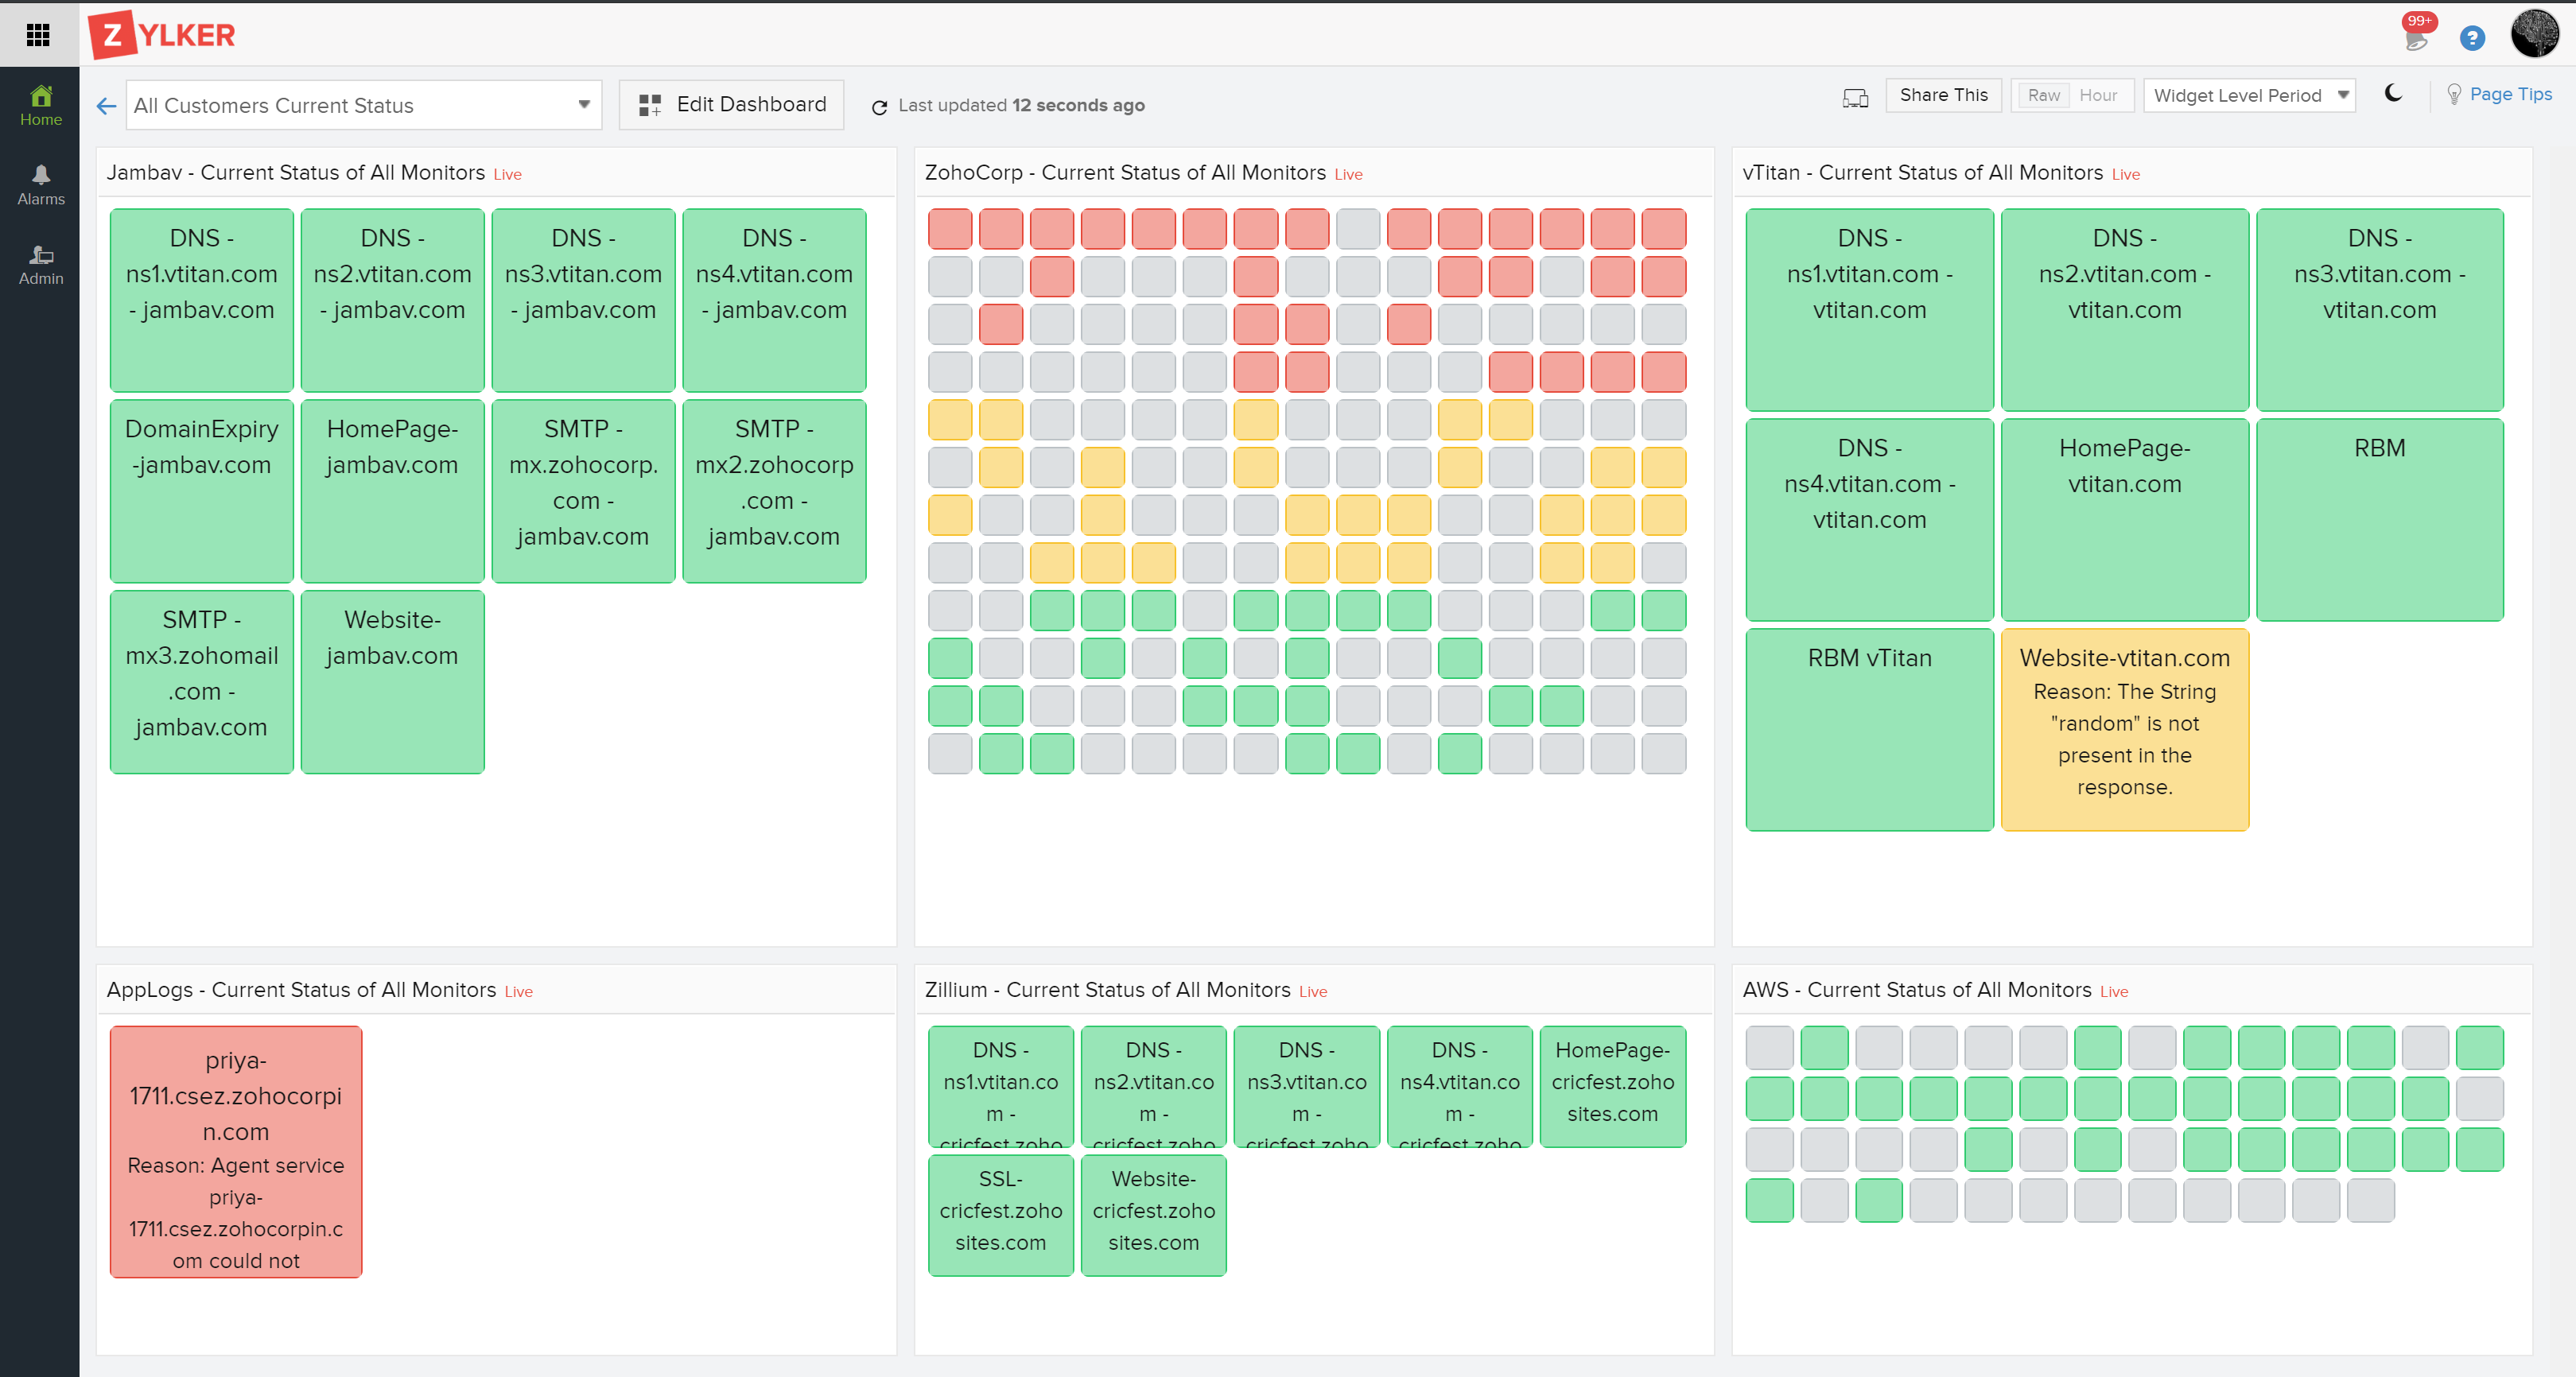
This will help you have an overview all your customers monitors status.
PS 1: You can add upto a 100 widgets in a single dashboard currently. To overcome this you can create another dashboard with the rest of the customers.
PS 2: You must select each customer while choosing from the customer list. I agree its a tedious process, we will have that improved by selecting multiple customers and have as many widgets when dragged.
-Jasper
Product Manager, Site24x7
That's tremendously helpful, thanks.
As it happens, we don't find the NOC view terribly useful. We're not a shop that spends a lot of time staring at glass screens.
But that customized dashboard - i had *no* idea! Already built out a demo - we'll populate it and that's a hugely good way to solve the problem of not knowing what is broken.
~bdunbar
Jasper, I may have spoken too soon. I'm not sure how to select the metric that will show me 'has not polled in x days' which is the metric we used to find the errors with AWS, and the on-prem pollers.
Your thoughts?