Troubleshoot issues related to slow applications easily by managing MySQL slow query logs. Once you configure log collection, Site24x7 first collects MySQL slow query logs from your servers, then indexes, analyzes, and presents you with intuitive data to troubleshoot real-time issues.
Why is it important to manage MySQL slow query logs?
The MySQL database server logs the queries that take longer to execute than the configured threshold in the MySQL slow query logs. Slow queries can have a huge negative impact on a database's performance. If you don't analyze and take corrective action on slow queries as soon as possible, this can affect the performance of your whole system.
Analyzing the slow query logs is crucial to:
- Identify slow applications.
- Examine the cause for lag.
- Visualize the top slow queries.
- Drill down to the slowest queries.
- Study the impact of the slow query on the application.
- Optimize the performance of MySQL database servers.
How MySQL slow-query-based debugging helps
MySQL slow query logs can be the right place for database admins to debug issues and identify:
- High load spots in MySQL
- Longer response times due to multiple left joins
- Database slowdowns
How Site24x7 manages MySQL slow query logs
First, create a log profile to manage MySQL slow query logs using Site24x7. Define the log pattern and log files, and complete the configuration. Site24x7 will start to collect your MySQL slow query logs using the Site24x7 Server Monitoring agent and upload them to the logs server.
The logs are separated into fields like name, user, host, query time, lock time, rows sent, rows examined, database used, timestamp, and query. You can filter and analyze logs using the query-language-based search. You can also save frequently used queries and configure alerts for them.
Simplified search and analysis
Identify all the slow queries at one glance using the following query:
logtype="Mysql Slow Logs" histo querytime range (5s, 30s,1m,5m,30m)
Using the above search query, you'll get a list of the number of slow queries for the given time ranges (five seconds, 30 seconds, one minute, five minutes, and 30 minutes). Further, you can click on the count to view the actual slow queries.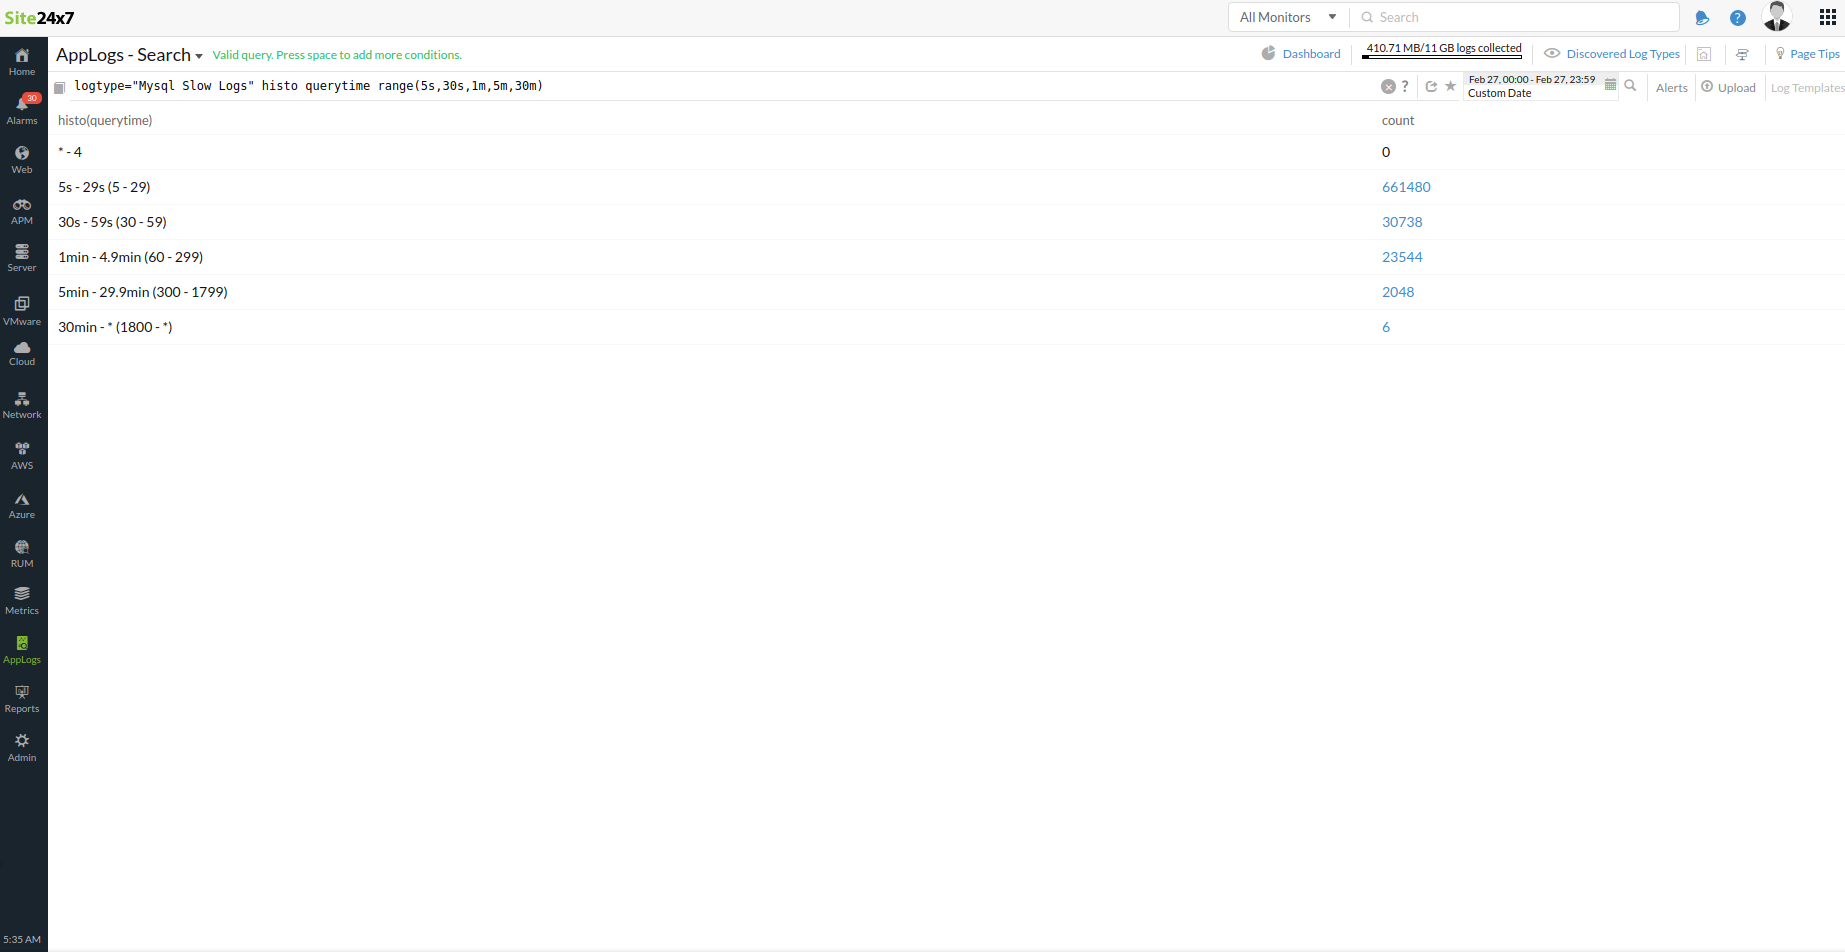
An exclusive MySQL slow query logs dashboard
Obtain a holistic view with the MySQL slow query logs dashboard with widgets for different metrics like the number of slow queries, maximum query time, maximum rows examined, maximum lock time, slow queries over time, top users, top hosts, top databases, and top 10 slow queries by query time, lock time, rows examined, and rows sent.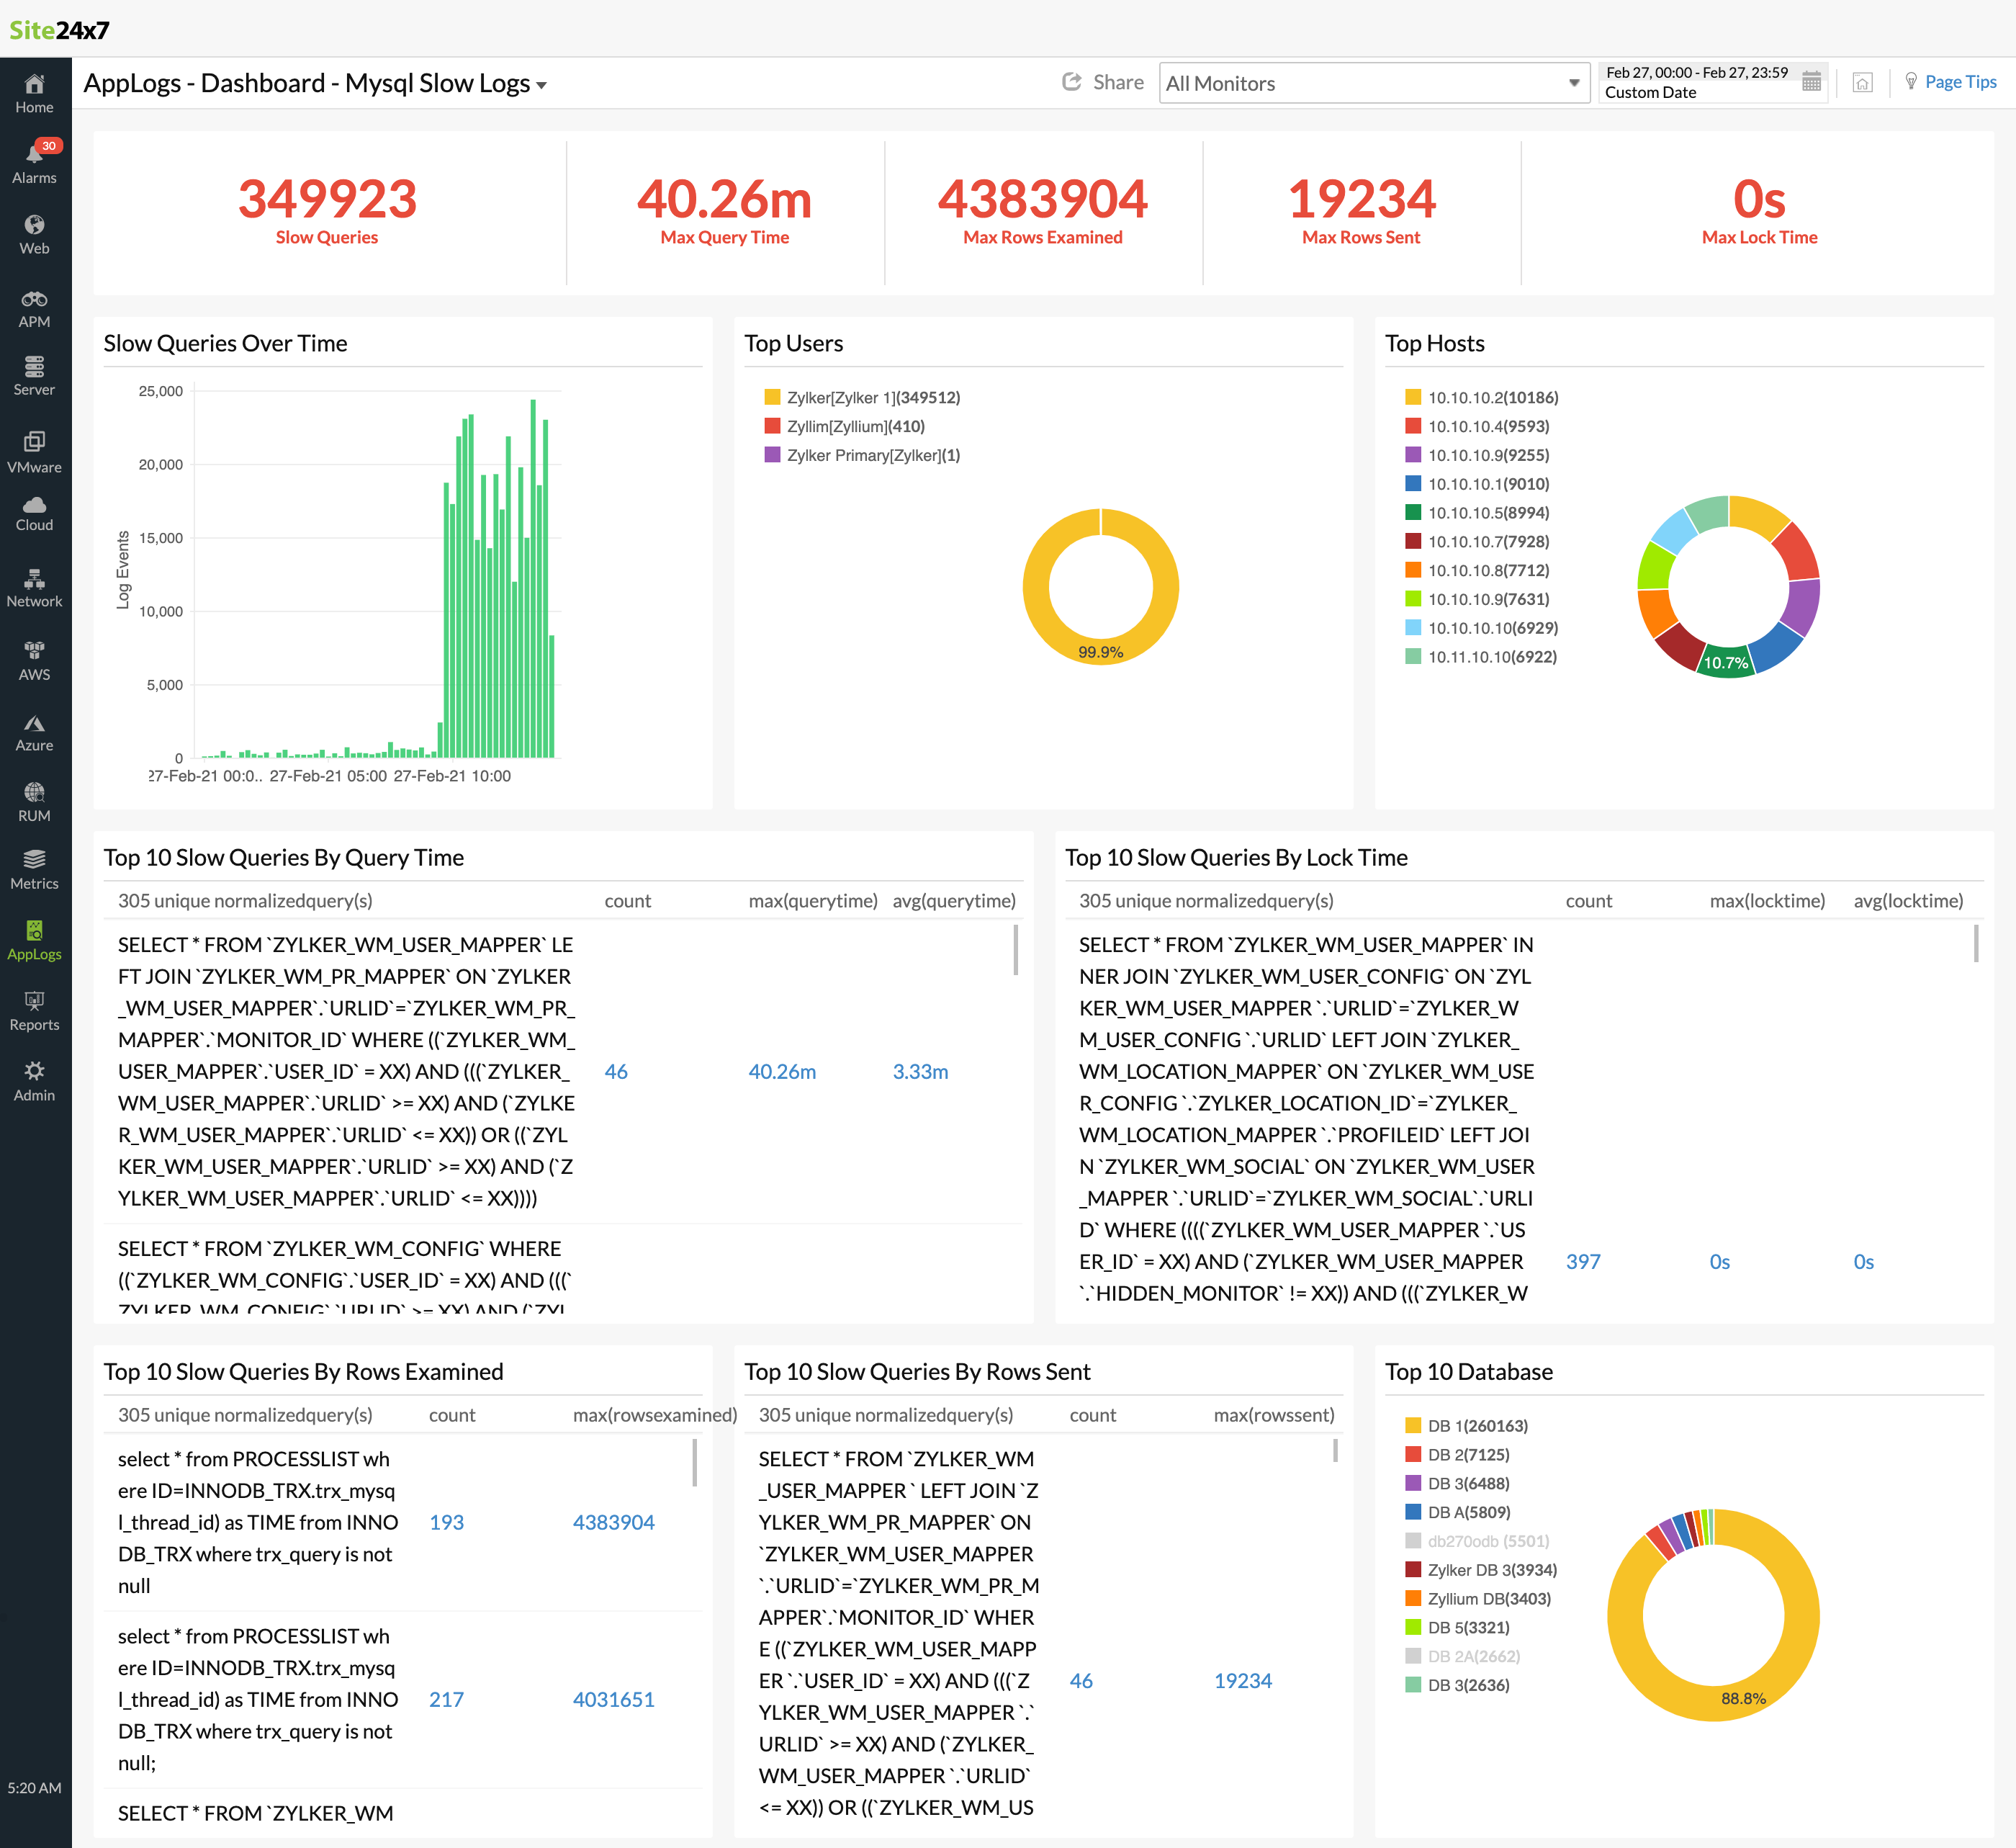
Getting started
Get started with managing your MySQL slow query logs by configuring and uploading your logs to Site24x7.
Feel free to drop your feedback and enhancement requests in a comment below.
Until next time,
Happy monitoring