I'm looking to display the Performance data on the Site24x7 home page, like it does for non-plugin monitors. Non-plugin monitors will show things like disk space utilization, network I/O, CPU usage etc. I've included the following picture for a clearer idea of what I'm looking at:
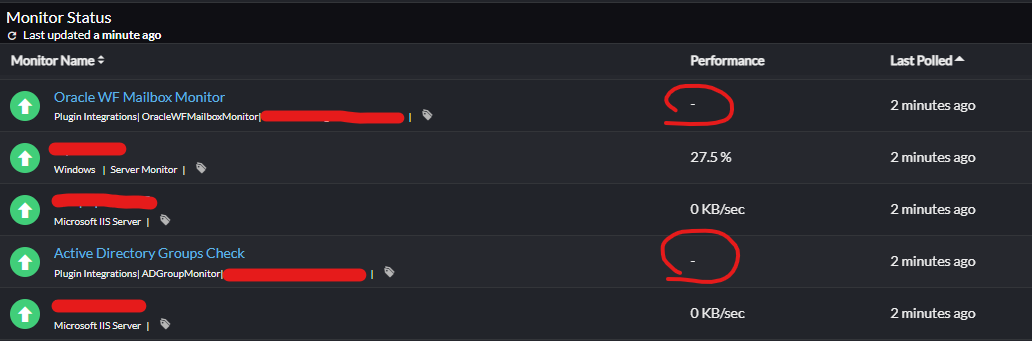
Some things, like the mailbox monitor, return only one unit: a number. The Group Check monitor I have returns multiple units of numbers. I'd like to apply the same logic the non-plugin monitors show, as server monitors have more than one unit (CPU, disk, network, etc) and the website chooses which to display dynamically (I'm guessing whatever is highest). How do I do this with my plugin monitors?
Sorry - this should have been posted in "Plugins", but the question still applies.

Product Manager,
Site24x7
Wow, I had been on that page before, but never seen the "Next" button in the corner. Thank you!