Greetings!
We are happy to introduce an updated Cassandra monitoring plugin integration to monitor your Apache Cassandra database.
Apache Cassandra is an open-source, distributed NoSQL database management system that is built to handle large volumes of data. It is highly scalable and fault-tolerant, offering users high performance and low latency.
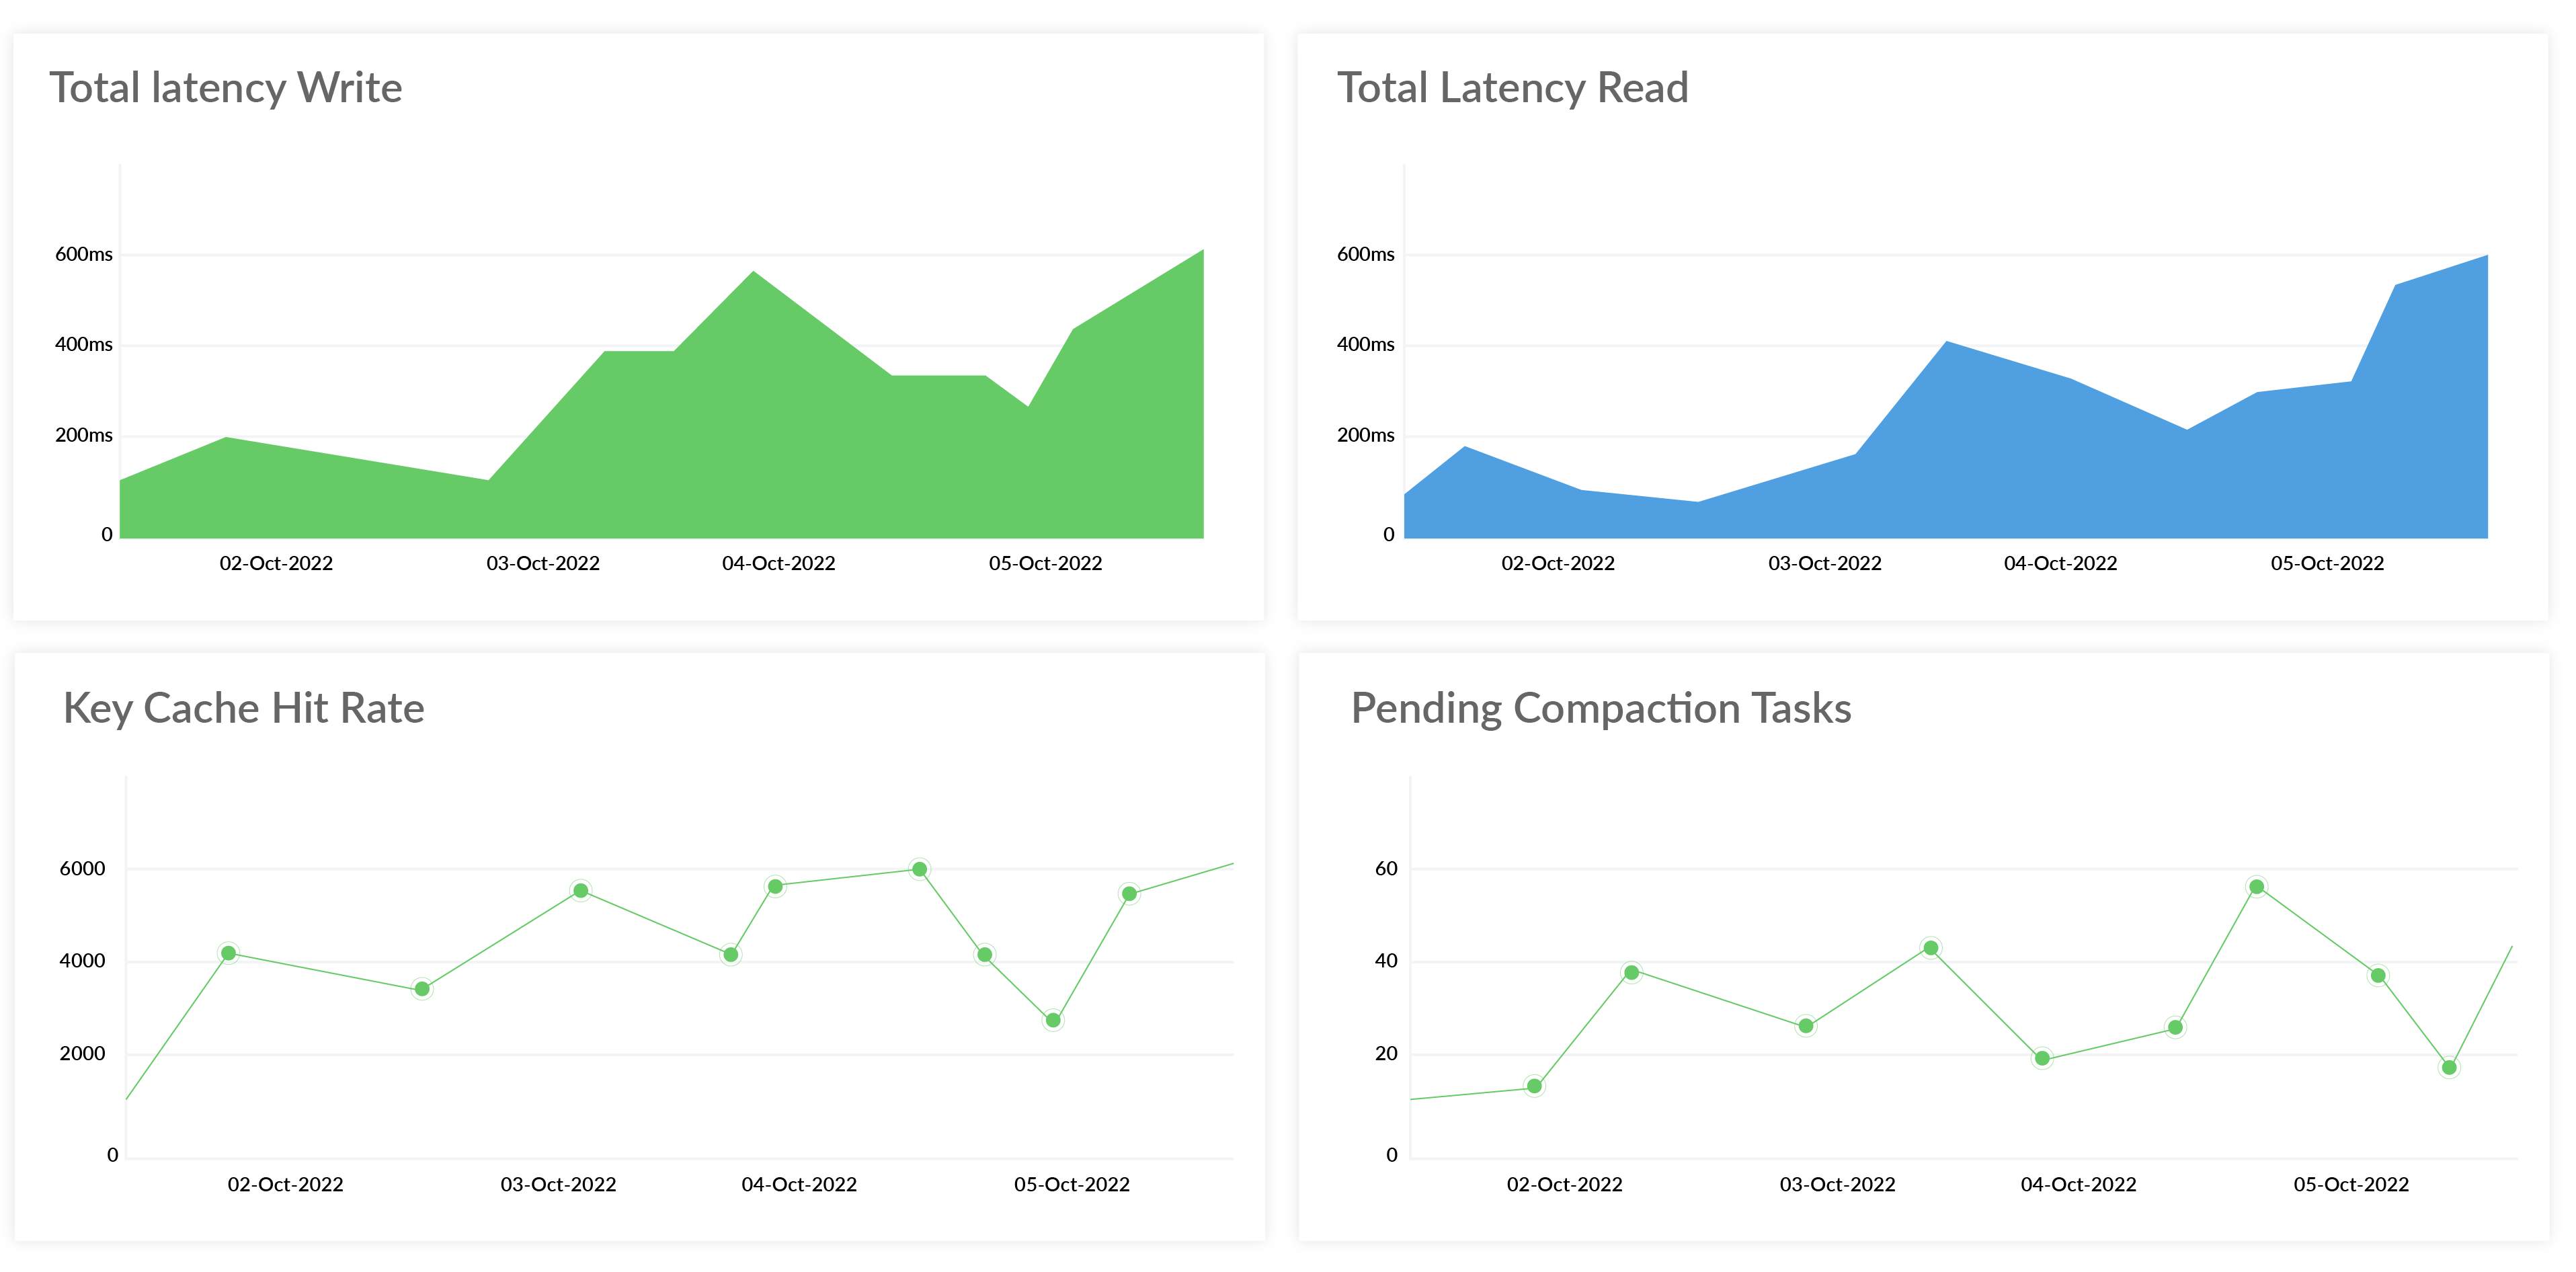
Track critical metrics, including throughput, key cache hit rates, and latency, to gain visibility into the health of your Cassandra database. You can also monitor error metrics like exceptions and pending compaction tasks to stay ahead of issues before they start affecting end users.
Site24x7's Cassandra plugin tracks the following metrics:
- Total Latency (Read)
- Total Latency (Write)
- Cross Node Latency
- Total Hints
- Throughtput (Writes)
- Throughtput (Read)
- Key Cache Hit Rate
- Disk Used
- Completed Compaction Tasks
- Pending Compaction Tasks
- ParNew Garbage Collections (Count)
- ParNew Garbage Collections (Time)
- CMS Garbage Collections (Count)
- CMS Garbage Collections (Time)
- Exceptions
- Timeout Exceptions (Write)
- Timeout Exception (Read)
- Unavailable Exceptions (Write)
- Unavailable Exceptions (Read)
- Pending Tasks
- Dropped Mutations
- Pending Flushes
- Blocked On Allocation
- Currently Blocked Tasks
Install the plugin and stay on top of your Apache Cassandra database performance.
We encourage you to check out our growing list of more than 100 plugin integrations to monitor your entire application stack.
Until next time,
Happy monitoring!