We are using the page browsers a lot to analyze performance issues. Most of the time, due to small things, we need to do a manual check on GOOGLE CHROME developer.
Here are my suggestions:
1) a graphic correlation between PAGE SIZE and LOAD TIME. Is important to understand if the page load increased because of a larger size or a slow resource
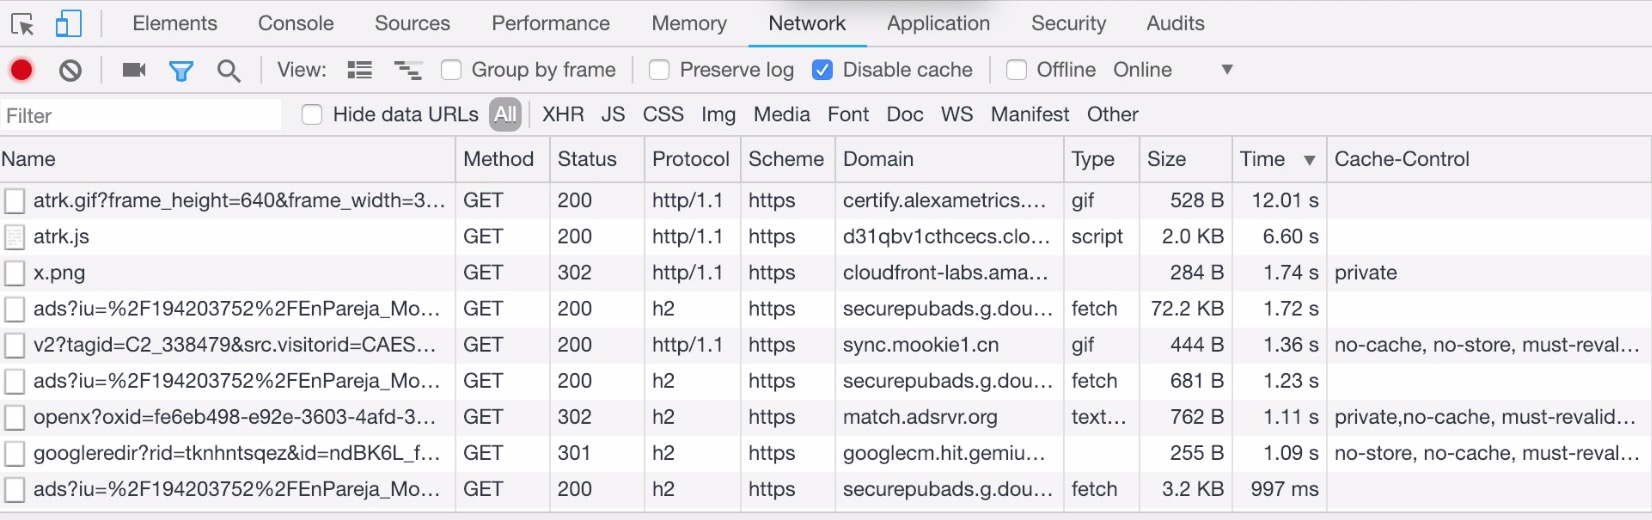
2) the waterfall chart does not allow to SORT based on timings (see Chrome screenshot) and does not show the time in ms a resource took to load. For same reason it shows the TTFB. On this screenshot I was able to quickly identify a resource taking 12 seconds to load and another taking 6 seconds.
3) also on the waterfall it will be great to visually identify the resources that took more than a second to load (configurable) or the TOP 10 slower resources
Regards
Hernán.