Hi Team,
I would like to know if Site24x7 supports APM monitoring for Web Apps in Azure App Services.
We are expecting of something like getting details of each transactions to the Web apps like its Function Execution flow and time consuming function, it's Database call and HTTP calls,etc.. Very similar to what AppDynamics shows.!
If yes, how can i configure it in my Azure app service? We would be glad to explore it.
-Peter
Hi Peter,
Yes, you can enable the APM via Azure app service extension. Kindly refer the below help link for adding agent,
https://www.site24x7.com/help/apm/dotnet-agent/monitor-azure-app-services.html
Please let us know, if you have any clarifications or difficulties on installing the agent.
Hi Anbu,
Thanks ..! Yeah.. I gave a try on it.! Looks cool.!
I can see number of requests and it's time taken. But is there option to view the transaction path of a slow request?
We would like to check the following..
- The Function execution flow of each transaction and time taken by each function.
- The Database or HTTP or Web Service call if any in the transaction and will you be able to capture the queries??
- The complete flow of the transaction.
Hope you got our requirement.!
Hi Peter,
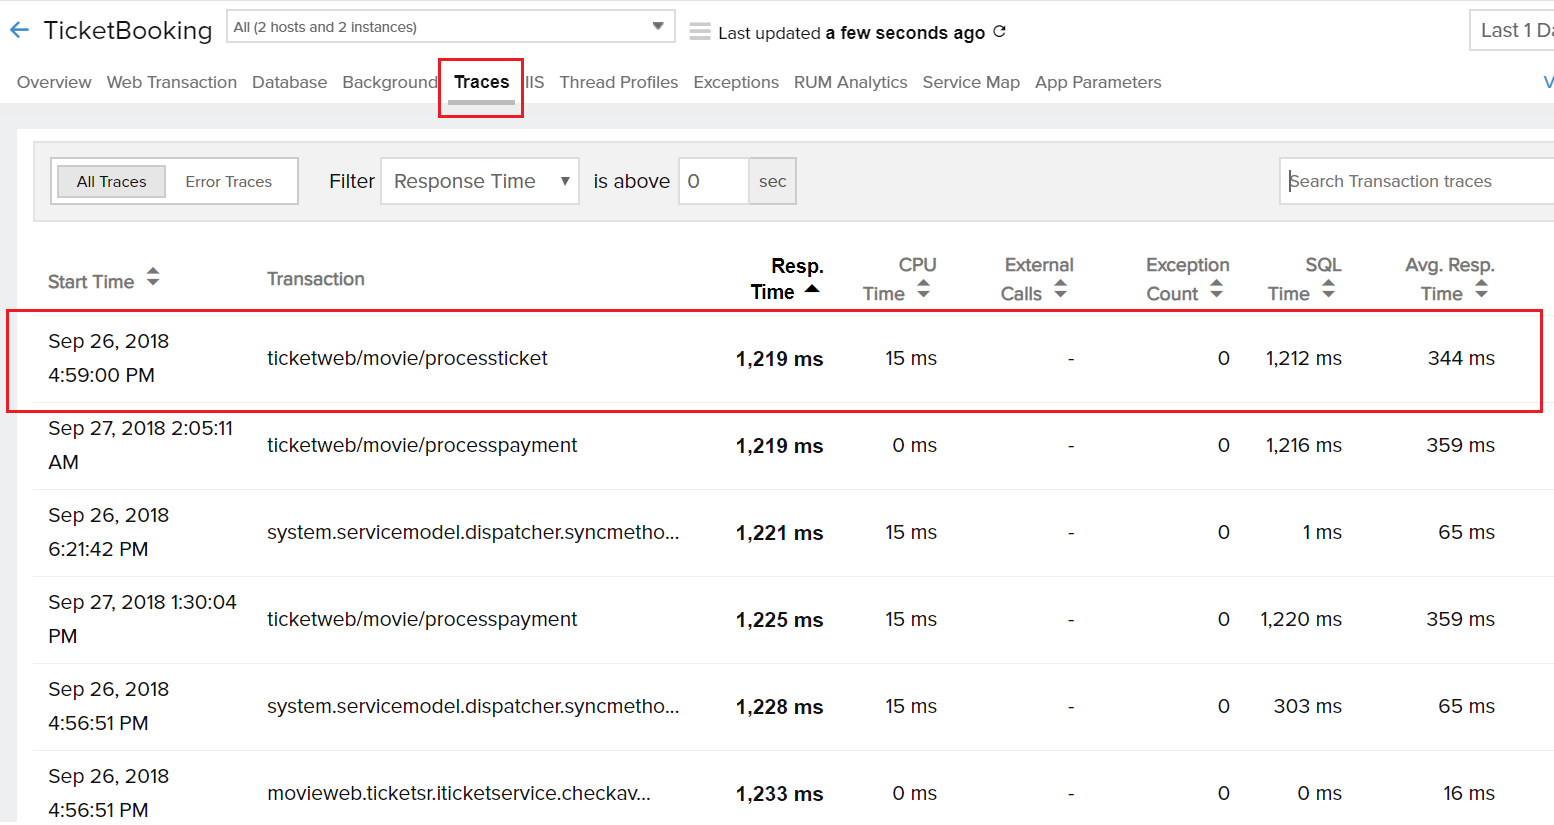
The mentioned details for a transaction will be shown under Traces tab. It shows the details about remote calls, SQL queries and function calls involved in the transaction.
Please refer the below screen shot to navigate to the transaction trace under Traces tab,
The complete trace details will be displayed by clicking the corresponding transaction as shown below,
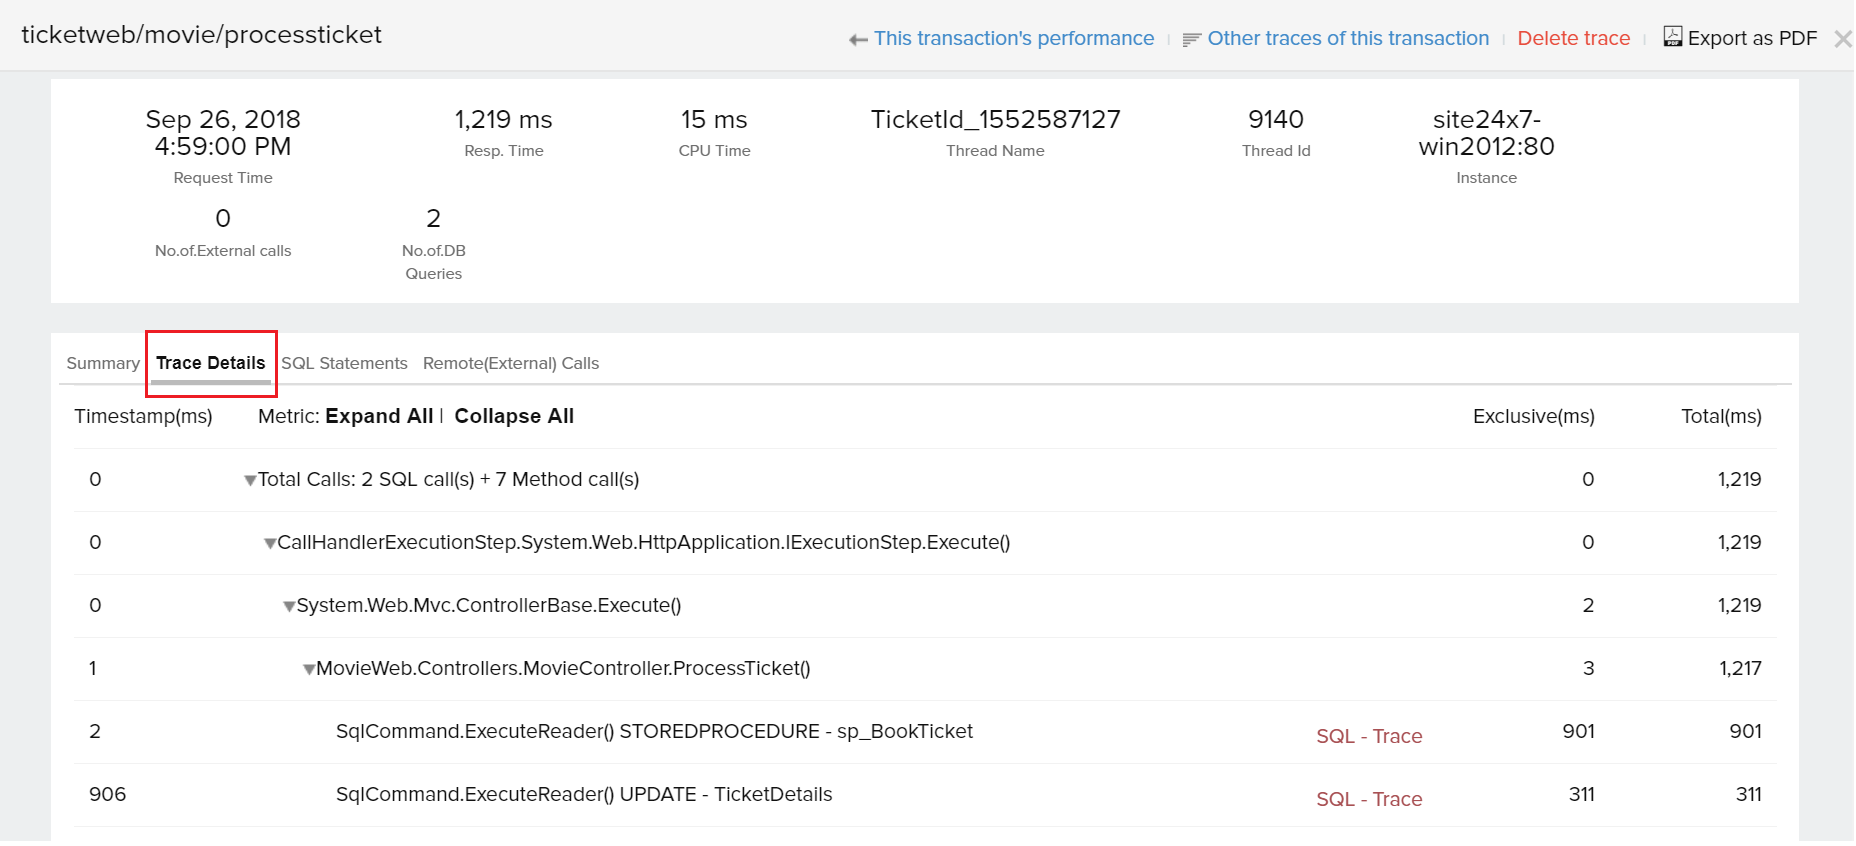
Note: By default, the traces will be captured when the transaction response time exceeds 2 seconds. You can change it via Edit Agent Configuration -> Transaction tracing threshold.
Thanks Anburaj, We can able to see the traces of the transactions.! But, We noticed a flag COMPLUS_LoaderOptimization in the environment variable of the process.
Wont it cause performance overhead in my production environment ? (As it is not recommended for production from an Microsoft article)
Hi Anburaj,
Without the environment variable the process seem to crash. I believe that COMPLUS* is necessary for Site24x7 but we are still not sure about the performance overhead.
Thanks
-Peter
Hi Peter,
Please note that LoaderOptimization only affects how assemblies are loaded and shared across application domains (domain-neutral assemblies, and they can only be loaded from GAC). JIT-compiled code cannot be shared for assemblies loaded into the load-from context. .NET agent assemblies are JIT compiled, and will be loaded from the installed path using LoadFrom context.
Hence, we need to set this environment variable to force load .NET agent assemblies individually for every app domain. Only when you precompile your assemblies with NGen.exe (Native Image Generator), does this setting has any performance effect (additional memory usage due to loading multiple copies of domain-neutral assemblies).
Hi,
How do you set or disable the COMPLUS_LoaderOptimization environment variable in app service?
- Ken
Hi,
I try to connect Azure App Service to the Site 24X7 monitoring tool via APM Insight .Net Agent. But, I got a "Profiler is not loaded in the application" error while monitoring the health of the application.
Conclusion: The application monitoring dashboard not shown in the Site 24X7 monitoring tool.
Thanks,