Hello,
would be great if you can show the metric "Blocking Threads" in the APM Java/Threads Tab.
This is possible if you do a thread dump in the background and count all the threads which are in state "BLOCKED".
This is very helpful in analysis when application hangs or very slow. Often the reason is you have lots of blocking threads. Hundreds of threads are waiting for one thread.
Also it would be great if you can trigger manually and automatically a thread dump. (for automatic: per threshold if application is slow or per state if application is down (triggered by website monitor :))
The thread dump should be visible inside site24x7 and a download should be possible. (a history of latest thread dumps over time would be also helpful).
Thanks and regards,
Torsten
Hi Torsten,
Thanks for posting your request here. Yes, thread dumps are important data for debugging an application. We do have plans to include this feature in APM Insight. Please follow this space, will keep posted
Regarding blocked threads count metric, it will be available in our next Java Agent release
Regards,
Adhi
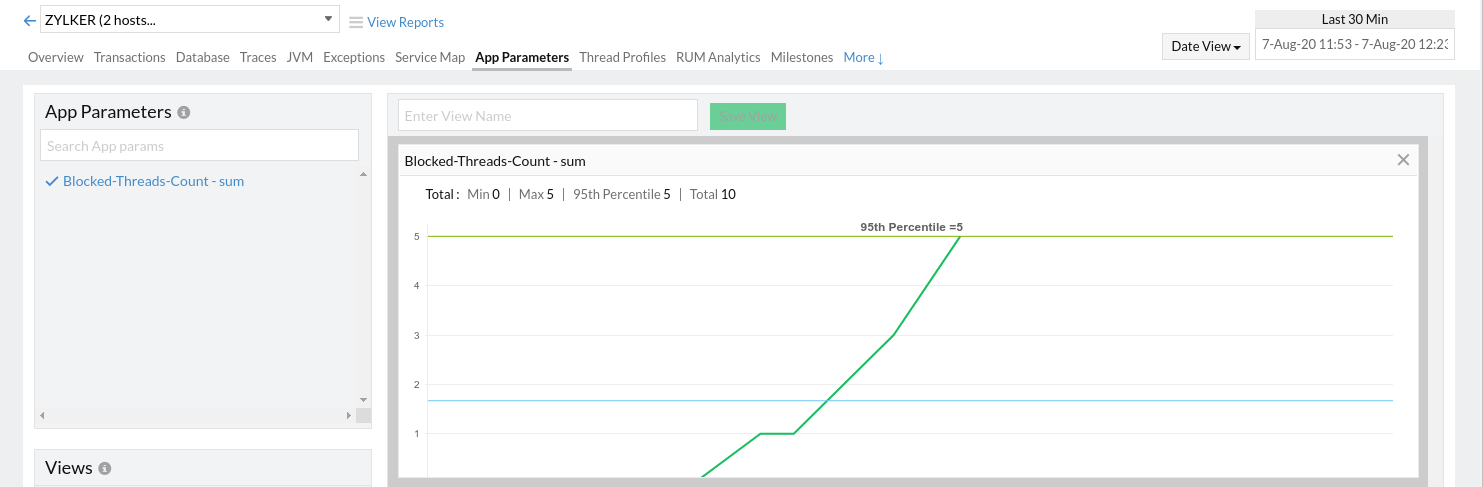
Hello Torsten,
The blocked thread count metric is now available in Java Agent v4.9, which has been made live.
You can find the metric displayed under App Parameters tab
Thanks
Adhi
Cool! Thx! I'll test it as soon as possible. At first we have to upgrade our agents.
Torsten