Improve Your Application Performance with Site24x7 APM Insight
Once you have confirmed that there is an issue with application performance or its availability, how do you pinpoint the issue so you can find and fix the issue?
With Site24x7 APM Insight~you can drill into all layers of your applications to determine the source of the problem.~You will be able to analyze down to the database transaction to identify when and where the application performance was impacted.
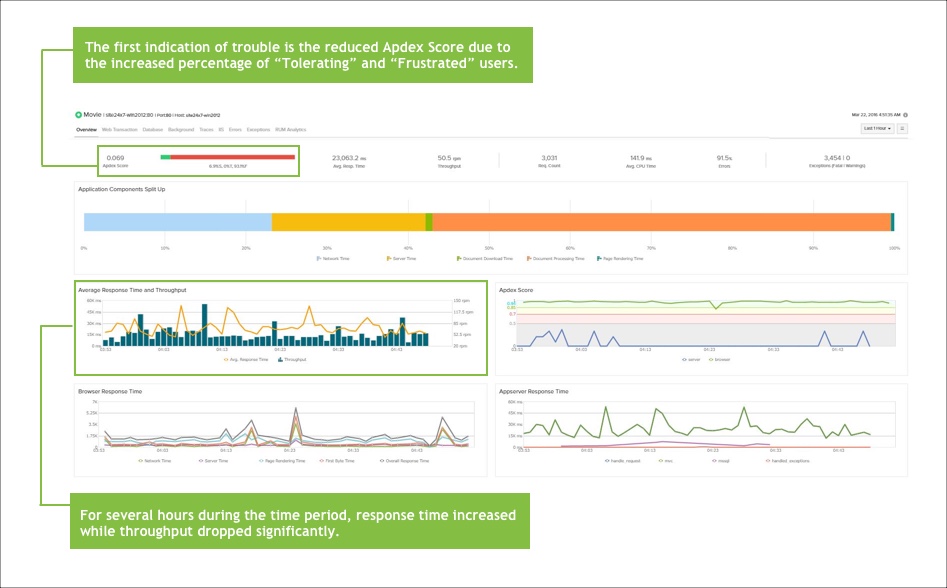
Here is an example showing how you can perform deep analysis once an issue is discovered: From this overall view, we can then look at each specific transaction, identify long running ones and then drill into the cause of the long response time.
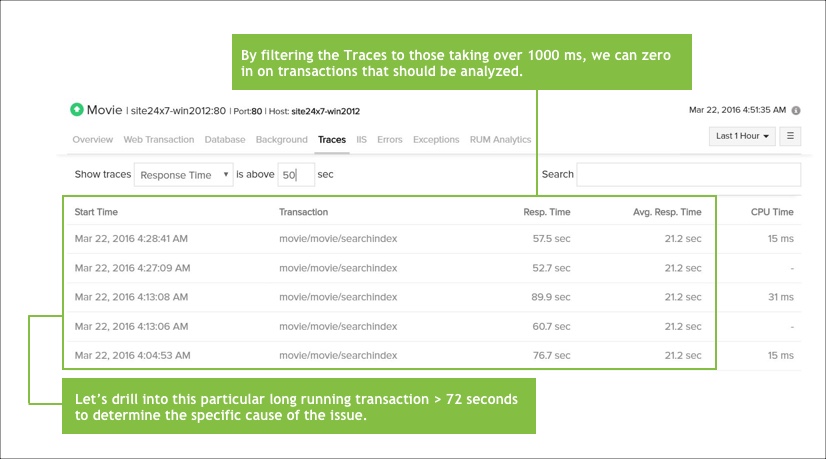
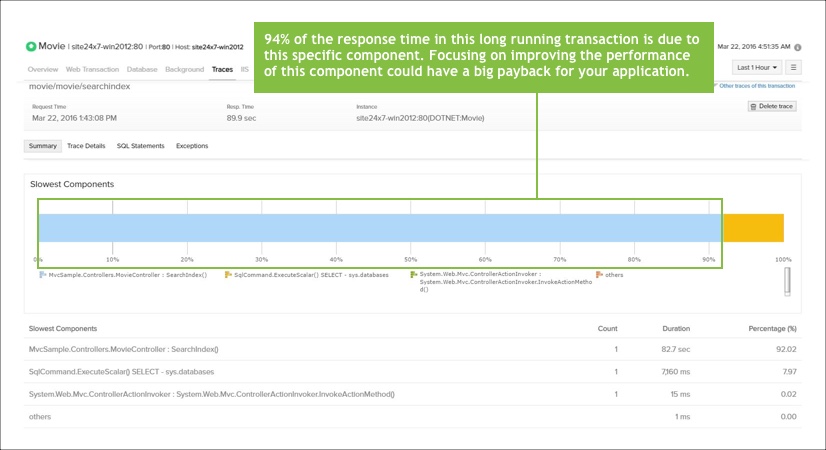
Most components in a modern web application can make identification of the cause difficult and time-consuming. The details of a transaction will help you discover the source of the long response time. By reviewing and analyzing specific instances of problematic transactions, your team will be able to focus on areas of improvement. Since Site24x7 APM records all transactions, you can investigate issues even if your application is running well at the present time.
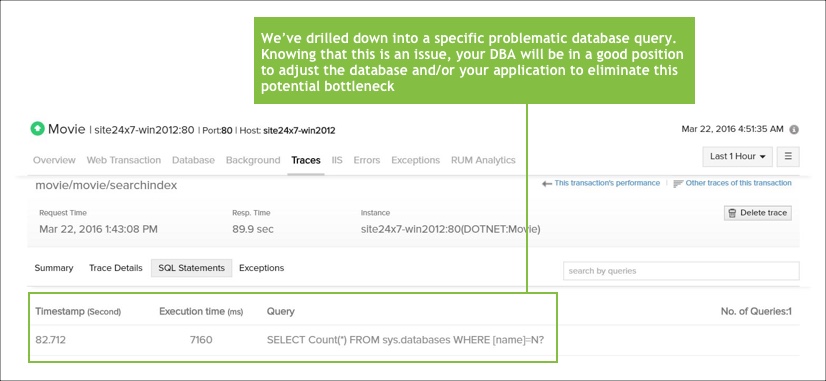
Once the problematic component is identified, a deeper look into the specific database query will help determine your next move. Depending on what the query is doing and how frequently it is responding slowly, you may want to optimize your database indexing differently, make changes to your data schema, break apart the single query into multiple, or make some change to your application to result in a more optimized query.
Once you identify a time period during which your application performed poorly, you can use Site24x7 APM’s traces to analyze specific instances as well as potentially interacting components. Depending on what you find, your solution to improving performance and availability will vary. For example, occasional single long-running transactions may have unique characteristics or be edge cases that your application does not handle well.
On the other hand, you may see that during certain periods every week, your application is not performing well for many transactions. That could indicate that there is a high periodic load for which your application can’t scale, or perhaps there are maintenance activities that are unexpectedly impacting your production application.
Ready to gain code-level visibility into one single monitoring console to monitor and optimize your Web Operations? Sign-up for a free Site24x7 trial account! Want to share your Web monitoring strategy with IT peers, DevOps and developers teams? Visit our Site24x7 community forums!
Happy Monitoring with Site24x7!