Free Java Thread Dump Analyzer Tool for DevOps
Has your Java app ever slowed down or stopped responding? And you had to scroll through multiple thread dumps looking for the deadlocked threads? Not anymore! Because we now have a tool that simplifies this process for you. Simply enter your thread dump in the text box provided and voil�: Site24x7 Thread Dump Analyzer presents provides a comprehensive view of the status of various thread dumps in no time.
You can then easily detect bottlenecks that degrade your Java Virtual Machine performance. A Java app's performance can degrade due to many reasons, such as deadlocks, lock contention, or even high CPU load due to infinite looping of a Hashmap. The Java algorithm might be expending resources excessively or there might be an issue with accessing I/O resources. So, how do you drill down to the exact cause? Look no further than the Thread Dump Analyzer tool.
Awesome Java Thread Dump Viewer
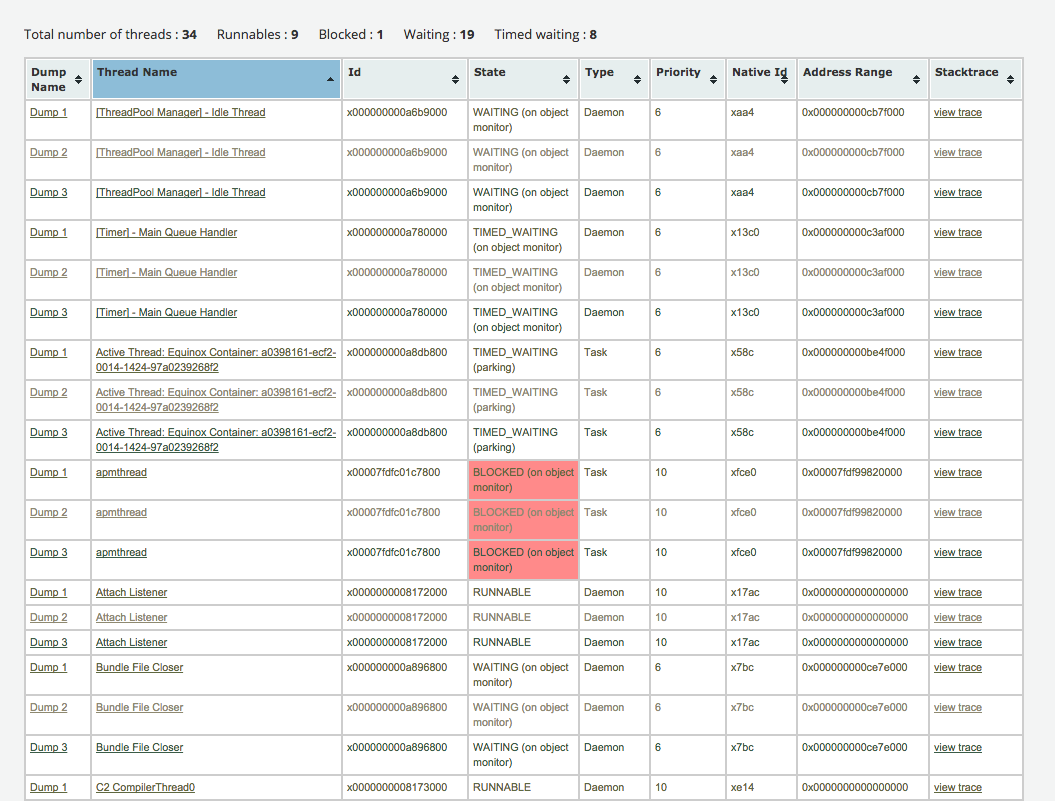
When you have several thread dumps to search through, simply enter the thread dump in the text box provided in the tool. Immediately, you will be scrolled down to a tabular view of the thread details such as thread IDs, states, types, priorities, native IDs, and address ranges. The blocked threads will be highlighted in red so that you can spot them easily. The tool also displays metrics such as the total count of threads in the dump, along with those in the runnable, blocked, waiting, and timed waiting states.
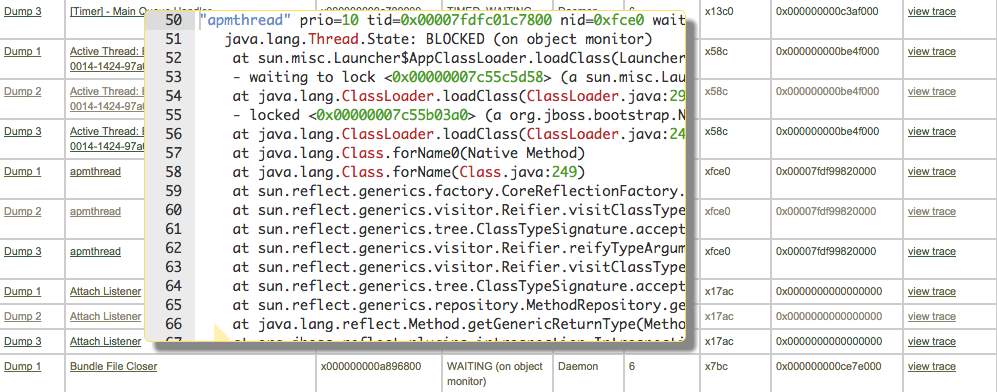
When you click a thread, the stack trace is displayed so that you can easily drill down to the faulty code. This way, you can get your applications up and running quickly!
Compare Multiple Thread Dumps
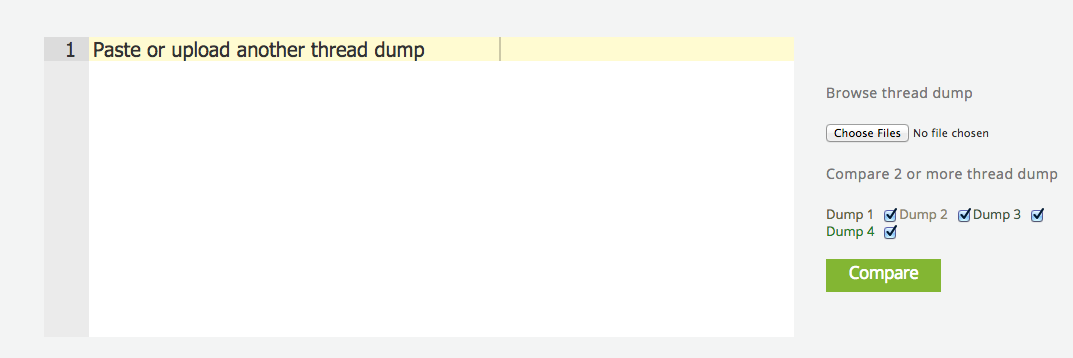
The tool also enables you to compare the thread dumps entered at different times and determine the differences between the threads. To analyze specific threads, simply uncheck the remaining thread dumps and click compare. The details of only the desired thread dumps will be displayed. You can work on the states of individual threads so that there are more runnable threads than in the waiting blocked or timed waiting states, optimizing the app's performance.
With complex, multi-threaded Java applications getting subjected to sporadic, unanticipated crashes rather frequently, our tool couldn't have come at a better time. Using this tool, you can easily visualize Java thread dumps faster and make debugging less cumbersome and effective. For more insight on all components of your Java transactions from URLs to SQL queries, check out Java Application Monitoring.